


Services on Demand
Article
 English (pdf)
 Article in xml format
 Article references
Indicators

Related links
-
 Cited by Google
 -
 Similars in Google
Share

 Permalink
South African Journal of Science
On-line version ISSN 1996-7489
Print version ISSN 0038-2353
S. Afr. j. sci. vol.118 n.7-8 Pretoria Jun./Aug. 2022
http://dx.doi.org/10.17159/sajs.2022/13118
RESEARCH LETTER
Increased risk of heat stress conditions during the 2022 Comrades Marathon
Henno HavengaI; Ben CoetzeeII; Roelof P BurgerI; Stuart J. PikethI
IUnit for Environmental Sciences and Management, North-West University, Fotchefstroom, South Africa
IIPhysical Activity, Sport and Recreation Research Focus Area, Faculty of Health Sciences, North-West University, Potchefstroom, South Africa
ABSTRACT
The Comrades Marathon is South Africa's - and the world's - most recognised and largest ultra-marathon event, with over 15 000 participants from across the globe competing in the 89-km road running event each year. Historically, the event has been held before the start of austral winter (20 May - 17 June). However, in 2022, organisers of the race moved the event to 28 August, when austral spring commences. We explore the climate, in particular the Universal Thermal Comfort Index (UTCI), of past Comrades events (1980-2019) and compare these data to UTCI data of the new proposed date (28 August) for the same period. The climatology for May, June, July and August was determined to identify periods with the lowest risk for 'strong' to 'very strong' heat stress. Results show that participants' risk of exposure to 'strong' heat stress and 'very strong' heat stress periods will be more likely if the event is held in August as compared to the original event dates. Therefore, it is concluded that mid-June to mid-July has the lowest risk of heat stress exposure along the route. Runners and organisers should be aware of the higher risk of exertional heat illness during the 2022 Comrades Marathon to ensure safe participation.
SIGNIFICANCE:
• The new proposed date for the Comrades Marathon will increase the risk of exposure to 'strong' and 'very strong' heat stress conditions, as defined by the Universal Thermal Comfort Index (UTCI).
• The UTCI indicates that mid-June to mid-July has the lowest risk of heat stress exposure at the three reference points along the route.
• Organisers should warn runners of the higher risk of exertional heat illness due to the possible exposure to high UTCI values or more unfavourable climatological conditions. Furthermore, runners should be informed of a variety of preventative strategies to ensure safe participation.
Keywords: UTCI, Comrades Marathon, heat stress, thermoregulation
Introduction
The Comrades Marathon is a 89-km road-running event between Durban and Pietermaritzburg in the Kwazulu-Natal Province of South Africa, and is perhaps the most recognised ultra-running event in the world.1 The event was first hosted in 1921, and despite disruptions during World War 2 (1941-1945) and more recently during the COVID-19 pandemic (2020-2021), has been hosted on 94 occasions, making it the world's oldest ultra-marathon.1,2 Since 1980, the race dates were set either for the last week of May or for the first two weeks of June, with the earliest race date set as 20 May in 1995 and the latest date as 17 June in 1996, 2002 and 2007. Therefore, the race dates usually fall within early austral winter. However, in 2021, the event organisers announced that the Comrades Marathon of 2022 will be held on 28 August, two days before the start of austral spring. Organisers cited the extended daylight as a motivating factor for hosting the event in August, stating that the temperatures are still safe enough to host the event during this time.3 Despite this notion, there is no indication that event organisers examined climatological data to verify their decision. Heat stress in athletes can have potentially catastrophic health and performance consequences, which justify the importance of doing an in-depth study of possible changes in climatological conditions that runners will face due to the new start date.
Exertional heat illness, which encompasses exercise associated with collapse due to heatstroke, is the most common medical attention-requiring condition that athletes experience during participation in marathons.4 High temperature and humidity seem to be significant factors for developing exertional heat illness in athletes.5,6 However, athletes are also at risk of attaining lower performance levels. Exercise capacity (time to exhaustion) decreases together with an increase in perceived exertion as environmental temperature and relative humidity increase.7 Contrary to previous research, more recent research concluded that the performances of top-level marathon runners show higher decreases in performances due to higher temperatures than do slower runners.6 This trend in results was attributed to the assumption that top-level runners work at a higher intensity than their slower counterparts and will probably surpass their physiological limits to cope with the adverse effects of heat stress.6 The possible mechanisms that underlie the risk of developing heat illness and attaining lower performance levels when exercising in hot and humid conditions are: the extra cardiovascular strain that is caused by a redistribution of blood to cutaneous vascular beds together with the maintenance of perfusion due to exercising muscle oxygen delivery; an exacerbated reduction in cerebral blood flow via central inhibition; the downregulation of skeletal muscle recruitment via lower central neural drive; and a progressive shift in energy substrate mobilisation to the utilisation of more glycogen and less fat.8
The risk for exertional heat illness is high when the wet bulb globe temperature exceeds 28 °C during especially higher-intensity exercises (>75% of V O2max) and/or when strenuous exercise is performed for longer than 1 hour.7 Although various studies made use of the wet bulb globe temperature as a measure for assessing heat stress in athletes9, the Universal Thermal Comfort Index (UTCI) is regarded to be a better measure to model sports heat stress10. Therefore, the UTCI was previously used to examine the effect of different thermal conditions on runners during 12 New York City Marathons and the risk of heat stress during the 2021 Olympics marathon by evaluating the sensation index.6,9,11 The expected daily incidence rate of heat-related illness among athletes who participated in international outdoor World and European athletics championships between 2009 and 2019 increased by 0.14 per 1000 registered athletes for each degree of increase in UTCI, doubling from 25 to 35 UTCI.12
The last-mentioned researchers reported no severe heat illness below a UTCI value of 28. They also found that athletes who participated in endurance disciplines experienced a higher incidence of heat illness than those who participated in explosive disciplines.11
These findings provide a guideline according to which climatological conditions can be interpreted to ascertain the possible risk athletes face of experiencing exertional heat illness or a decrease in running performance. Therefore, the purpose of this research was to examine the climate of the past 40 Comrades Marathon events (1980-2019). Particular focus was placed on the UTCI as an indicator of heat stress to examine the possible prevalence of heat stress among runners and predict the possible influence of a change in climatological conditions on the incidence of exertional heat illness among athletes if the event is held in August.
Data and methods
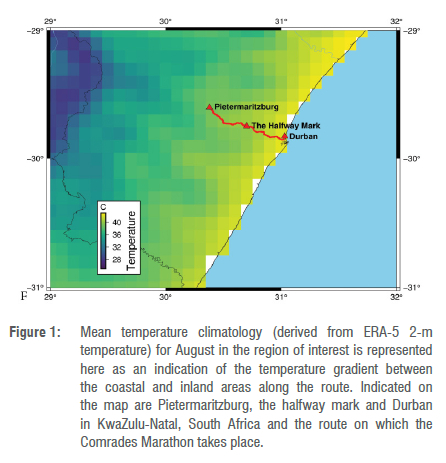
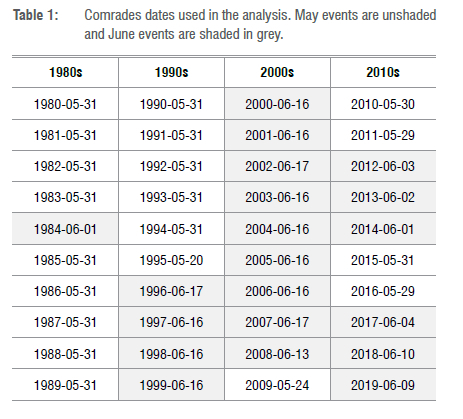
The Comrades Marathon takes place in KwaZulu-Natal, South Africa, between Pietermaritzburg and Durban. The event alternates annually between the 'up run' (Durban to Pietermaritzburg) and 'down run' (Pietermaritzburg to Durban). The starting point of the event within the respective cities has varied over the past 100 years, creating some differences in the final distance. However, the distance has consistently remained between 87 km and 91 km (see Figure 1 for the region of interest and route map, as well as the mean temperature climatology for August in the region). We examined the climate of Comrades Marathon events between 1980 and 2019 (as seen in Table 1). All events before 1980 were omitted from the analysis to match the temporal range of the ERA5 (the fifth-generation reanalysis global atmosphere data set from the European Centre for Medium-Range Weather Forecasts (ECMWF)).13 The last Comrades was completed in 2019 before COVID-19 restrictions led to the event's cancellation in 2020 and 2021.
ERA5 reanalysis data from the ECMWF was used to perform the climate analysis. A nearest-neighbour extraction was used to gather the historical climate at three points, namely: Pietermaritzburg (-29.6019, 30.3794), Durban (-29.8277, 31.0305) and the halfway mark (-29.7494, 30.7022). The new generation ERA5 reanalysis data has a resolution of 0.25° x 0.25° and a single grid cell is effectively ~30 km. Along the 90-km route, these points served as good reference points to ascertain the weather conditions experienced. The UTCI was derived from the ERA5 data set, calculated as a function of 2-m air temperature, 2-m dew point temperature (or relative humidity), wind speed at 10 m above ground level and mean radiant temperature. The UTCI was originally developed to indicate the possible physiological responses that humans will experience because of a combination of climatological factors14-17: air temperature (°C), wind speed (m/s), mean radiant temperature (°C) and humidity ratio (0-100). The UTCI values, together with the predicted associated physiological responses that athletes may experience, are detailed in Table 2.
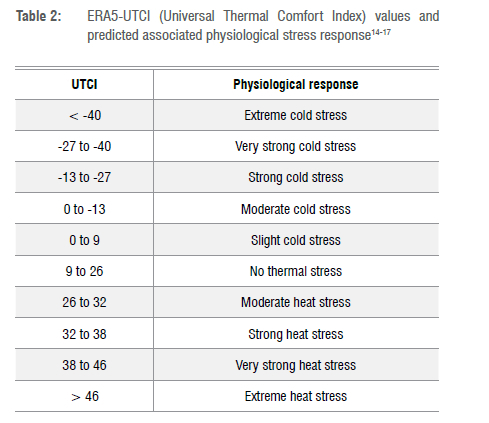
The UTCI values together with the predicted associated physiological responses were used to examine the possible risk for exertional heat illness, and particular focus was placed on 'strong' heat stress and 'very strong' heat stress periods along the three reference points. A timeseries analysis revealed the risk for the occurrence of heat stress for different daily times and event dates. Subsequently, the analysis revealed the relative frequency (%) of 'strong' and 'very strong' heat stress values per month as indicated by the UTCI values >32.
Results and discussion
The purpose of this study was to conduct an UTCI climatological analysis over the 1980-2021 period for the months of May, June, July and August, to examine the suitability of the new race date for the 2022 Comrades Marathon. Historically, the event was hosted in late May until 1996 when the event was moved to mid-June (Table 1). Due to the route's length, the UTCI was determined at three reference points (i.e. Durban, 'the halfway mark' and Pietermaritzburg) for separate analysis. Runners are prevented from competing further if they reach the halfway mark later than 11:45:00 (SAST). The grid cell at the halfway mark can also be used as a proximity location for the ~30-km radius along the route from this point, where the majority of runners who compete over 9 hours would be exposed to maximum midday heat stress conditions.
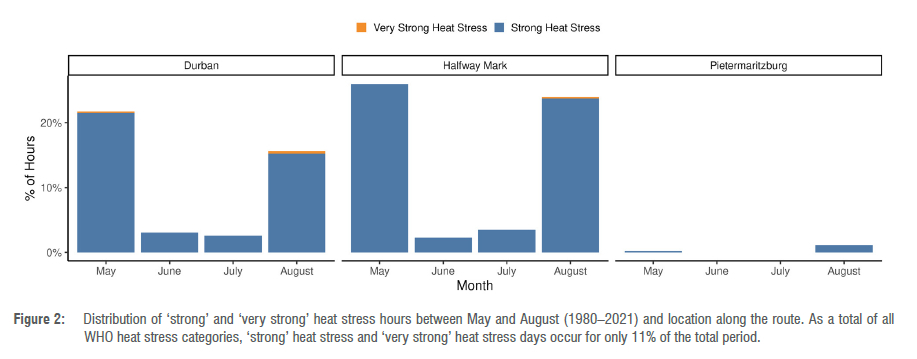
The climatology of the start and finish locations varied noticeably due to the coastal climatology of Durban and the inland climatology of Pietermaritzburg (Figure 1). We explicitly focused on 'strong' (32-38 UTCI) and 'very strong' (38-46 UTCI) heat stress periods during the study period. Extreme values only occurred 11% of the time over the duration of the whole climatology period. However, exposure to these periods can have an impact on athletes' performance. When examining the occurrence of 'strong' and 'very strong' heat stress days, Figure 2 indicates that the highest percentage of days with UTCI of 32-38, relative to May, June, July and August, is observed at the halfway mark during May (25.95%), followed by August (23.7%). The next highest percentage for high UTCI values was observed for Durban during May (21.5%) and August (15.63%). The percentage of UTCI that reached values higher than 38 UTCI during June and July was low for all reference points, with percentages that varied between 0% and 3.49%. In addition, Pietermaritzburg was the reference point for which the lowest percentages of 'strong' heat stress periods were identified during all months. Values for this reference point were 0.20%, 0%, 0% and 1.14% for May, June, July and August, respectively. The only reference points and periods for which 'very strong' heat stress periods (i.e. UTCI of 38-46) were observed, are Durban during May (0.23%) and August (0.39%) as well as at the halfway mark during August (0.20%).
The UTCI climatological data suggest that June and July are the months during which the periods of 'strong' and 'very strong' heat stress are fewer compared to both May and August. In addition, Pietermaritzburg served as the reference point with much lower percentages of 'strong' and 'very strong' heat stress periods compared to Durban and the halfway mark. From late July to August there is a noticeable increase in the frequency of heat stress days. The last 10 days of August also seem to produce higher occurrences of 'very strong' heat stress periods at Durban and the halfway mark (Figure 3) compared to the other days. Although May and August seemingly have similar 'strong' and 'very strong' heat stress days (Figure 2), historically, races have always been held during late May, when temperatures are cooling down (Figure 3). In contrast, the new proposed date is at the end of August when there is a significant increase in the occurrence of heat stress periods. A comparison by means of a f-test between the heat exposure risk of the last 10 days of May and the last 10 days of August indicated a statistically significant difference (p<0.01) between the two periods, with late August having a higher occurrence of 'strong' and 'very strong' heat stress periods compared to late May. A further comparison between the long-term climatology data of two 20-year periods, shows a 17% and 0.5% increase in 'strong' and 'very strong' heat stress days, respectively, from the 1980-2000 period to the 2001-2021 period. The largest increase in 'strong' heat stress days was observed at the halfway mark (11% increase), followed by Durban (5%) and Pietermaritzburg (1%).
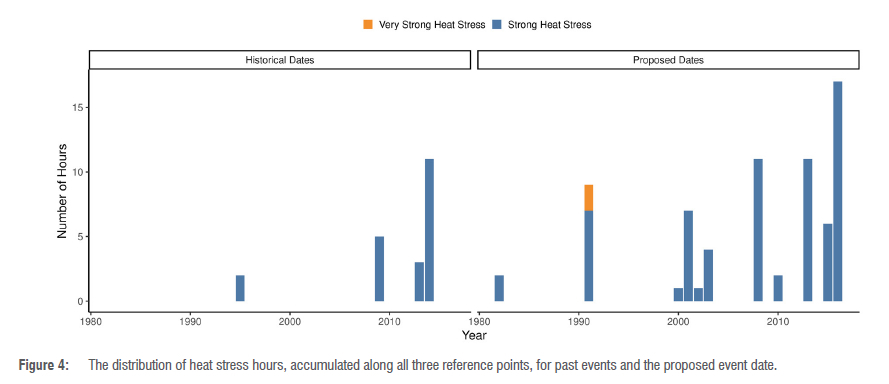
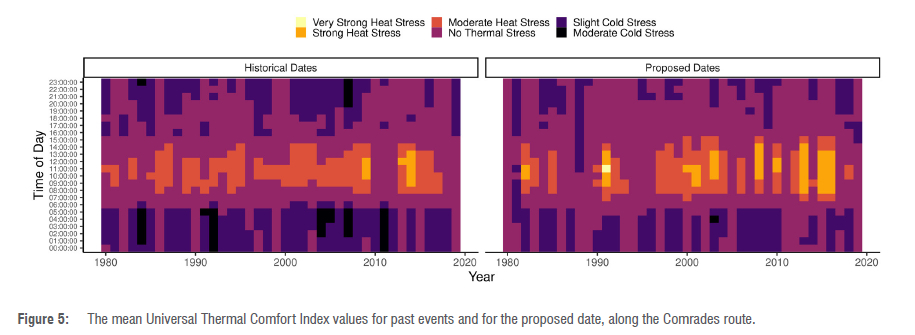
Figure 4 indicates the historical year-on-year increase in 'strong' and 'very strong' heat stress conditions during the period of interest, likely as a result of anthropogenic climate change, in line with projections for the region.18,19 Between 2010 and 2019, 4 years had periods of heat stress on 28 August, compared to 2 years for the same period during the events before 2010. Although 'strong' and 'very strong' heat stress periods occur less frequently than 'moderate heat stress' periods (Figure 5), the impact of these 'extreme periods' to the health and performance of runners increases substantially during exposure to values above 28. According to Hollander et al.12, the risk of heat-related illness doubles for endurance athletes when the UTCI increases from <25 to >35. Even a short exposure to these conditions should be avoided to minimise the risk of heat-related illness. These heat stress periods are especially prevalent at the reference points of Durban and the halfway mark, and between 12:00 and 14:00, as 69% of 'strong' heat stress periods and 80% of 'very strong' heat stress periods were observed during this period. Historically, the maximum heat stress period is observed at 13:00, and for the proposed date at 14:00.
In 2003, the race cut-off was extended by an hour from 11 to 12 hours. An analysis of Comrades results from 2003 to 2019 indicates that 78% of runners are on the route longer than 9 hours. Under severe conditions, runners who compete for more than 9 hours can be exposed to >5 hours of heat stress conditions. Researchers and medical-related professionals caught a glimpse of the possible consequences of 'stronger' heat stress periods during the 2013 Comrades Marathon event when only 55% of starters finished the race. Organisers described the weather conditions of this event as 'very hot with a hot gusting wind the entire day'2. Recent studies on participants of the 2019 World Athletics Championship held in Doha, Qatar and the 2018 London Marathon indicated that endurance athletes experienced a 20% increase in the risk of heat-related illness when exposed to high UTCI values.11,20 Participants in these studies also experienced up to a 5% decrease in running performance for every 5 points increase in UTCI values above 22.
Conclusion
We explored the risk of heat exposure for participants of the 2022 Comrades Marathon by analysing the UTCI climatological data of the actual event days and the proposed new race date of 28 August. In conclusion, the findings show that runners will face an increased risk of heat exposure if the event is held in August compared to June or July. The UTCI climatological data, together with the predicted associated physiological responses that athletes may experience, show that a higher frequency of heat stress periods is likely to occur in the first half of May and the second half of August. Mid-June to mid-July is the period during which the risk of exposure to heat stress during participation is the lowest. Runners should be aware of the higher risk of exertional heat illness due to the possible exposure to higher UTCI values or more unfavourable climatological conditions. Furthermore, runners should be made aware of a variety of preventative strategies which may include altered pacing, rehydration, and cooling strategies to ensure safe participation.20 Adherence to safety recommendations will ensure that more participants successfully finish the race, that the incidence rate of heat-related illness is reduced and that better Comrades Marathon running times are achieved.
Microclimatic conditions along the route and increased radiant heat from paved roads were not considered in the analysis of the UTCI climatological data and require further investigation. Therefore, the UTCI values could probably be underestimated as the microclimatic conditions may vary along the route. Furthermore, individual tolerance to heat stress varies, which may influence the individual responses and the possible risk for heat-related illness.8,20 However, we made use of a bioclimatic and not a physiological approach21 to investigate the possible risk for heat-related illness. These risks will likely increase as temperature increases under future climate change scenarios.18,19
Acknowledgements
The results contain the modified Copernicus Climate Change Service Information of 2021. Neither the European Commission nor ECMWF is responsible for any conjectures that were made due to analyses of the Copernicus information or data it contains.
Competing interests
We have no competing interests to declare.
Authors' contributions
H.H.: Conceptualisation, data collection, data analysis, data curation, writing - the initial draft. B.C., R.PB.: Conceptualisation, data analysis, methodology, writing - the initial draft, validation. S.J.P: Conceptualisation, methodology, writing - the initial draft, validation.
References
1. Knechtle B, Nikolaidis PT. The age of the best ultramarathon performance -the case of the 'Comrades Marathon'. Res Sports Med. 2017;25(2):132-143. https://doi.org/10.1080/15438627.2017.1282357 [ Links ]
2. Comrades Marathon Association. Comrades history. No date [cited 2022 Jan 10]. Available from: https://www.comrades.com/history/ [ Links ]
3. Malepa T. Comrades Marathon centennial race scheduled for late August next year. Sowetan Times. 2021 September 30 [cited 2022 Jan 10]. Available from: https://tinyurl.com/2p8zk335 [ Links ]
4. Thorsson S, Rayner D, Palm G, Lindberg F, Carlström E, Börjesson M, et al. Is physiological equivalent temperature (PET) a superior screening tool for heat stress risk than wet-bulb globe temperature (WBGT) index? Eight years of data from the Gothenburg half marathon. Brit J Sports Med. 2021;55(15):825-830. http://dx.doi.org/10.1136/bjsports-2019-100632 [ Links ]
5. Byrne C, Lee JK, Chew SA, Lim CL, Tan EY Continuous thermoregulatory responses to mass-participation distance runningin heat. Med Sci Sports Exerc. 2006;38(5):803. https://doi.org/10.1249/01.mss.0000218134.74238.6a [ Links ]
6. Gasparetto T, Nesseler C. Diverse effects of thermal conditions on performance of marathon runners. Front Psychol. 2020;11:1438. https://doi.org/10.3389/fpsyg.2020.01438 [ Links ]
7. Armstrong LE, Casa DJ, Millard-Stafford M, Moran DS, Pyne SW, Roberts WO. American College of Sports Medicine position stand. Exertional heat illness during training and competition. Med Sci Sports Exerc. 2007;39(3):556-572. https://doi.org/10.1249/mss.0b013e31802fa199 [ Links ]
8. Periard JD, Eijsvogels TM, Daanen HA. Exercise under heat stress: thermoregulation, hydration, performance implications and mitigation strategies. Physiol Rev. 2021;101(4):1873-1979. https://doi.org/10.1152/physrev.00038.2020 [ Links ]
9. Vanos JK, Kosaka E, lida A, Yokohari M, Middel A, Scott-Fleming I, et al. Planning for spectator thermal comfort and health in the face of extreme heat: The Tokyo 2020 Olympic marathons. Sci Tot Environ. 2019;657:904-917. https://doi.org/10.1016/j.scitotenv.2018.11.447 [ Links ]
10. Brocherie F, Millet GP. Is the wet-bulb globe temperature (WBGT) index relevant for exercise in the heat? Sports Med. 2015;45(11):1619-1621. https://doi.org/10.1007/s40279-015-0386-8 [ Links ]
11. Honjo T, Seo Y Yamasaki Y Tsunematsu N, Yokoyama H, Yamato H, et al. Thermal comfort along the marathon course of the 2020 Tokyo Olympics. Int J Biometeorol. 2018;62(8):1407-1419. https://doi.org/10.1007/s00484-018-1539-x [ Links ]
12. Hollander K, Klöwer M, Richardson A, Navarro L, Racinais S, Scheer V et al. Apparent temperature and heat-related illnesses during international athletic championships: A prospective cohort study. Scand J Med Sci Sports. 2021;31(11):2092-2102. https://doi.org/10.1111/sms.14029 [ Links ]
13. Hersbach H, Bell B, Berrisford P Biavati G, Horányi A, Munoz Sabater J, et al. ERA5 hourly data on single levels from 1979 to present [data set]. Copernicus Climate Change Service (C3S) Climate Data Store (CDS). 2018;10. https://doi.org/10.24381/cds.adbb2d47 [ Links ]
14. Zare S, Hasheminejad N, Shirvan HE, Hemmatjo R, Sarebanzadeh K, Ahmadi S. Comparing Universal Thermal Climate Index (UTCI) with selected thermal indices/environmental parameters during 12 months of the year. Weather Clim Extremes. 2018;19:49-57. https://doi.org/10.1016/j.wace.2018.01.004 [ Links ]
15. Zare S, Shirvan HE, Hemmatjo R, Nadri F, Jahani Y, Jamshidzadeh K, et al. A comparison of the correlation between heat stress indices (UTCI, WBGT, WBDT, TSI) and physiological parameters of workers in Iran. Weather Clim Extremes. 2019;26:100213. https://doi.org/10.1016/j.wace.2019.100213 [ Links ]
16. Di Napoli C, Barnard C, Prudhomme C, Cloke HL, Pappenberger F. ERA5 -HEAT: A global gridded historical dataset of human thermal comfort indices from climate reanalysis. Geosci Data J. 2021;8(1):2-10. https://doi.org/10.24381/cds.553b7518 [ Links ]
17. Di Napoli C, Pappenberger F, Cloke HL. Assessing heat-related health risk in Europe via the Universal Thermal Climate Index (UTCI). Int J Biometeorol. 2018;62(7):1155-1165. https://doi.org/10.1007/s00484-018-1518-2 [ Links ]
18. Almazroui M, Saeed F, Saeed S, Islam MN, Ismail M, Klutse NA, et al. Projected change in temperature and precipitation over Africa from CMIP6. Earth Syst Environ. 2020;4(3):455-475. https://doi.org/10.1007/s41748-020-00161-x [ Links ]
19. Mbokodo I, Bopape MJ, Chikoore H, Engelbrecht F, Nethengwe N. Heatwaves in the future warmer climate of South Africa. Atmosphere. 2020;11(7), Art. #712. https://doi.org/10.3390/atmos11070712 [ Links ]
20. Vernon T, Ruddock A, Gregory M. Performance and thermal perceptions of runners competing in the London Marathon: Impact of environmental conditions. Int J Environ Res Public Health. 2021;18(16), Art. #8424. https://doi.org/10.3390/ijerph18168424 [ Links ]
21. Grundstein A, Vanos J. There is no 'Swiss Army Knife' of thermal indices: The importance of considering 'why?' and 'for whom?' when modelling heat stress in sport. Brit J Sports Med. 2021;55(15):822-824. http://dx.doi.org/10.1136/bjsports-2020-102920 [ Links ]
 Correspondence:
Henno Havenga
Email: 22743529@g.nwu.ac.za
Received: 24 Jan. 2022
Revised: 25 Apr. 2022
Accepted: 26 Apr. 2022
Published: 28 July 2022
EDITOR: Pascal Bessong
FUNDING: None

