


Services on Demand
Article
 English (pdf)
 Article in xml format
 Article references
Indicators

Related links
-
 Cited by Google
 -
 Similars in Google
Share

 Permalink
South African Journal of Science
On-line version ISSN 1996-7489
Print version ISSN 0038-2353
S. Afr. j. sci. vol.118 n.5-6 Pretoria May./Jun. 2022
http://dx.doi.org/10.17159/sajs.2022/13300
RESEARCH ARTICLE
COVID-19 and all-cause mortality in South Africa - the hidden deaths in the first four waves
Debbie BradshawI, II; Rob DorringtonIII; Ria LaubscherIV; Pamela GroenewaldI; Tom MoultrieIII
IBurden of Disease Research Unit, South African Medical Research Council, Cape Town, South Africa
IISchool of Public Health and Family Medicine, University of Cape Town, Cape Town, South Africa
IIICentre for Actuarial Research, Faculty of Commerce, University of Cape Town, Cape Town, South Africa
IVBiostatistics Unit, South African Medical Research Council, Cape Town, South Africa
ABSTRACT
Accurate statistics are essential for policy guidance and decisions. However, the reported number of cases and COVID-19 deaths are known to be biased due to under-ascertainment of SARS-CoV-2 and incomplete reporting of deaths. Making use of death data from the National Population Register has made it possible to track in near-real time the number of excess deaths experienced in South Africa. These data reveal considerable provincial differences in the impact of COVID-19, likely associated with differences in population age structure and density, patterns of social mixing, and differences in the prevalence of known comorbidities such as diabetes, hypertension, and obesity. As the waves unfolded, levels of natural immunity together with vaccination began to reduce levels of mortality. Mortality rates during the second (Beta) wave were much higher than mortality in the third (Delta) wave, which were higher than in either the first or the fourth (Omicron) waves. However, the cumulative death toll during the second (Beta) wave was of a similar order of magnitude as that during the third (Delta) wave due to the longer duration of the Delta wave. Near-real time monitoring of all-cause deaths should be refined to provide more granular-level information to enable district-level policy support. In the meanwhile, there is an urgent need to re-engineer the civil registration and vital statistics system to enable more timely access to cause of death information for public health actions.
SIGNIFICANCE:
This study highlights that in South Africa there were about three times the number of excess deaths from natural causes during 2020 and 2021 than reported COVID-19 deaths. Although the cause of death remains unknown, the strong temporal correlation between excess deaths and reported COVID-19 deaths within each province indicates that the majority of excess deaths were associated with COVID-19. Many countries have found it difficult to estimate excess deaths, or to identify and report COVID-19 deaths accurately, demonstrating the value of near-real time monitoring of mortality through the use and demographic analysis of data obtained from the country's National Population Register.
Keywords: COVID-19 deaths, excess deaths, South Africa
Introduction
The South African Department of Health reports the number of cases and the number of COVID-19 deaths on a daily basis (https://sacoronavirus.co.za/) as does the World Health Organization (https://covid19.who.int) for member states, based on data submitted by member states. However, these numbers are known to be biased due to the backlog in reporting of cause-of-death data in South Africa, acknowledged under-ascertainment of SARS-CoV-2 and, in the case of deaths, a significant incompleteness of reporting.
In January 2022, Adam1 wrote that 'official data report some five million COVID-19 deaths in two years, but global excess deaths are estimated at double or even quadruple that figure'. While the excess deaths in a handful of countries correspond with their number of reported COVID-19 deaths, many countries either do not track/report the number of excess deaths or understate the number of COVID-19 deaths or both. Data on excess deaths are consolidated in the World Mortality Dataset2 and have been used, together with other data, to estimate excess deaths by The Economist3, while others, such as the Institute for Health Metrics Evaluation, have developed complex projection models to estimate the total number of COVID-19 deaths4. In addition, the World Health Organization is working on estimating the number of excess deaths in consultation with each country but has yet to release country-level estimates.5
South Africa is in a unique position in sub-Saharan Africa in being able to make use of its National Population Register (NPR), after correction for deaths not recorded, to establish a near-real time monitoring system of deaths in the country.6 This ability has been invaluable for tracking excess deaths during the pandemic and weekly reports of numbers of deaths have been made available routinely since March 2020.7
Analysis of the numbers of deaths in 2020 originally suggested that overall mortality was 13% higher than the number predicted before the impact of the pandemic.8 However, as was identified by this analysis, there was a need to improve the adjustment for under-reporting, and this increased this proportion for South Africa in 2020 to 19%. It was estimated that there were 70 000-76 000 excess deaths from natural causes, well above the 28 000 reported COVID-19 deaths. In light of the extremely strong spatio-temporal correlation with the timing of SARS-CoV-2 infection, it was concluded that 85-95% of the excess natural deaths were related to COVID-19.9 During 2020, deaths from unnatural causes halved for both male and female individuals during the stringent lockdown level 5 and it was estimated that just under 5000 unnatural deaths were averted. Most of this drop in deaths from unnatural causes was due to the periodic banning of the sale of alcohol.10
In this paper, we set out to identify further characteristics of the excess natural deaths in South Africa, which remains critically important as the cause-of-death data from death notifications that occurred during the COVID-19 pandemic are unlikely to be available for analysis within the next 2 to 3 years without an increase in resources to process the forms.
Methods
Data source
The use of, and adjustments made to, the data from the NPR to produce estimates of mortality in South Africa have been described elsewhere6,8,11 and are not repeated in detail here. In short, we receive a weekly extract of deaths recorded on the NPR providing the age, sex, dates of birth and death, whether the death was due to natural or unnatural causes, and the office of the Department of Home Affairs (DHA) at which the death was notified. (It is important to note, and is a limitation of the data, that we receive no real-time cause of death information beyond the categorisation of the cause of death as natural or unnatural). The data are checked for duplicates and then updated in a database maintained by the South African Medical Research Council (SAMRC).
Although the NPR does not record deaths of those without South African national identity numbers, it is still reasonably complete (nearly 90% for adults, and around 42% for children under the age of 5).6 Two adjustments are made to the NPR data for completeness of registration: an adjustment in respect of completeness derived from the application of indirect demographic techniques to past census data; and an adjustment in respect of those without South African identity numbers, based on the official vital statistics data compiled by Statistics South Africa.12 The methods for the adjustments are described in more detail in the Supplementary material, but suffice it to say that because the adjustments made for under-reporting of deaths are made to both the estimate of the true numbers of and the predicted numbers of deaths, the extent of error on the estimates of excess deaths (the differences between these two estimates) is limited.
The data are processed by epidemiological week ('epi-week') beginning on a Sunday and ending on the following Saturday. However, as the data extract from the NPR is compiled on a Monday, there are deaths that may have occurred in the immediately preceding epi-week that have yet to be reported to, or processed by, the Department of Home Affairs. In order for the data to be as up to date as possible, an adjustment (about 20% for natural deaths and 50% for unnatural deaths for weeks without public holidays or significant office closures) is made to the numbers of deaths in the most recent week, as outlined in the Supplementary material. Here we report on data processed on 7 February 2022.13
Excess deaths
Excess deaths are determined by, first, establishing a counterfactual estimate of the number of weekly deaths (by age, sex, province (and metropolitan districts, separately), as well as natural and unnatural causes) using a negative binomial regression model to project the numbers of deaths (adjusted for incompleteness of reporting of deaths). The model, which is described in detail elsewhere11, uses estimates of population size from the Thembisa 4.2 model14 as an 'offset' term. The log mortality rates were modelled as:

where dij. is the count of deaths and PWii is the exposure (measured in person-weeks) for a particular age group i and combination of covariates
Second, we estimate the true number of the deaths (adjusted for those not registered and those of persons without South African identity numbers) by 'epi-week' of death, and deduct from these numbers, the counterfactual estimates by 'epi-week' to derive the number of excess deaths. Natural and unnatural deaths were modelled separately in an attempt to isolate the impact of SARS-CoV-2 on health/illness from the impacts of lockdown on unnatural causes of death given the high (by international standards, even in low- and middle-income countries) injury death rates in South Africa.15,16
The impact of the complete cessation of birth registration during the initial lockdown level 5 in 2020 on the registration of deaths under the age of 1 year was so substantial that the weekly monitoring of the impact of the pandemic was initially restricted to those aged 1 year and older. In addition, the temporary closure of Department of Home Affairs facilities in hospitals, and possibly some reluctance by parents to register births during the early stages of the pandemic may also have reduced birth registration and thereby the numbers of deaths under the age of 1 year captured on the NPR beyond the stringent lockdown period. Based on a comparison of the NPR numbers of child deaths with data from the District Health Information System, it appeared that infant death registration resumed to usual levels by the end of May 2020 and weekly monitoring was revised to cover deaths at all ages.17 To do this we assumed that, because the numbers of infant deaths before and after the hiatus in birth registration were below the expected number, there were no excess infant deaths during the hiatus.
An alternative measure of the extent of excess mortality is the p-score, which tracks the excess relative to the number predicted using the relevant binomial model. Age-standardised per capita rates were calculated using indirect standardisation to the South African national population age structure projected by the Thembisa model version 4.214 by calculating area comparability factors (the ratio of the national per capita rate to that expected for the province if it had experienced the national age-specific rates) for each province. In addition, rates during the waves and calendar years were annualised (equivalent to 52/53 weeks) to allow for the fact that the waves last for differing numbers of weeks.
Definition of waves of deaths and correlation with reported deaths
The temporal correlations between excess deaths and reported COVID-19 deaths were investigated using the Pearson correlation coefficient (R) to indicate the direction of the association and the square of the coefficient (R2) to provide an indication of the amount of variability in the excess deaths that is explained by the variability in reported COVID-19 deaths. The correlation analyses are based on the reported number of COVID-19 deaths using the date of occurrence (rather than reporting) of each death.
Although there are various suggestions18,19 as to how the start and end of waves of the pandemic should be determined, these are most usually expressed in terms of the number of cases or the percentage of those who tested positive. Leaving aside issues about the accuracy of measures based on testing data, these various suggestions frequently assume that there are non-wave periods between the waves (even though there may still be people testing positive and people dying of COVID-19). This is not ideal for comparing waves of deaths, which lag the number of cases and tend to drag on after peaking, because assuming that the timing of the waves of deaths is simply that of the cases lagged by an average time from infection to death, is likely to misrepresent the wave of deaths as assuming all patients with COVID-19 have an average survival will overestimate the lag at the start of the wave and underestimate it at the end of the wave.
For these reasons we determined the starting epi-week of the waves of deaths (except the first) using COVID-19 deaths in health facilities19 by date of death captured on the DATCOV platform on the assumption that, although these certainly do not represent all COVID-19 deaths, they reflect the timing of the waves of deaths reasonably well. Given the high correlation between the DATCOV and excess death data series there are few, if any, grounds to believe that those who die outside of health facilities die at substantially different time points in a wave than those who die within health facilities. The start-week of the first wave of excess deaths was assumed to be the week these were first apparent in the weekly excess death reports of the SAMRC/University of Cape Town. After that, the start-week of each subsequent wave was assumed to be the week after the week in which the reported hospital deaths reached a local minimum. In order to minimise distortion due to random fluctuation, a central moving average (over 3 weeks for the national and 5 weeks for the provincial) was used instead of the actual weekly number of deaths.
The protocol for the maintenance of the Rapid Mortality Surveillance (RMS) database to monitor COVID-19 mortality was approved by the SAMRC Ethics Committee (EC038-9/2020). Although this database includes individual identity numbers, it does not have names or other identification fields and data security measures have been put in place to minimise the risk of unauthorised access to the records.
Results
Excess deaths
Figure 1 shows the estimated weekly numbers of (a) natural and (b) unnatural deaths in comparison with the counterfactual (predicted numbers in the absence of the pandemic) and upper and lower prediction bounds.


A few observations can be made from these figures. First, the aggregate excess mortality between 3 May 2020 and end January 2022 was high, with a total of nearly 296 000 excess natural deaths. Second, except for the initial lockdown at level 5 (numbered 1) the tightening of lockdowns was either too late (4, 7 and possibly 11) or not particularly effective in limiting the numbers of natural deaths. Finally, as has been pointed out by Moultrie et al.10, the alcohol bans (e.g. at points 1, 7, 10 and 11 in Figure 1b) clearly reduce the number of unnatural deaths. What appears to be an exception in the week starting at 12, is a spike in unnatural deaths due to the riots in KwaZulu-Natal and Gauteng, which according to these estimates might have accounted for around 550 unnatural deaths.
Comparison of reported COVID-19 deaths and excess deaths
Figure 2 shows the weekly number of excess natural deaths and the number of COVID-19 deaths reported by the National Department of Health (https://sacoronavirus.co.za/). While there is a correspondence between the numbers, the excess deaths were much higher than the reported deaths.

Table 1 compares the number of excess deaths due to natural causes to the number of reported COVID-19 deaths up to and including the last week in January 2022, and includes the square of the correlation coefficients (all of which were positive) of these numbers over time (with the reported numbers allocated to their week of death rather than the week of reporting) to the end of 2021 (to avoid the measure being distorted by missing late reporting of COVID-19 deaths).
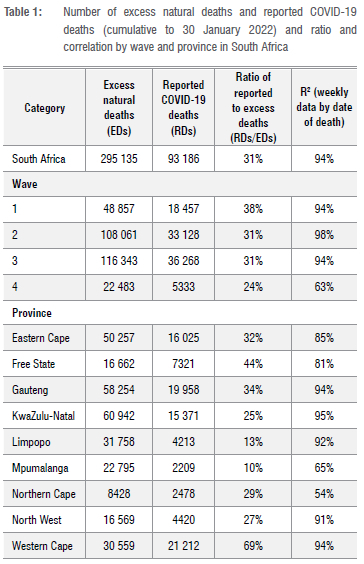
From this we see that reported COVID-19 deaths account for around one third of the excess natural deaths, and possibly less than this in the fourth wave, although much of this difference is probably due to delays in the official reporting of deaths. Further, the percentage of excess deaths that are recorded as COVID-19 deaths is highest in the Western Cape (69%) and next, by some distance, in the Free State (44%). Most of the other provinces report percentages of excess deaths from COVID-19 of between 25% and 35%, while reporting of deaths in Limpopo and Mpumalanga is particularly poor. In addition, the correlation of the timing of the deaths is very high (ff2>90%) for the country as a whole and for five of the provinces, moderately high for the Eastern Cape and Free State (at 80-89%), but low for Mpumalanga and particularly for the Northern Cape. Finally, the ratio of reported COVID-19 deaths to excess deaths during the first three waves was similar to the national (31-38%) but much lower in the fourth wave 4 (24%). Similarly, temporal correlation was high during the first three waves (94-98%) but much lower in the fourth wave (63%).
Table 2 shows the cumulative (until the end of January 2022) excess death rates per 100 000 population. In addition, it shows annualised excess death rates to afford comparison of waves with differing durations and for each calendar year. Finally, age-standardised excess death rates per 100 000 population for the provinces are included to allow for the effect of some provinces having older populations than other provinces.

These results show that, standardised by size and age distribution of the population, the cumulative excess death rate is lowest for the Western Cape, followed by Gauteng, and highest for the Northern Cape, Eastern Cape and then KwaZulu-Natal. In terms of waves, the second wave had the highest annualised excess death rate, followed by the third wave. The excess death rate in 2021 was significantly higher than that in 2020, particularly for the North West and Northern Cape. The fourth wave was of a similar magnitude to the first wave. Finally, annualised rates were particularly high in the Northern Cape's third wave, KwaZulu-Natal's second wave, and, to a lesser extent, the Eastern Cape's second wave.
Who, where and when?
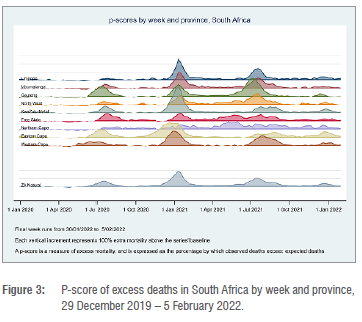
The COVID-19 pandemic has affected provinces differently, both in regard to timing and to the impact on mortality. This difference is clearly demonstrated in Figure 3, which shows the p-score by epi-week for each province. The differential impact of each of the four waves is evident, with the extra mortality arising during the fourth wave being the mildest.
From Figure 4, which shows the p-score by epi-week by age group, the consistent impact of the pandemic is apparent for the age groups 40 years and above. The impact is particularly marked for age groups 60 years and above. Fluctuations in younger age groups are more erratic and in the case of children 0-4 years, it is clear that during much of 2020, deaths were averted. In 2021, the numbers of deaths of children 0-4 years have tended to be higher than expected but generally have not breached the upper prediction bound for this age group (exceeded the upper prediction bound in only 4 weeks out of 52).

Figure 5 shows age-specific annualised excess death rates per 1000 population (a) for the four waves (male and female individuals combined) and (b) for male and female individuals over all four waves combined. From Figure 5a, we see that rates were highest for the second wave and lowest for the first and fourth waves (which are very similar) with the third wave being in between (slightly higher than the first and fourth waves). From Figure 5b, we see the distinct age pattern for COVID-19 mortality, with a rapid increase in mortality rates with age for both sexes. Although the rates are higher for male than for female individuals aged 60 years and above, they are, in fact, lower at most age groups under 60 years, with the male rate for all ages combined being about 75% of that of the rate for females of all ages (consistent with the ratio found for 20208) because there are many more female than male individuals of older ages.


Discussion
Assuming that a large proportion of the excess deaths in each province are due to COVID-19, the results presented here (particularly, the high correlation between, and ratios of, the reported number of COVID-19 deaths and excess death for each province) show that the official reporting of COVID-19 deaths varies dramatically between provinces. While the pattern of officially reported COVID-19 deaths in the Western Cape - in particular - has closely mirrored that of the excess deaths, in absolute terms, the discrepancy between the totals is still substantial. In other provinces - particularly Limpopo and Mpumalanga - it is evident that provincial data systems have not been able to identify a very high proportion of deaths that were almost certainly due to COVID-19. Further, it appears that the quality of official reporting of COVID-19 deaths may be worsening over time.
This speaks to the importance of complete and timely official data systems, at both national and provincial levels, and offers some insight into the potential burden of COVID-19 deaths in countries with very limited or non-existent health data systems. It is not beyond the realm of possibility that many other countries in sub-Saharan Africa might have experienced the same health data system challenges that are so evident in some South African provinces.
The results here provide further insight into the timing, duration, and spread of different waves of infection in different provinces. Some of these differences are attributable to the geographic spread of infections, but these are then amplified (and perhaps confounded) by the differences in population age distribution and density, patterns of social mixing, and provincial differences in the prevalence of known comorbidities such as diabetes, hypertension, and obesity.20
Second, there are differences in the levels of excess mortality associated with each wave. Based on our results, mortality in the second (Beta) wave was much higher than mortality in the third wave, which was higher than in either the first or the fourth waves. The analysis and explanation of these dynamics is a matter for further research, but no doubt reflects a combination of virulence and severity of the variant, the level of natural immunity arising from past infection, as well as (certainly in the fourth wave) the role of mass vaccination against SARS-CoV-2.
Third, despite considerable provincial variations, the timing of various interventions escalating the disaster lockdown levels under the national regulations was applied almost exclusively at a national level (the only exception being the imposition of restrictions in certain districts towards the beginning of the second wave), and were largely ill-timed relative to the timing of the excess deaths. National restrictions on the sale and/or on-site consumption of alcohol had a considerable impact on unnatural deaths, but little if any impact on deaths due to natural causes. However, the period of 'hard lockdown' from March to May 2020 did have a marked effect on natural deaths, particularly among young children. Between 25 March 2020 and 17 August 2020, a tobacco sales ban was implemented in South Africa as part of the COVID-19 lockdown, based on concerns about increased transmission and severity of COVID-19 infection and disease. Although it was not clear at the time, there is strong evidence that the risk of severe illness and mortality due to COVlD-19 is significantly higher for ever-smokers compared with never-smokers21,22 but evidence for increased risk of COVID-19 infection in smokers is unconvincing22. While tobacco endgame-strategies ultimately include a tobacco sales ban, demand-side preconditions are required for this to be successful (namely, low smoking prevalence <10% and smoking cessation support).23 Filby et al.24 argue that South Africa did not meet these preconditions at the time of introducing the smoking ban. Whilst 9% of pre-lockdown smokers reported quitting due to the ban, 93% of continuing smokers purchased cigarettes through informal channels despite the ban. Given the differences in the timing of the surges experienced in the provinces, there is a need for provinces to have scope to implement interventions based on the situation in their particular province.
Fourth, the observation that male excess mortality has been consistently greater than female mortality at the older ages (60+ years) has been documented in South Africa8 and elsewhere25, but it appears that female excess mortality may be higher in some age groups below age 50 and the reasons for this requires further research. The ability to fully and completely identify known comorbidities among decedents, and to associate these with differential prevalence of these comorbidities by sex, may shed light on this matter.
Fifth, we caution that the full impact of the pandemic on excess mortality may take many years to be completely revealed. 'Long COVID' may contribute to mortality for some time, and the collateral deaths (in terms of missed diagnoses or treatment, for example) arising from lockdowns and the overburdening of the health system during the various waves remain unknown, making it important to continue monitoring its impact.26
Finally, while this paper offers detailed insight into the burden of mortality in South Africa arising during the COVID pandemic, there is almost no data from other African, developing, or low-to-middle-income countries against which to compare our results. Officially reported deaths from the disease in these settings are known to be extensively under-reported, and South Africa is but one of very few countries with the data and skills available to track excess mortality in near-to-real time. While we are unable to ascertain with certainty the proportion of excess deaths attributable to COVID-19 from the South African death data, the level of excess mortality strongly challenges the argument that Africa is somehow less affected by the pandemic than other regions of the world. Using data from Our World in Data (https://ourworldindata.org/), which uses our estimate of excess deaths from all causes (which is lower than excess deaths due to natural causes), South Africa has higher excess deaths per 100 000 population than Brazil, the UK, and the USA. Yet, given the comparatively youthful age profile of the South African population relative to these three countries, adjusting for age would make the comparison even more marked.
These results suggest that, in one of the few African countries capable of marshalling national death data, the impact of the pandemic measured through all-cause excess deaths has been anything but mild. However, South Africa is not a bellwether for Africa: its population is somewhat older than that of most African countries and has higher prevalence of co-morbidities, being relatively wealthier than most other African countries. In addition, South Africa has a very high HIV burden.
Study limitations
The counterfactual is based on data for the period 2014-2019, assuming that the trends in historical mortality rates and population numbers persist, and does not take into account other perturbations in the numbers of deaths. In addition, there is considerable uncertainty around what proportion of the excess deaths was due to COVID-19 (directly or indirectly) and the true range of uncertainty about the estimate of excess deaths.
Conclusion
This research raises important questions about the ability of most low-income and possibly some middle-income countries, particularly those in sub-Saharan Africa, to generate appropriate, accurate, timely, and reliable data to inform national responses to novel pandemics of the size and scale of COVID-19. That we know so much about the South African experience during the COVID-19 pandemic is because the country has a National Population Register, which is updated with fact of death data from a fairly complete civil registration and vital statistics (CRVS) system.
Tracking excess deaths from natural causes has revealed substantial and concerning discrepancies in the quality and utility of the country's disease surveillance data at a provincial level. Despite major data challenges, the near-real time system has provided strong and more reliable information about the true impact of COVID-19 on the South African population. However, there is little room for complacency. The time it takes to report on the causes of death currently suggests that the CRVS needs urgent re-engineering, including electronic death registration. Local-level surveillance in the Western Cape has demonstrated that with further training of medical personnel involved in the certification of death and with appropriate political and bureaucratic will, the quality and utility of these data can be improved immensely.27
Finally, the maintenance and enhancement of the only near-real time mortality surveillance system cannot be allowed to be deprioritised as the pandemic dissipates. The after-effects of COVID-19 are likely to affect population health for many years to come, and a near-real time mortality surveillance system should ideally be augmented, refined, and further developed in conjunction with CRVS to provide near-real time cause of death data to inform policy response to other communicable diseases, and in time to add to the evidence base about the burden of disease in South Africa.
Competing interests
We have no competing interests to declare.
Authors' contributions
Conceptualisation: All. Methodology: R.D., D.B., T.M., R.L. Data collection: R.L. Data analysis: R.D., R.L., D.B. Data curation: R.L. Writing - the initial draft: D.B., R.D., T.M. Writing - revisions: All. Funding acquisition: PG., D.B.
References
1. Adam D. The pandemic's true death toll: Millions more than official counts. Nature. 2022;601(7893):312-315. https://doi.org/10.1038/d41586-022-00104-8 [ Links ]
2. Karlinsky A, Kobak D. Tracking excess mortality across countries during the COVID-19 pandemic with the World Mortality Dataset. eLife 2021;10, e69336. https://doi.org/10.7554/eLife.69336 [ Links ]
3. The pandemic's true deaths toll. The Economist. c2020 [cited 2022 Feb 02]. Available from: https://www.economist.com/graphic-detail/coronavirus-excess-deaths-estimates [ Links ]
4. Institute for Health Metrics Evaluation. COVID-19 projections [webpage on the Internet]. c2022 [cited 2022 Feb 02]. Available from: https://covid19.healthdata.org/japan?view=cumulative-deaths&tab=trend [ Links ]
5. World Health Organization. The true death toll of COVID-19: Estimating global excess mortality [webpage on the Internet]. c2021 [cited 2022 Feb 02]. Available from: https://www.who.int/data/stories/the-true-death-toll-of-covid-19-estimating-global-excess-mortality [ Links ]
6. Dorrington RE, Moultrie TA, Laubscher R, Groenewald PJ, Bradshaw D. Rapid mortality surveillance using a national population register to monitor excess deaths during SARS-CoV-2 pandemic in South Africa. Genus. 2021;77(1):19. https://doi.org/10.1186/s41118-021-00134-6 [ Links ]
7. Bradshaw D, Laubscher R, Dorrington RE, Groenewald P Moultrie TA. Weekly deaths in South Africa 1 January - 15 March 2020. Cape Town: South African Medical Research Council; 2020. [ Links ]
8. Bradshaw D, Dorrington RE, Laubscher R, Moultrie TA, Groenewald P. Tracking mortality in near to real-time provides essential information about the impact of the COVID-19 pandemic in South Africa in 2020. S Afr Med J. 2021;111(8):732-740. https://doi.org/10.7196/SAMJ.2021.v111i8.15809 [ Links ]
9. Moultrie TA, Dorrington R, Laubscher R, Groenewald P, Bradshaw D. Correlation of excess natural deaths with other measures of the COVID-19 pandemic in South Africa [document on the Internet]. Cape Town: Burden of Disease Research Unit, South African Medical Research Council; 2021. Available from: https://www.samrc.ac.za/sites/default/files/files/2021-03-03/CorrelationExcessDeaths.pdf [ Links ]
10. Moultrie TA, Dorrington RE, Laubscher R, Groenewald P, Parry CDH, Matzopoulos R, et al. Unnatural deaths, alcohol bans and curfews: Evidence from a quasi-natural experiment during COVID-19. S Afr Med J. 2021;111(9):834-837. [ Links ]
11. Dorrington R, Bradshaw D, Laubscher R, Groenewald P, Moultrie TA. Methodological note: Predicted numbers of death by epi-week for South Africa in 2020 and 2021 [document on the Internet]. Cape Town: Burden of Disease Research Unit, South African Medical Research Council; 2021. Available from: https://www.samrc.ac.za/sites/default/files/files/2021-01-24/Methodological%20Note%20on%20Predicted%20Weekly%20Deaths%2020_Jan_2021.pdf [ Links ]
12. Statistics South Africa. Mortality and causes of death in South Africa, 2017: Findings from death notification. Statistical release P0309.3 Mortality 2017. Pretoria: Statistics South Africa; 2020. Available from: https://www.statssa.gov.za/publications/P03093/P030932017.pdf [ Links ]
13. Bradshaw D, Laubscher R, Dorrington R, Groenewald P, Moultrie TA. Report on weekly deaths in South Africa 1 January 2020 - 5 January 2021 (Week 53) [document on the Internet]. Cape Town: Burden of Disease Research Unit, South African Medical Research Council; 2020. Available from: https://www.samrc.ac.za/sites/default/files/files/2021-01-13/weekly5Jan2021.pdf [ Links ]
14. Johnson LF, Dorrington RE, Moolla H. HIV epidemic drivers in South Africa: A model-based evaluation of factors accounting for inter-provincial differences in HIV prevalence and incidence trends. South Afr J HIV Med. 2017;18(1):695. https://doi.org/10.4102/sajhivmed.v18i1.695 [ Links ]
15. Matzopoulos R, Prinsloo M, Bradshaw D, Pillay-van Wyk V, Gwebushe N, Mathews S, et al. The Injury Mortality Survey: A national study of injury mortality levels and causes in South Africa in 2009. Cape Town: South African Medical Research Council; 2012. [ Links ]
16. Matzopoulos R, Prinsloo M, Pillay-van Wyk V, Gwebushe N, Mathews S, Martin LJ, et al. Injury-related mortality in South Africa: A retrospective descriptive study of postmortem investigations. Bull World Health Organ. 2015;93(5):303-313. https://doi.org/10.2471/BLT.14.145771 [ Links ]
17. Bradshaw D, Laubscher R, Dorrington R, Groenewald P, Moultrie TA. Report on weekly deaths in South Africa 8 - 14 August 2021 (Week 32) [document on the Internet]. Cape Town: Burden of Disease Research Unit, South African Medical Research Council; 2021. Available from: https://www.samrc.ac.za/sites/default/files/files/2021-08-18/weekly14Aug2021.pdf [ Links ]
18. NICD-NHLS Centre for Respiratory Diseases and Meningitis. Proposed definition of COVID-19 wave in South Africa. Communicable Diseases Communique. 2021;20(11):3-4. Available from: https://www.nicd.ac.za/wp-content/uploads/2021/11/Proposed-definition-of-COVID-19-wave-in-South-Africa.pdf [ Links ]
19. South African COVID-19 Modelling Consortium. COVID-19 modelling update: Considerations for the third wave, including the impact of the Delta variant of concern. Johannesburg: National Institute for Communicable Diseases; 2021. Available from: https://www.nicd.ac.za/wp-content/uploads/2021/07/SACMC-Third-wave-report-inlcuding-Delta-variant.pdf [ Links ]
20. National Department of Health, Statistics South Africa, South African Medical Research Council and ICF. South Africa Demographic and Health Survey 2016 [data set on the Internet]. c2019 [cited 2020 Oct 20). Available from: https://www.statssa.gov.za/publications/Report%2003-00-09/Report%2003-00-092016.pdf [ Links ]
21. Patanavanich R, Glantz SA. Smoking is associated with worse outcomes of COVID-19 particularly among younger adults: A systematic review and metaanalysis. BMC Public Health. 2021;21(1):1554. https://doi.org/10.1186/s12889-021-11579-x [ Links ]
22. Clancy L, Gallus S, Leung J, Egbe CO. Tobacco and COVID-19: Understanding the science and policy implications. Tobacco Induced Dis. 2020;18:105. https://doi.org/10.18332/tid/131035 [ Links ]
23. Smith EA, Malone RE. An argument for phasing out sales of cigarettes. Tobacco Control. 2020;29(6):703-708. https://doi.org/10.1136/tobaccocontrol-2019-055079 [ Links ]
24. Filby S, Van der Zee K, Van Walbeek C. The temporary ban on tobacco sales in South Africa: Lessons for endgame strategies. Tobacco Control. Forthcoming 2021. https://doi.org/10.1136/tobaccocontrol-2020-056209 [ Links ]
25. Nimgaonkar I, Valeri L, Susser E, Hussain S, Sunderram J, Aviv A. The age pattern of the male-to-female ratio in mortality from COVID-19 mirrors that of cardiovascular disease in the general population. Aging. 2021;13(3):3190-3201. https://doi.org/10.18632/aging.202639 [ Links ]
26. Tobias A, Riffe T, Ramiro D, Trias-Uimds S. Forthcoming challenges for COVID-19 data collection. The Lancet Public Health. Forthcoming 2022. https://doi.org/10.1016/S2468-2667(22)00029-9 [ Links ]
27. Groenewald P, Bradshaw D, Daniels J, Zinyakatira N, Matzopoulos R, Bourne D, et al. Local-level mortality surveillance in resource-limited settings: a case study of Cape Town highlights disparities in health. Bull World Health Organ. 2010;88(6):444-451. https://doi.org/10.2471/BLT.09.069435 [ Links ]
 Correspondence:
Debbie Bradshaw
Email: debbie.bradshaw@mrc.ac.za
Received: 16 Feb. 2022
Revised: 16 Mar. 2022
Accepted: 18 Mar. 2022
Published: 31 May 2022
Guest Editor: Shabir Madhi
Funding: South African Medical Research Council

