


Services on Demand
Article
 English (pdf)
 Article in xml format
 Article references
Indicators

Related links
-
 Cited by Google
 -
 Similars in Google
Share

 Permalink
South African Journal of Science
On-line version ISSN 1996-7489
Print version ISSN 0038-2353
S. Afr. j. sci. vol.118 n.5-6 Pretoria May./Jun. 2022
http://dx.doi.org/10.17159/sajs.2022/13874
COMMENTARY
Adding up the numbers: COVID-19 in South Africa
Ridhwaan SulimanI, II; Jabu MtsweniI
IInformation and Cyber Security Centre, Council for Scientific and Industrial Research (CSIR), Pretoria, South Africa
IINational Institute for Theoretical and Computational Sciences (NITheCS), Johannesburg, South Africa
ABSTRACT
SIGNIFICANCE: The SARS-CoV-2 pandemic has wreaked havoc globally, with over half a billion people infected and millions of lives lost. The pandemic has also interrupted every aspect of our lives, with most governments imposing various interventions and restrictions on people's movement and behaviour to minimise the impact of the virus and save lives. The debate among scholars on the effectiveness of the interventions and restrictions, particularly in the context of a developing country like South Africa, continues. The data and scientific evidence indicate that non-pharmaceutical interventions, and particularly the implementation and adherence thereto, may have been ineffective in terms of containment in the South African context and had minimal impact in stopping the spread of the SARS-CoV-2 virus
Keywords: SARS-CoV-2, epidemiology, COVID-19, coronavirus testing, non- pharmaceutical interventions
COVID-19 epidemiological trajectory and outlook
The SARS coronavirus (SARS-CoV-2) was declared a pandemic by the World Health Organization (WHO) in early 2020 and has wreaked havoc globally, with over half a billion people infected and 13.3-16.6 million lives lost.1 The South African Department of Health reported its first case on 5 March 2020.2 Since then, and as of 30 April 2022, a total of 3 791 925 SARS-CoV-2 cases or 6314 per million people have been recorded, according to data by South Africa's National Institute for Communicable Diseases (NICD).3 Whilst this number represents a significant total, it remains a substantial underestimate of the true number of infections in the country since the start of the pandemic.
The COVID-19 epidemiological trajectory for South Africa up to the end of April 2022 is shown in Figure 1, where the average number of daily confirmed cases over each epi-week is plotted from the start of the pandemic. Also shown by the colour of the bars in Figure 1 are the average test percentage positivity rates, which are discussed further in the next section. Since March 2020, South Africa has experienced four surges or waves of heightened SARS coronavirus transmission. These surges or waves of infections can clearly be seen in Figure 1. The onset of these waves in South Africa has been regular or predictable, occurring every 6 months and lasting for a duration of approximately 3 months each. The 3 months between resurgences have seen low levels of SARS-CoV-2 transmission at differing baseline levels.
Each of the surges or waves in South Africa have been driven by a new or different SARS-CoV-2 variant that became dominant over that wave. The first wave was driven by the original or wild type variant over the winter months of 2020. This was followed by a Beta-driven second wave in the summer of 2020 and 2021, soon to be followed by a Delta-driven winter wave in 2021. Towards the end of 2021, the highly transmissible Omicron variant emerged in the Gauteng Province and quickly spread throughout the country, and across the world, driving a fourth wave of infections in South Africa.
Also shown in Figure 1, by the dashed vertical lines, are the alert levels or lockdown levels imposed at various times since the initial State of Disaster was declared in South Africa on 15 March 2020. The effectiveness of these lockdowns remains an ongoing debate among scholars.4,5 A strict level 5 lockdown was implemented soon after on 26 March 2020. However, even the harsh restrictions on movement and social interactions under this alert level were not enough to contain or eliminate the virus and prevent the onward spread of infection. The difficulty in a developing country to social distance for extended periods of time, as well as the lack of resources and funding to support such efforts, made it clear that a zero-COVID policy would not be feasible in South Africa.6 This intervention though likely did delay the onset of the first wave, reducing what could have been an even worse scenario. Public health policy shifted to one of mitigation and of protection of the healthcare system for the remaining waves, rather than an attempt to eliminate ongoing transmission, as is evidenced by the increasing levels of restrictions during the second and third waves. The timing of these restrictions, and arguably the implementation and adherence thereto, was always to mitigate the onward transmission and protect healthcare systems from being overwhelmed. During the Omicron or fourth wave, the healthcare system was burdened but under no pressure of being completely overwhelmed and therefore no additional restrictions were implemented. Non-pharmaceutical interventions, including social distancing and restrictions on gatherings, also come with significant socio-economic costs which are arguably no longer feasible or sustainable in South Africa.
A total of 3 791 925 cases, representing approximately 6.2% of South Africa's total population, were confirmed as of 30 April 2022. However, this total does not take into account recurrent infections nor foreigners and visitors; therefore, the confirmed cases likely represent an even lower proportion of South Africa's total population. South Africa remains the most affected country on the African continent by total number of confirmed SARS-CoV-2 cases, and accounts for almost one third of the total cases reported across the continent since the start of the pandemic. There is an ascertainment bias in South Africa, due to more developed laboratory infrastructure as well as the deployment of funds towards testing as compared to other African countries. However, this total remains lower than many countries across Europe, Asia, and the Americas.7 So, is that a fair reflection of reality and, if so, what has South Africa done right? Unfortunately, it is difficult to make one-to-one case comparisons across countries due to differences in the rate of and access to SARS-CoV-2 testing, which directly affects the total number of cases detected. According to recently published seroprevalence surveys8, the estimated levels of immunity in Gauteng are more than 70%. This figure includes acquired immunity through vaccination and natural immunity due to previous infection, and being a representative sample is likely a good estimate of the overall seroprevalence across the country. According to the national vaccination dashboard9, 21 305 271 individuals in the country had received at least a single vaccination dose by 30 April 2022, representing only 35% of the population. With some of those also having been previously infected, the high seroprevalence estimate implies that a large proportion of the population had been previously infected, and many were either asymptomatic or had not presented for testing, thereby resulting in the significant undercount of true infections. With such a high level of infection having occurred, the question arises as to whether the non-pharmaceutical interventions imposed in South Africa, including lockdowns, social distancing and mask-wearing, were effective in preventing or containing the onward transmission of infection of the SARS coronavirus?
Influence of coronavirus testing rates
Testing for SARS-CoV-2 in South Africa has for the most part been limited. Widespread testing can be an efficient tool to curb the onward transmission of the virus, but this needs to be done proactively and in combination with the efficient tracking and isolation of contacts of positive cases. Further, this type of testing strategy needs to be done in a mass randomised manner, ensuring that a representative sample of the population are screened.
In South Africa, the coronavirus testing strategy has not been one that can effectively curb onward spread of the virus, but rather a diagnostic tool to retrospectively identify mostly symptomatic infections. This is because testing is largely driven by those presenting for testing after either showing symptoms of the virus or coming into contact with a person who had recently tested positive. The average number of tests conducted daily in South Africa are shown in Figure 2 on a per weekly basis, according to data by the NICD.3 Counterintuitively, the testing curve has followed the infection curve, rising as a surge of infections is experienced and dropping to a low baseline during the inter-wave periods. Contributing factors for the low testing rates in South Africa, as compared to developed countries, are the lack of resources and the limited funding. The former has meant that laboratories cannot cope with the demand, particularly during surges, resulting in strict testing criteria and testing limited to only those most at risk or patients admitted to hospitals, while the latter further limits access to testing as it is a costly affair for the average South African citizen.
Confirmed case rates are limited by testing rates and testing capacity. With many people not having access to testing, the reported number of cases vastly underestimates the actual number of infections that have occurred. To account for the variability in testing rates, and hence absolute case numbers, a useful metric of test percentage positivity can be utilised, as also shown in Figure 1. This metric is the proportion of positive tests or confirmed cases and is expressed as a percentage of the total number of tests conducted, thereby eliminating the variability of absolute tests conducted. For context, the WHO has recommended that this metric remain under 5%. However, in South Africa, this metric has been above 20% during periods of high prevalence, even rising to above 33%, as can be seen in Figure 1. Based on this metric, it can be estimated that the official case counts are at least ten times lower than the true figure. The high percentage test positivity again confirms that the actual number of infections in South Africa is significantly under-counted.
Public and private COVID-19 hospital admissions
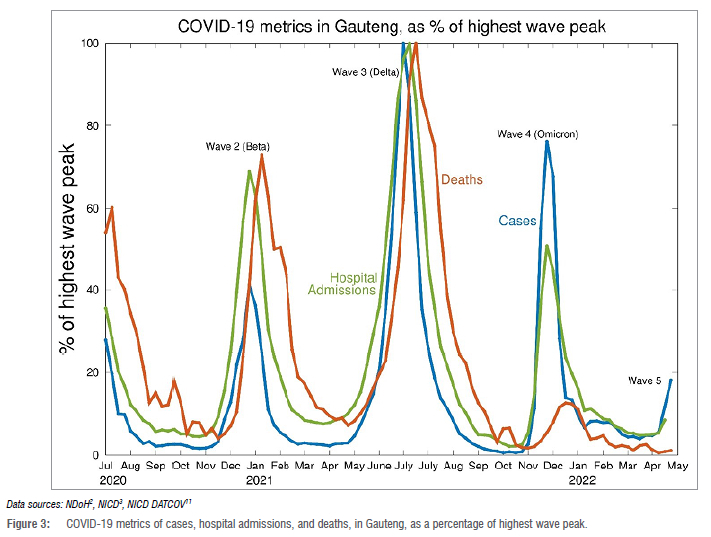
Ultimately, the role of non-pharmaceutical interventions is to reduce the burden on hospitals and, by ensuring hospitals are not overwhelmed, allowing all patients the best access to healthcare facilities and treatment. Hospitalisations for COVID-19 are a lagging indicator, lagging case trends by 1-3 weeks. For the first three waves in South Africa, COVID-19 hospitalisation trends closely followed the trends in cases, making it predictable and affording the opportunity to plan and prepare healthcare facilities and resources as a surge in case rates was encountered. However, during the fourth or Omicron wave in South Africa, this strong link between cases and hospital admissions decoupled or de-linked. While many infections still occurred, due to the most transmissible SARS-CoV-2 variant yet, there were proportionately fewer severe outcomes of hospitalisation and significantly fewer deaths. A comparison between the trends in COVID-19 metrics of cases, hospital admissions, and deaths for the province of Gauteng is shown in Figure 3. The strong link between cases and hospitalisations for the first three waves, followed by a decoupling during the Omicron wave, is evident.
This decoupling between trends during the Omicron wave can be attributed primarily to the high levels of population immunity in the South African community and to the emergence of a variant that is less virulent than previous strains. Estimates from seroprevalence surveys8 indicate levels of immunity of over 70%. With only 35% of the population having received at least a single vaccination dose9, the remaining percentage of immunity is due to natural immunity from previous infection. Whilst high levels of population immunity are favourable, and likely to continue to offer protection from severe disease10, this does confirm that the non-pharmaceutical interventions implemented over the past 2 years were not as effective in completely preventing such a large proportion of the population from getting infected in the first place. However, the interventions were effective in slowing down the rate of infection, thereby preventing spikes in severe disease and lessening the impact on health services during surges.
Estimates of mortality during the pandemic
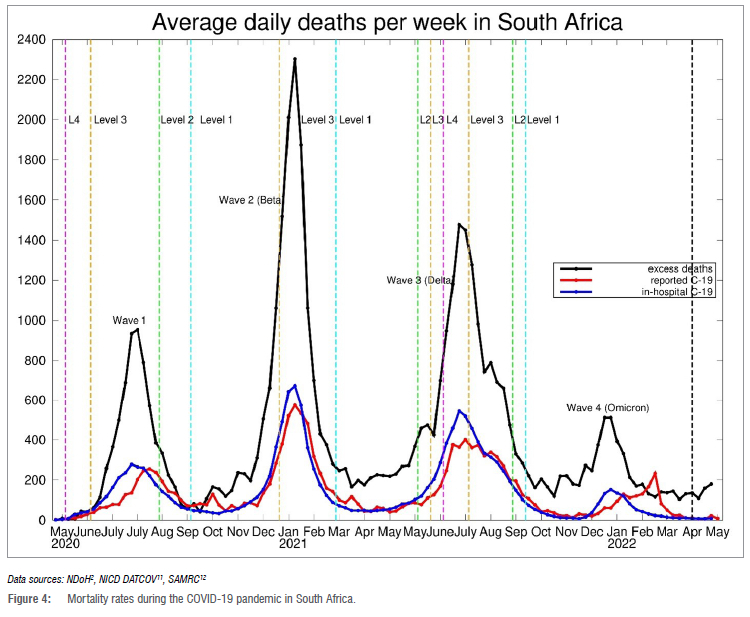
The number of COVID-19 deaths reported in South Africa since the start of the pandemic exceeds one hundred thousand, at 100 363 as of 30 April 2022 or 167.2 when expressed as a rate per 100 000 population.2 This figure is the highest of all countries on the African continent and accounts for almost 40% of the total reported deaths on the continent.7 Whilst significantly high, it is still an underestimate of the true number of deaths due to the virus over the course of the pandemic. Figure 4 compares official COVID-19 deaths nationally as reported by the South African Department of Health2, with those deaths occurring in hospitals as collated by the NICD DATCOV surveillance reporting8, as well as total excess deaths over the same period as published by the South African Medical Research Council12. Based on the trends in the data as well as the timing and geographical spread of the excess deaths, it is clear that the official COVID-19 death toll in South Africa is an underestimate and the true figure is likely two to three times higher than the official count. This places the upper bound estimate of COVID-19 mortality in South Africa at 520 per 100 000 population, making it one of the highest death rates in the world.7
These mortality figures confirm that the high levels of population immunity as per current seroprevalence estimates across South Africa have come at a high cost, with many lives lost since the emergence of the SARS coronavirus in the country. However, the high level of population immunity is now an advantage as it does offer protection against severe disease from current SARS-CoV-2 variants in circulation, as South Africa experienced during its Omicron wave in late 2021 and as shown in Figure 5. Consequently, in reaching these high levels of population immunity, it is evident that many millions of South Africans have been infected over the past 2 years and thousands of lives have consequently been lost.
Concluding remarks
With SARS-CoV-2 likely to remain in circulation for the foreseeable future, it is known that the virus will mutate as it continues to replicate, but the pathogenicity and severity of future variants remains unknown. This raises the question of whether previously utilised measures and non-pharmaceutical interventions will still be necessary in the future, particularly in the South African context. The data and evidence suggest that these non-pharmaceutical interventions likely delayed the transmission of the virus but had little effect in mitigating or eliminating onward transmission. The difficulties in correctly applying and implementing these measures in a developing country like South Africa and effectiveness thereof, and particularly the harmful socio-economic consequences of such measures, needs to be realised. The majority of South Africans have had some exposure to the virus, and whilst this has come at a terrible cost, it points to the fact that previous measures and non-pharmaceutical interventions, and in particular the implementation and adherence thereto, were largely ineffective in containment of infections in the South African context.
Acknowledgements
We acknowledge the National Institute for Communicable Diseases (NICD) and South African Department of Health for the primary COVID-19 data that has been collated, made publicly available and utilised in our research and analysis. We also acknowledge the NICD DATCOV Surveillance for hospitalisation data, and the South African Medical Research Council for data on excess deaths.
Competing Interests
We have no competing interests to declare.
References
1. Knutson V Aleshin-Guendel S, Karlinsky A, Msemburi W, Wakefield J. Estimating global and country-specific excess mortality during the COVID-19 pandemic [preprint]. c2022 [cited 2022 May 04]. Available from: https://cdn.who.int/media/docs/default-source/world-health-data-platform/covid-19-excessmortality/covid-methods-paper-revision.pdf?sfvrsn=2465306b_1&download=true [ Links ]
2. National Department of Health, South Africa (NDoH). SA Corona Virus Online Resource and News Portal [homepage on the Internet]. No date [cited 2022 May 01]. Available from: https://sacoronavirus.co.za/ [ Links ]
3. South African National Institute for Communicable Diseases (NICD). National COVID-19 daily report - NICD [webpage on the Internet]. No date [cited 2022 May 01]. Available from: https://www.nicd.ac.za/diseases-a-z-index/disease-index-covid-19/surveillance-reports/national-covid-19-daily-report/ [ Links ]
4. Mbunge E. Effects of COVID-19 in South African health system and society: An explanatory study. Diabetes Metab Syndr. 2020;14(6):1809-1814. https://doi.org/10.1016/j.dsx.2020.09.016 [ Links ]
5. Mabuka T, Ncube N, Ross M, Silaji A, Macharia W, Ndemera T, et al. The impact of non-pharmaceutical interventions on the first COVID-19 epidemic wave in South Africa [preprint]. medRxiv. 2021.06.29.21259625. https://doi.org/10.1101/2021.06.29.21259625 [ Links ]
6. Noorbhai H, Suliman R. A mathematical model and strategy to guide the reopening of BRICS economies during the COVID-19 pandemic. In: Azar AT, Hassanien AE, editors. Modeling, control and drug development for COVID-19 outbreak prevention. Studies in Systems, Decision and Control. Volume 366. Cham: Springer; 2022. https://doi.org/10.1007/978-3-030-72834-2_22 [ Links ]
7. Our World in Data (OWID). COVID-19 data explorer [webpage on the Internet]. No date [cited 2022 May 02]. Available from: https://ourworldindata.org/explorers/coronavirus-data-explorer [ Links ]
8. Madhi SA, Kwatra G, Myers JE, Jassat W, Dhar N, Mukendi CK. Population immunity and Covid-19 severity with Omicron variant in South Africa. N Engl J Med. 2022;386:1314-1326. https://doi.org/10.1056/NEJMoa2119658 [ Links ]
9. National Department of Health, South Africa (NDoH). COVID-19 public dashboard [webpage on the Internet]. No date [cited 2022 Apr 30]. Available from: https://app.powerbi.com/w?r=eyJrIjoiMDNlNTMyZWUtYjkyYS00NGE1LTliZTktZDI4MDU0ZTU0OTk1IiwidCI6ImE1MTczNzFjLWYzMTYtNDg0Yy1hYzVjLTk4Yjc2MTI3NzkwYSIsImMiOjl9 [ Links ]
10. Keeton R, Tincho MB, Ngomti A, Baguma R, Benede N, Suzuki A, et al. T cell responses to SARS-CoV-2 spike cross-recognize Omicron. Nature. 2022;603:488-492. https://doi.org/10.1038/s41586-022-04460-3 [ Links ]
11. South African National Institute for Communicable Diseases (NICD). Daily hospital surveillance (DATCOV) report - NICD [webpage on the Internet]. No date [cited 2022 May 01]. Available from: https://www.nicd.ac.za/diseases-a-z-index/disease-index-covid-19/surveillance-reports/daily-hospital-surveillance-datcov-report/ [ Links ]
12. South African Medical Research Council (SAMRC). Report on weekly deaths in South Africa [webpage on the Internet]. No date [cited 2022 May 04]. Available from: https://www.samrc.ac.za/reports/report-weekly-deaths-south-africa [ Links ]
 Correspondence:
Ridhwaan Suliman
Email: rsuliman@csir.co.za
Published: 31 May 2022

