


Servicios Personalizados
Articulo
 Inglés (pdf)
 Articulo en XML
 Referencias del artículo
Indicadores

Links relacionados
-
 Citado por Google
 -
 Similares en Google
Compartir

 Permalink
South African Journal of Science
versión On-line ISSN 1996-7489
versión impresa ISSN 0038-2353
S. Afr. j. sci. vol.118 no.1-2 Pretoria ene./feb. 2022
http://dx.doi.org/10.17159/sajs.2022/11607
RESEARCH ARTICLE
Selection for resistance to cassava mosaic disease in African cassava germplasm using single nucleotide polymorphism markers
Esperance D. CodjiaI, II; Bunmi OlasanmiI, III; Paterne A. AgreII; Ruth UwugiarenII; Adenike D. IgeI, II; Ismail Y RabbiII
IPan African University Life and Earth Sciences Institute (including Health and Agriculture), University of Ibadan, Ibadan, Nigeria
IIInternational Institute of Tropical Agriculture (IITA), Ibadan, Nigeria
IIIDepartment of Agronomy, University of Ibadan, Ibadan, Nigeria
ABSTRACT
Cassava mosaic disease (CMD) is one of the main constraints that hamper cassava production. Breeding for varieties that are CMD resistant is a major aim in cassava breeding programmes. However, the use of the conventional approach has its limitations, including a lengthy growth cycle and a low multiplication rate of planting materials. To increase breeding efficiency as well as genetic gain of traits, SNP markers can be used to screen and identify resistant genotypes. The objective of this study was to predict the performance of 145 cassava genotypes from open-pollinated crosses for CMD resistance using molecular markers. Two SNP markers (S12 7926132 and S144626854), previously converted into Kompetitive allele-specific PCR (KASP) assays, as well as CMD incidence and severity scores, were used for selection. About 76% of the genotypes were revealed to be resistant to CMD based on phenotypic scores, while over 24% of the total population were found to be susceptible. Significant effects were observed for alleles associated with marker S12 7926132 while the other marker had nonsignificant effects. The predictive accuracy (true positives and true negatives) of the major CMD2 locus on chromosome 12 was 77% in the population used in this study. Our study provides insight into the potential use of marker-assisted selection for CMD resistance in cassava breeding programmes.
SIGNIFICANCE:
• With an aim towards reducing the food insecurity rate in Africa, we report on the use of genetic tools for a fast and efficient release of new cassava varieties to benefit breeders, farmers and consumers, given the food and industrial importance of this staple crop.
• This study adds tremendous knowledge to phenotypic and molecular screening for CMD resistance. The outcome will encourage breeders in various cassava breeding programmes to accelerate genetic gains as well as increase breeding accuracy and efficiency for CMD resistance.
Keywords: CMD resistance, SNP markers, KASP genotyping, prediction accuracy, marker-assisted selection
Introduction
Cassava is one of the staple crops in Africa. The importance of this crop lies in the high starch content of its storage roots, which provides a cheap source of calories in developing countries where malnutrition and calorie deficiency are widespread.1 In 2019, Africa accounted for 63% of the 303 million metric tons produced globally, with Nigeria being the highest producer.2 Cassava leaves and delicate shoots are eaten as vegetables in many parts of Africa.1 Cassava is also used to make cassava starch, which is used as a raw material in the food, textile, paper, and glue industries.3
Despite the economic importance of the crop, a large number of constraints hinder cassava production in Africa, especially in Nigeria where a high incidence of pests and diseases, unavailability of agrochemicals and insecticides, and degradation of soil fertility as a result of erosion and urbanisation have been reported.4
Cassava mosaic disease (CMD) is one of the most devastating viral plant diseases in Africa. It can cause yield losses ranging from 12% to 82% depending on infection type and cassava variety.5 These translate into an annual reduction of more than 30 million tons of fresh root yield.6 The disease is caused by cassava mosaic geminivirus of the family Geminiviridae and genus Begomovirus7and the symptoms vary from irregular yellow to yellow-green chlorotic areas on the leaves, leading to leaf distortion and plant stunted growth.
The deployment of host plant resistance and the application of cultural treatments, particularly phytosanitation, are the most extensively utilised approaches in reducing the negative impacts of CMD.8 However, the use of resistant varieties is the most sustainable solution because it decreases disease-related production losses as well as the inoculum source for whitefly (Bemisia tabaci) which is known to be the disease vector.9
Genetic mapping studies have identified three sources of CMD resistance: CMD1 (recessive and polygenic), CMD2 (monogenic and dominant), and CMD3 (quantitative trait locus or QTL for CMD resistance)9,10, but CMD2 remains the most commonly employed11. CMD1, known as the polygenic source of resistance, was derived from the wild species Manihot glaziovii.12The CMD2, which is monogenic, was discovered in some West African cassava landraces (tropical Manihot esculenta).12,13The complementary effect between the CMD2 locus and a newly identified QTL confers CMD3 source of resistance.14
A traditional cassava breeding programme relies on phenotypic characterisation of mature plants15, which makes it last for about a decade, leading to a delay in releasing a new variety. The low multiplication rate of planting material needed for phenotypic screening across multi-environments, and variation in performance of the plants due to the physiological status of the cuttings, are some of the several factors that reduce breeding efficiency in cassava programmes16 thus resulting in a low rate of genetic gain. To overcome the aforementioned limitations, molecular markers such as single nucleotide polymorphisms (SNPs) can be incorporated in cassava breeding programmes for rapid genetic improvement of traits of interest through marker-assisted selection. Marker-assisted selection is a technique that involves establishing a link between a molecular marker and the chromosomal location of the QTL that controls the desired trait.17
Understanding the genetic architecture is necessary for the development of molecular tools to speed up the transfer of beneficial genes into farmer-preferred cultivars.18 Significant loci linked to some important traits including CMD resistance were identified through a genome-wide association study which was conducted at the International Institute of Tropical Agriculture, Nigeria.18 The favourable alleles at the most significant markers associated with CMD resistance, S12 7926132 (allele G/T) and S144626854 (A/G), were T and A, respectively.18 SNPs tagging major loci could be useful for screening and identifying individuals with favourable alleles during the early stages of selection if allele-specific high-throughput SNP tests are developed. Before large-scale implementation, a validation study of these loci is required to guarantee their relevance across environments and populations.18
The major objective of this work was to predict the performance of cassava genotypes for CMD resistance using SNP molecular markers and phenotypic data.
Materials and methods
Field experiment and CMD evaluation
A population comprising 145 cassava genotypes was evaluated for CMD incidence and severity at the Teaching and Research Field of the Department of Agronomy, University of Ibadan, Nigeria, during two cropping seasons (2019/2020 and 2020/2021). The seeds of the genotypes were derived from open-pollinated crosses and were collected from five female parents (IITA-TMS011368; IITA-TMS011371; IITA-TMS011412; IITA-TMS070593 and IITA-TMS070539).
To minimise experimental error related to the large experimental field size, the genotypes were divided into four sets. The trial was laid out using a randomised complete block design with two replications per set. The experimental site was cleared and ridges were made with a row spacing of 3 m between sets. A total of 20 cuttings (25-30 cm long) from matured stems of each genotype were planted in a plot size of 20 m2 at a spacing of 1 m x 1 m. The experimental location was chosen because of the high disease pressure by cassava mosaic virus.9 Moreover, the early stage (first 6 months) of the plants corresponded with the period of high whitefly activity, resulting in a significant risk of disease exposure. Variety IITA-TMS-IBA070593 was included as a resistant control while IITA-TMS-IBA30572 and IITA-TMS-IBA30555 were used as susceptible controls.
Data on CMD incidence and severity scores were collected at 1, 3, and 5 months after planting. The incidence was recorded as the ratio of the number of plants with symptoms to the total number of plants per plot. The severity of CMD was measured on a scale of 1 to 5, with 1 denoting no symptoms, 2 denoting mild chlorotic areas on most leaves, with the remaining parts of the leaves and leaflets appearing green and healthy, 3 denoting a pronounced mosaic pattern on most leaves, with distortion of the lower one-third of most leaves, 4 denoting severe mosaic pattern on most leaves, and 5 denoting very severe mosaic symptoms on all leaves, often accompanied by stunting of the plant.1,19
DNA extraction
A modified Dellaporta approach was used to extract genomic DNA from freeze-dried leaf samples.20 The DNA quantification and purity were checked using a NanoDrop spectrophotometer (ND-8000, Thermo Fisher Scientific, USA). The absorbance at a wavelength of 260/280 nm ranging from 1.80 to 2.0 indicates that the DNA solution was free of contaminants. The quality of the DNA samples was checked on 1% agarose gel (Sunrise 96, Biometra, Göttingen, Germany) and bands were viewed on a gel documentation system (Labnet ENDURO GDS Gel Documentation System Aplegen) incorporated with an ultraviolet transilluminator.
Kompetitive allele-specific PCR genotyping
Markers S12 7926132 and S144626854 derived from Rabbi et al.18 were used to screen the cassava genotypes for resistant and susceptible alleles. The sequences of the specific forward and common reverse primers used for the Kompetitive allele-specific PCR (KASP) genotyping were extracted from Ige et al.21 and are presented in Table 1. A positive (IITA-TMS-IBA070593) and two negative (IITA-TMS-IBA30572 and IITA- TMS-IBA30555) control varieties were included in the genotyping as well as a no-template control of 5 of distilled water. The KASP reaction mix consisted of 5 of DNA at a concentration of 50 ng and 5 of the prepared genotyping mix [5 (2 χ KASP master mix) and 0.14 primer mix]. The PCR cycling was performed as follows: hot-start activation at 94 °C for 15 min followed by 10 touchdown cycles (20 s at 94 °C; touchdown at 61 °C to 55 °C initially and dropping by 0.6 °C per cycle for 60 s), followed by 26 additional cycles (20 s at 94 °C; 55 °C for 20 s). The KASP genotyping reactions were run on the Roche Light Cycler 480-II at the Biosciences Unit, International Institute of Tropical Agriculture (IITA), Ibadan, Nigeria.
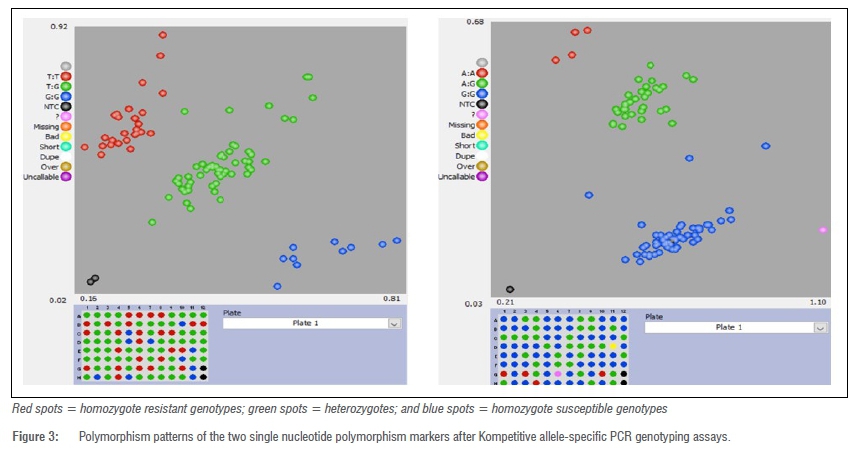
The SNPs were called using KlusterCaller software (LGC, Biosearch Technologies, USA) and visualised based on the fluorescence signal using the SNPviewer software (LGC, Biosearch Technologies), where data on SNP allele calls were visualised graphically. Fluorophores FAM and HEX plotted on the x- and y-axes, respectively, allowed the distinction of the assayed genotypes.
Statistical analysis
Phenotypic data analysis
The mean cassava mosaic disease severity scores (CMDSS) were subjected to a combined analysis of variance across the two years of experimentation to assess the genotypes, year, and block effects on the expression of the disease using aov function in Agricolae R package.22 The disease progress curve for the average CMDSS across the three periods of observation was plotted using Agricolae package in R software. To obtain the BLUE (best linear unbiased estimator) value for each genotype, a linear mixed model was fitted using the lm4 R package to estimate the performance of each genotype independent of the season, block, and replication. The year, block, and replications were treated as random variables while the genotypes and checks were considered fixed. The statistical model for randomised complete block design23 used with few adaptations is as follows:
where ynis the phenotypic value, μ is the overall average (shared by all observations), β is the effect of block i, τis the specific effect to genotype j, ykis the specific effect to year k and εηis an effect specific to each experimental unit (combination block and genotype).
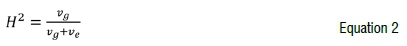
Least significant difference was used to compare the genotypes' BLUEs for CMDSS at 5%. Broad-sense heritability for CMDSS was determined as described by Ige et al.21 according to Equation 2:
where IP stands for broad-sense heritability, vg for genotypic variance and ve for residual variance.
Marker data analysis
Polymorphism information content (PIC) and favourable allele frequency were calculated using R base package22 and Tassel software jointly.24 The lm function from the lm4 package was used to compute the analysis of variance of the markers. Boxplots were plotted using the ggpubr R package to assess the discriminative power of each marker allele combination. The correlation analysis between the two markers was performed using the cor.test function in stats package.
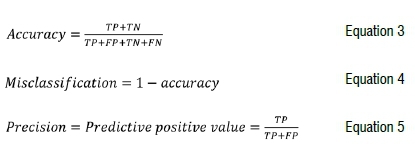
Breeding metrics determination
For evaluation of the marker's accuracy, two main groups of genotypes were constituted, following Lokko et al.25's classification method: resistant group (comprising individuals with CMDSS of 1 to 2) and susceptible group (comprising individuals with CMDSS of 2.1 to 5). Thereafter, a confusion matrix was generated as described by Olasanmi et al.26 which enabled the estimation of false positive and false negative individuals. Breeding metrics such as accuracy, precision, and misclassification were calculated as follows:

where TN is true negative, TP is true positive, FP is false positive, and FN is false negative. The FP refers to the number of genotypes predicted to be resistant by the marker and were susceptible in the field while the FN are the individuals that had unfavourable alleles at the marker but were resistant based on field screening.
Logistic regression analysis
To assess the probability of markers in predicting resistance or susceptibility, a binary logistic regression analysis was performed. The entire data were used to fit the model using the glm function in tidymodels packages in R software. CMD severity BLUE value was used as a dependent variable while marker data were considered independent variables (predictor). Individuals with CMDSS of 1-2.0 were considered as unaffected while those with CMDSS 2.1-5 were categorised as affected according to Lokko et al.25
The mathematical formula used as described by Ige et al.21 is:
where πindicates the probability that a genotype is resistant or susceptible, βοis the intercept constant, and βιis the regression coefficient associated with the xi explanatory variable (S12 7926132). The logistic regression model fitted was validated on a bootstrapped sample (n=10).
Results
Phenotypic evaluation of genotypes for cassava mosaic disease
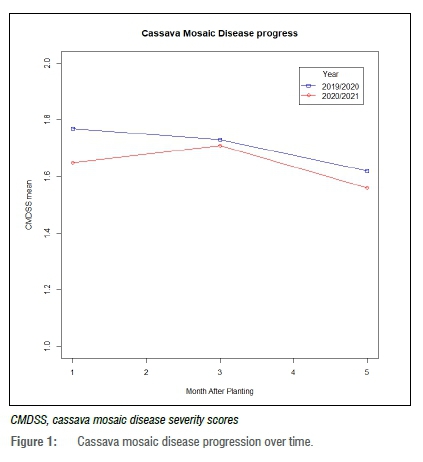
The evaluation of the disease progress over time revealed that the average CMD severity score recorded during the first year of the experiment (2019/2020) was 1.71 while that of the 2020/2021 season was 1.64 (Figure 1). A decrease in disease severity was observed after the first 3 months of planting during the two years of experimentation (Figure 1).
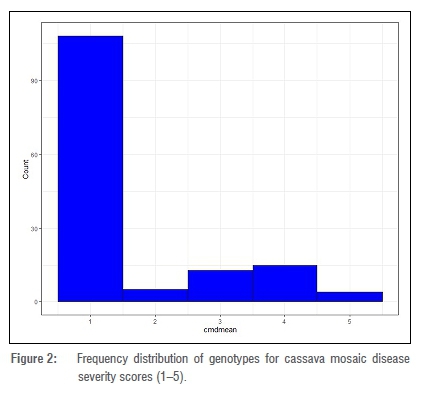
The frequency distribution of the mean CMDSS across the two years was observed to be bimodal. However, the majority of the genotypes were within the first peak with a severity score of 1 (Figure 2). The combined analysis of variance across the 2 years revealed significant effects for year, genotypes, and genotype x year for CMD severity with a coefficient of variation of 16.68% (Table 2). There was a significant variability at 5% among the genotypes as revealed by the least significant difference test (Supplementary table 1). Based on the severity scores, about 76% of the genotypes evaluated were resistant to CMD while the remaining were susceptible (Figure 2). The broad-sense heritability of cassava mosaic disease was 0.97 in the African cassava population.
Marker informativeness and allelic effects on CMD resistance
In the study population, the frequencies of the favourable alleles at marker S12 7926132 (T) and marker S14 4626854 (A) were 0.65 and 0.22, respectively. The two markers had polymorphism information content (PIC) values of 0.36 (S14 4626854) and 0.46 (S12 7926132).
The markers were shown to have a high call rate (>98%) as revealed by the KASP genotyping results. For each marker, three distinct clusters (favourable homozygous genotypes, unfavourable homozygous genotypes, and heterozygotes) were observed (Figure 3).
Boxplots showed that only the marker on chromosome 12 was able to discriminate favourable allele (T) from susceptible allele (G) for both CMDSS and mean incidence (Figure 4). The majority of the genotypes carrying at least a copy of allele T had a CMDSS of 1 (resistant) while individuals with two copies of the allele G had a mean CMDSS of 3.42 (susceptible). Similarly, for mean incidence, most of the genotypes with allele copies TT and TG had a mean incidence of 0%, whereas 76.67 was recorded for marker genotype GG (Figure 4). Also, a non-significant correlation (/=0.16; p>0.05) was observed between the two markers.

Marker-trait association and prediction of genotype response to CMD
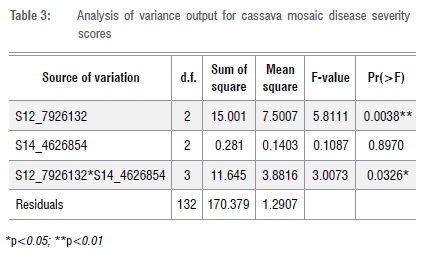
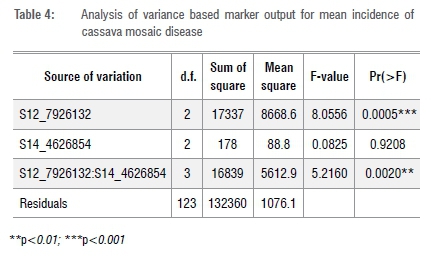
The analysis of variance based on the marker and phenotypic data revealed a significant (p<0.01) association between S12 7926132 and the genotypes' response to CMD while S14 4626854 was not significantly associated (Table 3). It was observed that the interaction between the two markers was significant (p<0.01) on the mean CMDSS (Table 3). For mean incidence, a similar trend was observed (Table 4). These findings suggest that the newly identified locus associated with S14 4626854 could be polygenic with additive effects.
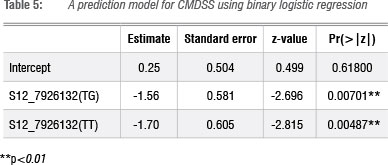
Discriminating marker S12 7926132 was used as an independent variable in a binary logistic regression model. The effects of allele combinations TT and TG associated with the explanatory variable were significant in predicting genotypes' CMDSS (Table 5). This observation corroborates the results presented in Figure 4 which further highlights the crucial role of the T allele in conferring resistance to CMD. The model's area under curve (AUC) value was 0.61 and the probability that the marker would predict resistance and susceptibility is 0.20 and 0.56, respectively, with an accuracy of 0.77. Bootstrapped samples used for model validation resulted in accuracy values ranging from 0.72 to 0.83 with a mean of 0.77 and AUC values between 0.54 and 0.68 with an average of 0.61 (Supplementary table 2).
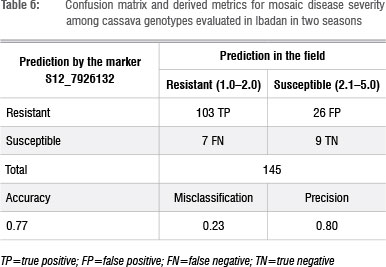
Breeding metrics for marker S12 7926132 in predicting response to CMD
Of the 145 assayed genotypes, 103 were true positives and 9 were true negatives (Table 6), resulting in an accuracy of 77%. Thus, the misclassification (1-accuracy) was 23%, of which 26 genotypes were false positives and 7 were false negatives.
Discussion
The highest peak of the average disease severity observed at 1 month after planting in the first year of the field evaluation might be due to an increase in the whitefly (Bemisia tabaci) population. Time et al.27 observed a peak in the whitefly population during the early plant growth stage of cassava (first 30 days after planting) and a decline thereafter during the period of slow cassava growth due to maturity. The observation could also be due to the vector's preference for the succulent nature of plants in their young stages.27 The slight decrease in the average CMD severity observed in the 2020/2021 cropping season could be as a result of the recovery of some genotypes from CMD infestation or reduced whitefly population. The high broad-sense heritability for CMDSS in the African cassava population suggests that CMD resistance is highly influenced by genetic components. Ige et al.21 reported a broad-sense heritability of 0.90 in a breeding population of cassava derived from IITA's elite genotype crosses at the clonal evaluation trial stage in 2018.
Three major categories of metrics are usually considered when studying the ability of a marker in a population for the absence or presence of QTLs linked to a trait.28 These include technical metrics which evaluate the performance of the marker in the genotyping assay, the biological metrics which describe the association of the marker with the QTL/ gene/allele, and breeding metrics that check the accuracy of a marker in a particular breeding programme.28 In our study, there were more false positives than false negatives. This result is consistent with the findings of Javid et al.29 who validated marker PsMlo on a set of 171 field pea genotypes for powdery mildew disease resistance and boron tolerance. The low false negative rate observed indicated that the natural exposure method to cassava mosaic geminivirus for phenotypic CMD screening was efficient and Ibadan remains a confirmed area of high disease pressure. The absence of symptoms as observed by the low false negative rate in the field does not reflect genetic resistance to the virus infection; instead, it could suggest a lack of virus infection.25,30 Symptomless plants could be CMD-free (escapes) or they could have been extremely tolerant.31,32 Therefore, in combination with field evaluation for CMD, polymerase chain reaction (PCR) detection methods using cassava mosaic geminivirus strain-specific primers is an alternative method that could give more precision about the presence or absence of the virus coat protein in the assayed genotypes.25,30
According to Platten et al.28, the ideal genetic distance between a marker and its associated QTL/gene should be 0 cM. Rabbi et al.9 reported that marker S12 7926132 is about 45 kbp away from the two candidate peroxidase genes, Manes.12G076300 and Manes.12G076200, for CMD resistance. Possible recombination between the marker and the locus, the presence of a marker haplotype indistinguishable from the expected allele size, or possibly another available source of CMD resistance that can be exploited in new breeding programmes might have resulted in the false positives and false negatives.29
False positives and false negatives are usually high when a marker is applied to a small breeding population, as in this current study.28 Many QTL-linked markers discovered might be informative in the mapping population but will perform poorly in other independent populations when used for marker-assisted selection.28 This usually happens when the marker is used in a population in which at least one parent's QTL status is unknown.28 This could have also explained the observed false positive and false negative rates as the genotypes screened in this study were derived from open-pollinated crosses. Thus, as the male parents' resistance status are unknown, the resistance allele may not be associated with the CMD2 locus. The level of accuracy reported in this study is similar to the value (79%) reported for marker PsMlo for its association with powdery mildew resistance and the boron tolerance trait across a set of pea germplasm by Javid et al.29 In a recent study by Ige et al.,21 similar accuracy values of 80% and 78% were reported in pre-breeding and breeding cassava populations, respectively. On the other hand, the accuracy values reported by Olasanmi et al.26, who used simple-sequence repeats to screen five cassava populations at the seedling nursery stage, were lower (61% to 74%) than the value found in the present study. The marker on chromosome 12 was more accurate in predicting susceptibility (56%) than resistance (20%) in our cassava population, which is in contrast with the findings reported by Ige et al.21 This could be attributed to the higher number of false positive genotypes recorded compared to that of false negatives.
Our study also confirmed the role of the dominant T allele which confers resistance at the CMD2 locus on chromosome 12 as previously reported by Akano et al.12 and Rabbi et al.9 The introgression of this locus into susceptible elite varieties is relatively easy because of its qualitative nature of inheritance.33 However, vertical resistance is strain-specific and non-durable compared to horizontal resistance which protects the host plant against a wide spectrum of strains with an intermediate level of resistance.33 Marker-assisted selection has been revealed to be efficient in increasing the selection accuracy, and hence decreasing the rigours of genotype screening across seasons and locations.26 However, its combination with genomic selection for the selection of genotypes with horizontal resistance would also be recommended for sustainable breeding for CMD resistance.
Conclusion
We investigated the use of SNP markers S127926132 and S144626854 in predicting resistance to CMD. Marker S127926132 was efficient in detecting the CMD2 locus in the study population with an accuracy of 77%; hence, the marker could be deployed for marker-assisted selection in African cassava genetic backgrounds. However, its efficiency might be tested on other cassava breeding populations across the globe to expand its deployment for marker-assisted selection. Also, the 103 resistant genotypes identified and selected based on phenotypic scores and marker data could be used as potential parents in breeding programmes targeting CMD resistance on the continent and should also be tested for agronomic traits stability in multi-environments.
Acknowledgements
We thank the Cassava Improvement Programme of the University of Ibadan, Nigeria, for providing the plant material and the facilities for phenotyping. We acknowledge support from the International Institute of Tropical Agriculture for the genotyping platform and training provided. We also thank Stephen Adiga for his assistance during the establishment of the experiment and field screening for cassava mosaic disease. We are grateful to the African Union Commission for a PhD scholarship granted to E.D.C. to complete a PhD programme in plant breeding at PAULESI, Ibadan, Nigeria.
Competing interests
We have no competing interests to declare.
Authors' contributions
E.D.C., B.O. and I.Y.R. conceptualised the study; E.D.C and B.O. screened the populations in the field for response to CMD; B.O. input and collated the phenotypic data; I.Y.R. developed the SNP markers; R.U. and E.D.C. carried out the genotyping work and collated the molecular data; E.D.C., B.O., PA., and A.D.I. carried out the statistical analysis; E.D.C. wrote the paper with input and supervision from O.B. and I.YR.
References
1. International Institute of Tropical Agriculture (IITA). Cassava in tropical Africa: A reference manual. Ibadan: IITA; 1990. Available from: https://www.iita.org/wp-content/uploads/2016/06/Cassava_in_tropical_Africa_a_reference_ manual_1990.pdf [ Links ]
2. FAOSTAT. Crops and livestock products [webpage on the Internet]. c2019 [cited 2021 May 30]. Available from: https://www.fao.org/faostat/en/#data/QCL [ Links ]
3. Nassar NM, Ortiz R. Cassava improvement: Challenges and impacts. J Agric Sci. 2007;145(2):163-171. https://doi.org/10.1017/S0021859606006575 [ Links ]
4. Akinnagbe OM. Constraints and strategies towards improving cassava production and processing in Enugu North Agricultural Zone of Enugu State, Nigeria. Bangladesh J Agric Res. 2010;35(3):387-394. https://doi.org/10.3329/bjar.v35i3.6445 [ Links ]
5. Owor B, Legg JP Okao-Okuja G, Obonyo R, Ogenga-Latigo MW. The effect of cassava mosaic geminiviruses on symptom severity, growth and root yield of a cassava mosaic virus disease-susceptible cultivar in Uganda. Ann Appl Biol. 2004;145(3):331-337. https://doi.org/10.1111/j.1744-7348.2004.tb00390.x [ Links ]
6. Legg JP, Owor B, Sseruwagi P, Ndunguru J. Cassava mosaic virus disease in East and Central Africa: Epidemiology and management of a regional pandemic. Adv Virus Res. 2006;67:355-118. https://doi.org/10.1016/S0065-3527(06)67010-3 [ Links ]
7. Patil BL, Fauquet CM. Cassava mosaic geminiviruses: Actual knowledge and perspectives. Mol Plant Pathol. 2009;10(5):685-701. https://doi.org/10.1111/j.1364-3703.2009.00559.x [ Links ]
8. Legg JP. African cassava mosaic disease. In: Mahy BWJ, Van Regenmortel MHV, editors. Encyclopedia of virology. 3rd ed. Cambridge, MA: Academic Press; 2008. p. 30-36. https://doi.org/10.1016/B978-012374410-4.00693-2 [ Links ]
9. Rabbi IX Hamblin MT, Kumar PL, Gedil MA, Ikpan AS, Jannink JL, Kulakow PA. High-resolution mapping of resistance to cassava mosaic geminiviruses in cassava using genotyping-by-sequencing and its implications for breeding. Virus Res. 2014;186:87-96. https://doi.org/10.1016/j.virusres.2013.12.028 [ Links ]
10. Houngue JA, Zandjanakou-Tachin M, Ngalle HB, Pita JS, Cacaï GH, Ngatat SE, et al. Evaluation of resistance to cassava mosaic disease in selected African cassava cultivars using combined molecular and greenhouse grafting tools. Physiol Mol Plant Pathol. 2019;105:47-53. https://doi.org/10.1016/j.pmpp.2018.07.003 [ Links ]
11. Kuria P Ilyas M, Ateka E, Miano D, Onguso J, Carrington JC, Taylor NJ. Differential response of cassava genotypes to infection by cassava mosaic geminiviruses. Virus Res. 2017;227:69-81. https://doi.org/10.1016/j.virusres.2016.09.022 [ Links ]
12. Akano AO, Dixon AG, Mba C, Barrera E, Fregene M. Genetic mapping of a dominant gene conferring resistance to cassava mosaic disease. Theor Appl Genet. 2002;105(4):521-525. https://doi.org/10.1007/s00122-002-0891-7 [ Links ]
13. Fondong VN. The search for resistance to cassava mosaic geminiviruses: How much we have accomplished, and what lies ahead. Front Plant Sci. 2017;8:408. https://doi.org/10.3389/fpls.2017.00408 [ Links ]
14. Okogbenin E, Egesi CN, Olasanmi B, Ogundapo O, Kahya S, Hurtado P et al. Molecular marker analysis and validation of resistance to cassava mosaic disease in elite cassava genotypes in Nigeria. Crop Sci. 2012;52(6):2576-2586. https://doi.org/10.2135/cropsci2011.11.0586 [ Links ]
15. Wolfe MD, Del Carpio DP Alabi O, Ezenwaka LC, Ikeogu UN, Kayondo IS, et al. Prospects for genomic selection in cassava breeding. Plant Genome. 2017;10(3):19. https://doi.org/10.3835/plantgenome2017.03.0015 [ Links ]
16. Ceballos H, Kulakow P Hershey C. Cassava breeding: Current status, bottlenecks and the potential of biotechnology tools. Trop Plant Biol. 2012;5(1):73-87. https://doi.org/10.1007/s12042-012-9094-9 [ Links ]
17. Talukdar D. Leguminosae. In: Maloy S, Hughes K, editors. Brenner's encyclopedia of genetics. 2nd ed. Cambridge, MA: Academic Press; 2013. p. 212-216. https://doi.org/10.1016/B978-0-12-374984-0.00854-8 [ Links ]
18. Rabbi IY Kayondo SI, Bauchet G, Yusuf M, Aghogho CI, Ogunpaimo K, et al. Genome-wide association analysis reveals new insights into the genetic architecture of defensive, agro-morphological and quality-related traits in cassava. Plant Mol Biol. 2020, 19 pages. https://doi.org/10.1007/s11103-020-01038-3 [ Links ]
19. Mukiibi DR, Alicai T, Kawuki R, Okao-Okuja G, Tairo F, Sseruwagi P et al. Resistance of advanced cassava breeding clones to infection by major viruses in Uganda. Crop Protect. 2019;115:104-112. https://doi.org/10.1016/j.cropro.2018.09.015 [ Links ]
20. Deilaporta SL, Wood J, Hicks JB. A plant DNA minipreparation: Version II. Plant Mol Biol Rep. 1983;1(4):19-21. https://doi.org/10.1007/BF02712670 [ Links ]
21. Ige AD, Olasanmi B, Nkouaya Mbanjo EG, Kayondo IS, Parkes EY Kulakow P, et al. Conversion and validation of uniplex SNP markers for selection of resistance to cassava mosaic disease in cassava breeding programs. Agronomy. 2021;11(3):420. https://doi.org/10.3390/agronomy11030420 [ Links ]
22. R Core Team. R: A language and environment for statistical computing. Vienna: R Foundation for Statistical Computing; 2020. Available from: http://www.r-project.org/index.html [ Links ]
23. Dixon P. Should blocks be fixed or random? In: Proceedings of the 28th annual Conference on Applied Statistics in Agriculture; 2016 May 01-03; Manhattan, KS, USA. Manhattan, KS: New Prairie Press; 2016. p. 23-39. https://doi.org/10.4148/2475-7772.1474 [ Links ]
24. Bradbury PJ, Zhang Z, Kroon DE, Casstevens TM, Ramdoss Y Buckler ES. TASSEL: Software for association mapping of complex traits in diverse samples. Bioinformatics. 2007;23(19):2633-2635. https://doi.org/10.1093/bioinformatics/btm308 [ Links ]
25. Lokko Y Danquah EY Offei SK, Dixon AG, Gedil MA. Molecular markers associated with a new source of resistance to the cassava mosaic disease. Afr J Biotechnol. 2005;4(9):873-881. https://www.ajol.info/index.php/ajol/search?query=doi [ Links ]
26. Olasanmi B, Kyallo M, Yao N. Marker-assisted selection complements phenotypic screening at seedling stage to identify cassava mosaic disease-resistant genotypes in African cassava populations. Sci Rep. 2021;11(1):1-8. https://doi.org/10.1038/s41598-021-82360-8 [ Links ]
27. Time I, Okoroafor E, Nwogwugwu JO, Batcho AA. Evaluation of whitefly population and weather effect of cassava mosaic incidence on commonly grown cassava in Benue State, Nigeria. J Appl Sci Environ Manag. 2020;24(10):1839-1846. https://doi.org/10.4314/jasem.v24i10.20 [ Links ]
28. Platten JD, Cobb JN, Zantua RE. Criteria for evaluating molecular markers: comprehensive quality metrics to improve marker-assisted selection. PLoS ONE. 2019;14(1), e0210529. https://doi.org/10.1371/journal.pone.0210529 [ Links ]
29. Javid M, Rosewarne GM, Sudheesh S, Kant P, Leonforte A, Lombardi M, et al. Validation of molecular markers associated with boron tolerance, powdery mildew resistance and salinity tolerance in field peas. Front Plant Sci. 2015;6:917. https://doi.org/10.3389/fpls.2015.00917 [ Links ]
30. Ogbe FO. Survey of cassava begomoviruses in Nigeria and the response of resistant cassava genotypes to African cassava mosaic begomovirus infection [PhD thesis]. Ibadan: University of Ibadan; 2001. [ Links ]
31. Thresh JM, Cooter RJ. Strategies for controlling cassava mosaic virus disease in Africa. Plant Pathol. 2005;54(5):587-614. https://doi.org/10.1111/j.1365-3059.2005.01282.x [ Links ]
32. Asare PA, Galyuon IK, Asare-Bediako E, Sarfo JK, Tetteh JP. Phenotypic and molecular screening of cassava (Manihot esculentum Crantz) genotypes for resistance to cassava mosaic disease. J Gen Mol Virol. 2014;6(2):6-18. https://doi.org/10.5897/JGMV2014.0056 [ Links ]
33. Acquaah G. Principles of plant genetics and breeding. Chichester: John Wiley & Sons; 2009. p. 367-383. https://gtu.ge/Agro-Lib/Principles%20of%20Plant%20Genetics%20and%20Breeding.pdf [ Links ]
 Correspondence:
Bunmi Olasanmi
Email: bunminadeco@yahoo.com
Received: 29 June 2021
Revised: 11 Sep. 2021
Accepted: 13 Sep. 2021
Published: 27 Jan. 2022
EDITOR: Teresa Coutinho
FUNDING: African Union Commission
Supplementary Data
The supplementary data is available in pdf: [Supplementary data]

