


Servicios Personalizados
Articulo
 Inglés (pdf)
 Articulo en XML
 Referencias del artículo
Indicadores

Links relacionados
-
 Citado por Google
 -
 Similares en Google
Compartir

 Permalink
South African Journal of Science
versión On-line ISSN 1996-7489
versión impresa ISSN 0038-2353
S. Afr. j. sci. vol.118 no.1-2 Pretoria ene./feb. 2022
http://dx.doi.org/10.17159/sajs.2022/11913
SCIENTIFIC CORRESPONDENCE
Morphometric ('log sem') analysis of anatomical measurements of Galápagos finches (Geospiza), chimpanzees (Pan) and Plio-Pleistocene hominins (Paranthropus, Australopithecus and early Homo)
J. Francis Thackeray
Evolutionary Studies Institute, University of the Witwatersrand, Johannesburg, South Africa
ABSTRACT
Significance:
• The 'log sem' morphometric method can be shown to be justified in the context of its use in the analysis of anatomical measurements of three sets of data: Galápagos finches (six species of Geospiza); two species of chimpanzees (Pan troglodytes and P. paniscus); and three hominin genera (Australopithecus, Paranthropus and early Homo).
Keywords: morphometrics, Galápagos, Darwin, Finch, chimpanzee, Pan, hominin, Plio-Pleistocene
A morphometric method has been used in analyses of linear measurements obtained from crania of modern hominoids1-3 as well as Plio-Pleistocene hominins,1,4,5 based on pairwise comparisons associated with least squares linear regression to quantify the degree of scatter around a regression line of the form y= mx+c, where m is the slope and c is the intercept. The log-transformed standard error of the m-coefficient, known as 'log sem', serves to quantify the degree of scatter around the regression line, associated with the degree of variability in shape. The effect of size is associated with the m-coefficient.
For many taxa, a mean log sem value of -1.61 has been recognised as a typical degree of intraspecific morphological variation in extant species.2,3 With a standard deviation of 0.1, it has been used as a frame of reference for assessing probabilities of conspecificity when pairs of specimens are compared (e.g. Thackeray and Dykes3 and Thackeray4).
In this analysis, the results of an UPGMA (unweighted pair group method with arithmetic mean) cluster analysis were obtained from log sem statistics calculated from anatomical measurements from the following three sets of data as examples of method: Galápagos finches (Geospiza), chimpanzees (Pan troglodytes and P. paniscus), and Plio-Pleistocene hominins (Australopithecus africanus, A. sediba, Homo habilis, H. erectus, H. rudolfensis and H. naledi). The objective was to demonstrate that the log sem statistic has biological significance, reflecting variability in shape in a diversity of taxa.
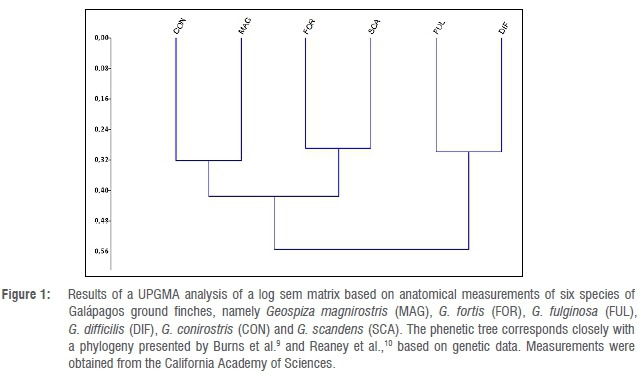
UPGMA tree for six species of Galápagos ground finches
Using UPGMA, a log sem matrix was analysed for the six generally accepted species of ground finches, namely Geospiza magnirostris, G. fortis, G. fulginosa, G. difficilis, G. conirostris and G. scandens.6,7The log sem matrix was based on measurements of the lengths of wing, tail, culmen, gonys, depth of bill at base, width of mandible at base, tarsus and middle toe with claw, from a database compiled by the California Academy of Sciences. Measurements were obtained from 36 specimens (an equal number of male and female specimens) resulting in more than 1200 regressions. A computer program for analysing large data sets (https://github.com/chdwck9/professorRegressor) was used to calculate log sem statistics.8
Figure 1 presents the resulting phenetic tree. This tree corresponds closely to a phylogeny obtained by Burns et al.9 and Reaney et al.10 based on genetic data.
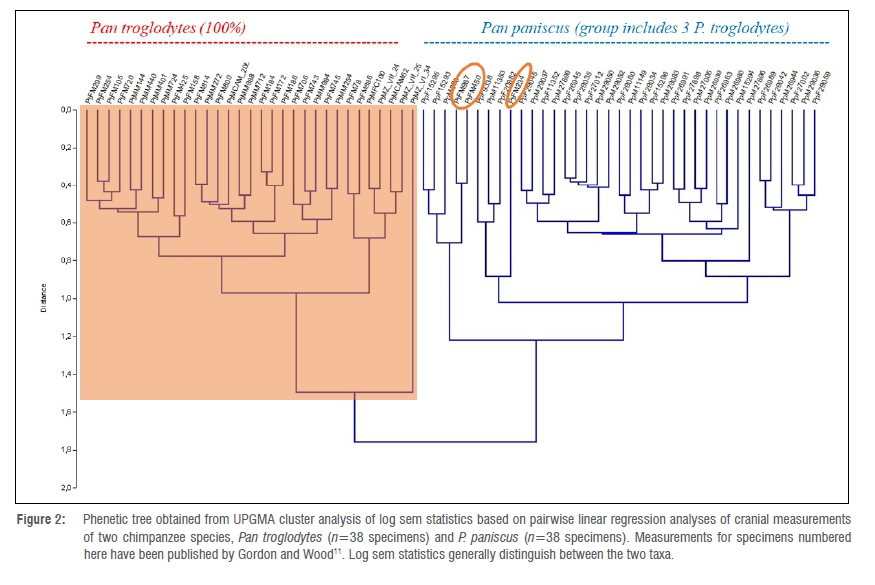
UPGMA tree for two chimpanzee species
Figure 2 presents a phenetic tree obtained from UPGMA cluster analysis of log sem statistics based on pairwise linear regression analyses of Pan troglodytes and P. paniscus cranial measurements (n=68 specimens, more than 4500 regressions), using measurements published as supplementary material by Gordon and Wood11. The log sem approach generally distinguishes the two taxa, reflecting robusticity of the log sem method. Although 3 out of 34 specimens attributed to P. troglodytes group with others attributed to the closely related P. paniscus, this lack of a clear boundary is consistent with genetic evidence of hybridisation between chimpanzees and bonobos within the last million years.12,13
UPGMA tree for Plio-Pleistocene hominin specimens
Figure 3 presents a phenetic tree obtained from UPGMA cluster analysis of log sem data of the kind published by Thackeray and Odes5, generated from pairwise comparisons of Plio-Pleistocene hominin specimens attributed to Australopithecus, early Homo and Paranthropus, using measurements published by Wood14, with the addition of log sem data associated with A. sediba15and H. naledi16.
Specimens attributed to A. africanus (Sts 71 and Sts 5) from South Africa and specimens attributed to H. habilis (KNM-ER 1813 and OH 24) from East Africa form a group, consistent with the view that these are closely related. A log sem value of -1.51 calculated from a comparison between OH 24 and Sts 5, combined with a so-called delta log sem3 value of only 0.003, points to a relatively high probability of conspecificity, despite the fact that OH 24 from Olduvai Gorge in Tanzania has generally been attributed to H. habilis whereas Sts 5 ('Mrs Ples' from Sterkfontein in South Africa) is accepted as a specimen representing A. africanus. Wood and Collard17 proposed that H. habilis should instead be considered as A. habilis. Thackeray18 suggested that the transition between A. africanus and H. habilis may constitute a chronospecies.
Robust australopithecines (Paranthropus), including specimens SK 48, OH 5, KNM-ER 406 and KNM-ER 732, are separated as a group distinct from specimens attributed to A. africanus and others attributed to Homo, including H. ergaster (KNM-ER 3733) and H. rudolfensis (KNM-ER 1470). MH 1 (A. sediba, described by Berger et al.15 as a 'Homolike australopith') groups with specimens attributed to Homo. Despite differences in age, LES 1 (H. naledi) groups with H. ergaster.
Conclusion
The three UPGMA analyses of log sem data, calculated for Galapagos finches (Geospiza), chimpanzees (Pan) and Plio-Pleistocene hominins (Paranthropus, Australopithecus and early Homo) reflect groups that have biological significance, serving at the same time to demonstrate that the log sem morphometric method has merit, based on anatomical measurements using landmarks.
Acknowledgements
This research was supported by the National Research Foundation (South Africa). I am grateful to the late Sue Dykes, Richard Dykes, Caitlin Schrein and Julien Benoit for their roles in the use of the log sem morphometric method. Anatomical measurements of Darwin's finches used in this study are from collections of Geospiza in the California Academy of Sciences, with the assistance of Moe Flannery. I thank Peter and Rosemary Grant, Arkhat Abzanhov, Ashley Reaney, Jack Dumbacher, Bob Zink, Tim Crowe, Marine Cazenave, Clément Zanolli, Peter Knox-Shaw and an anonymous reader for comments and encouragement in relation to this study. I dedicate this paper to Sue Dykes.
References
1. Thackeray JF, Bellamy CL, Bellars D, Bronner G, Bronner L, Chimimba C, et al. Probabilities of conspecificity: Application of a morphometric technique to modern taxa and fossil specimens attributed to Australopithecus and Homo. S Afr J Sci. 1997;93:195-196. [ Links ]
2. Thackeray JF. Approximation of a biological species constant? S Afr J Sci. 2007;103:489. [ Links ]
3. Thackeray JF, Dykes S. Morphometric analyses of hominoid crania, probabilities of conspecificity and an approximation of a biological species constant. HOMO J Comp Hum Biol. 2016;67(1):1-10. http://doi:10.1016/j.jchb.2015.09.003 [ Links ]
4. Thackeray JF. Alpha and sigma taxonomy of Pan (chimpanzees) and Plio-Pleistocene hominin species. S Afr J Sci. 2018;114(11/12), Art. #a0291. https://doi.org/10.17159/sajs.2018/a0291 [ Links ]
5. Thackeray JF, Odes E. Morphometric analysis of early Pleistocene African hominin crania in the context of a statistical (probabilistic) definition of a species. Antiquity. 2013;87. http://antiquity.ac.uk/projgall/thackeray335/ [ Links ]
6. Grant PR, Grant BR. How and why species multiply: The radiation of Darwin's finches. Princeton, NJ: Princeton University Press; 2008. https://doi.org/10.1515/9781400837946 [ Links ]
7. Grant PR, Grant BR. 40 years of evolution: Darwin's finches on Daphne Major Island. Princeton, NJ: Princeton University Press; 2014. https://doi.org/10.1515/9781400851300 [ Links ]
8. Dykes SJ, Dykes RD. 'Professor Regressor': A computer programme for rapid processing of large sets of data for pairwise regression analyses in palaeontological contexts. Palaeontol Afr. 2015;49:53-59. https://wiredspace.wits.ac.za/handle/10539/17371 [ Links ]
9. Burns KJ, Shultz AJ, Title PO, Mason NA, Barker FK, Klicka J, et al. Phylogenetics and diversification of tanagers (Passeriformes: Thraupidae), the largest radiation of Neotropical songbirds. Mol Phylogenet Evol. 2014;75:41-77. https://doi.org/10.1016/j.ympev.2014.02.006 [ Links ]
10. Reaney AM, Bouchenak-Khelladi Y Tobias JA, Abzhanov A. Ecological and morphological determinants of evolutionary diversification in Darwin's finches and their relatives. Ecol Evol. 2020;10(24):14020-14032. https://doi.org/10.1002/ece3.6994 [ Links ]
11. Gordon AD, Wood BA. Evaluating the use of pairwise dissimilarity metrics in paleoanthropology. J Hum Evol. 2013;65:465-177. https://doi.org/10.1016/j.jhevol.2013.08.002 [ Links ]
12. De Manuel M, Kuhlwilm M, Frandsen P Sousa VC, Desai T, Prado-Martinez J, et al. Chimpanzee genomic diversity reveals ancient admixture with bonobos. Science. 2016;354(6311):477-481. https://doi.org/10.1126/science.aag2602 [ Links ]
13. Thackeray JF, Schrein CM. A probabilistic definition of a species, fuzzy boundaries and 'sigma taxonomy'. S Afr J Sci 2017;113(5/6), Art. #a0206. https://doi.org/10.17159/sajs.2017/a0206 [ Links ]
14. Wood BA. Koobi Fora Research Project. Volume 4: Hominid cranial remains. Oxford: Clarendon Press; 1991. [ Links ]
15. Berger LR, De Ruiter DJ, Churchill SE, Schmid P Carlson KJ, Dirks PHGM, et al. Australopithecus sediba: A new species of Homo-like australopith from South Africa. Science. 2010;328:195-204. https://doi.org/10.1126/science.1184944 [ Links ]
16. Berger LR, Hawks J, De Ruiter DJ, Churchill SE, Schmid P Delezene LK, et al. Homo naledi, a new species of the genus Homo from the Dinaledi Chamber, South Africa. eLife. 2015;4, e09560, 35 pages. https://elifesciences.org/articles/09560 [ Links ]
17. Wood BA, Collard M. The changing face of the genus Homo. Evol Anthropol. 1999;8:195-207. https://doi.org/10.1002/(SICI)1520-6505(1999)8:6<195::AID-EVAN1>3.0.CO;2-2 [ Links ]
18. Thackeray JF. Homo habilis and Australopithecus africanus, in the context of a chronospecies and climatic change. In: Runge R, editor. Changing climates, ecosystems and environments within arid southern Africa and adjoining regions. Palaeoecology of Africa 33. Leiden: CRC Press; 2015. p. 53-58. [ Links ]
 Correspondence:
Francis Thackeray
Email: mrsples@global.co.za
PUBLISHED: 27 January 2022

