


Servicios Personalizados
Articulo
 Inglés (pdf)
 Articulo en XML
 Referencias del artículo
Indicadores

Links relacionados
-
 Citado por Google
 -
 Similares en Google
Compartir

 Permalink
South African Journal of Science
versión On-line ISSN 1996-7489
versión impresa ISSN 0038-2353
S. Afr. j. sci. vol.117 no.11-12 Pretoria nov./dic. 2021
http://dx.doi.org/10.17159/sajs.2021/7852
RESEARCH ARTICLE
Temperature and relative humidity trends in the northernmost region of South Africa, 1950-2016
Njongenhle M.B. NyoniI, II; Stefan GrabI; Emma ArcherIII; Johan MalherbeIV, V
ISchool of Geography, Archaeology and Environmental Studies, University of the Witwatersrand, Johannesburg, South Africa
IIFood, Agriculture and Natural Resources Policy Analysis Network (FANRPAN), Pretoria, South Africa
IIIDepartment of Geography, Geoinformatics and Meteorology, University of Pretoria, Pretoria, South Africa
IVSoil, Climate and Water - Agricultural Research Council, Pretoria, South Africa
VSmart Places, Council for Scientific and Industrial Research (CSIR), Johannesburg, South Africa
ABSTRACT
The northernmost Limpopo Province is located in one of the warmest regions of South Africa, where the agricultural sector is prone to heat stress. The aim of this study was to explore air temperature and relative humidity trends for the region, which have implications for agricultural adaptation and management (amongst other sectors). In particular, we investigated seasonal, annual and decadal scale air temperature and relative humidity changes for the period 1950-2016. Positive temperature trends were recorded for this period, averaging +0.02 °C/year, with the strongest changes observed in mean maximum summer temperatures (+0.03 °C/year). Interannual temperature variability also increased over time, especially for the period 2010-2016, which presents probability densities of <50% for minimum temperatures. Positive relative humidity trends (+0.06%/year) were also recorded for the period 19802016, but proved to be the least predictable weather parameter, with probability densities of <0.5% across seasons for the study period. Considering the substantial interannual variability in temperature and relative humidity, there is clear increased risk for the agricultural sector, particularly for small-scale farmers who generally have limited capacity to adapt. Climate science focusing on the southern African region should continue to establish the impact of climate change and variability on specific small-scale farming systems and enterprises, with recommendations for strategic adaptation based on up-to-date evidence.
SIGNIFICANCE:
• Heat indices have increased, and variability in temperature and relative humidity has substantially increased over recent decades.
• Changes in air temperature and relative humidity have direct and/or indirect negative effects on sectors such as agriculture, leading to reduced productivity.
• The small-scale farming sector, which contributes significantly to national food security in developing countries, is the production system most exposed and vulnerable to observed changes/extremes in temperature and relative humidity.
• There is an urgent need to build capacity of small-scale farmers for appropriate adaptation to observed changes in climate based on up-to-date evidence.
Keywords: agriculture, climate change, temperature, humidity, northernmost South Africa
Introduction
Globally, mean air temperatures have increased by at least 0.65 °C over the past century, while extreme rainfall events have also increased in frequency.1-3 It is widely projected that as the earth becomes warmer, climate and weather variability will increase.4-7 Projected temperatures for southern Africa indicate expected near-future increases at twice the global average.8 Such changes in climate present a significant threat to food security, water resources, health and infrastructure.2 Low-income countries are likely to be the most vulnerable to extreme climatic events due to their poor adaptive capacity in terms of finances, resources, infrastructure and expertise.9 In particular, the small-scale farming sector, which contributes significantly to national food security in developing countries, is an exposed and vulnerable production system.10 The situation is compounded in cases where there are limited reliable historical climate data available to establish climatic trends - a concern that holds true for most African countries.
In order to develop a sustainable adaptive capacity for target regions, and address current and future challenges presented by climate variability and/or change, it is critical to evaluate historical climate trends.10 Process-based regional and global climate models generally have the ability to replicate large-scale climate features. However, their coarseness in spatial resolution poses challenges in providing usable information at local scales.11,12 Region-specific historically observed climatic records, where possible, have the potential to assist ongoing climate modelling and projections, and to establish the likely impact of climate change on agricultural productivity and ultimately food security.
Several studies on historical weather and climate change have been focused at the countrywide level in South Africa12-14, while others have been more region specific, with finer spatial detail14-18. For example, the study by Gbetibouo15 on the Limpopo Basin area in northernmost South Africa provides some information on climate trends in the region. It should be noted that the study mainly focused on farmers' perceptions and adaptation to climate change and variability, rather than a detailed analysis on climate trends. A further study focused on 30 Limpopo Province catchments, analysing temperature trends for the period 1950-199916, and established increases in annual and seasonal temperature. However, this study did not include relative humidity, and hence was unable to establish heat indices. In the context of agricultural and human/animal thermal comfort levels, a combination of these two weather parameters (i.e. temperature and relative humidity) is important for establishing heat indices - effectively a measure of how hot it feels. Understanding of heat indices is particularly important for most resource-limited rural communities in Limpopo Province and other rural sectors of southern Africa involved in smallholder farming enterprises, many of which may already be adversely affected by extreme weather events. Evidence shows that increases in heat index trends will have far-reaching impacts on agricultural production and productivity, especially in poor communities with constrained adaptive capacity.19,20 We thus aimed to provide an improved understanding of recent temperature and relative humidity trends in the northernmost region of the Limpopo Province, which has implications for determining heat stress. The particular focus here was on analysing seasonal and annual temperature and relative humidity trends for the period 1950-2016, and hence the computation of heat indices.
Materials and methods
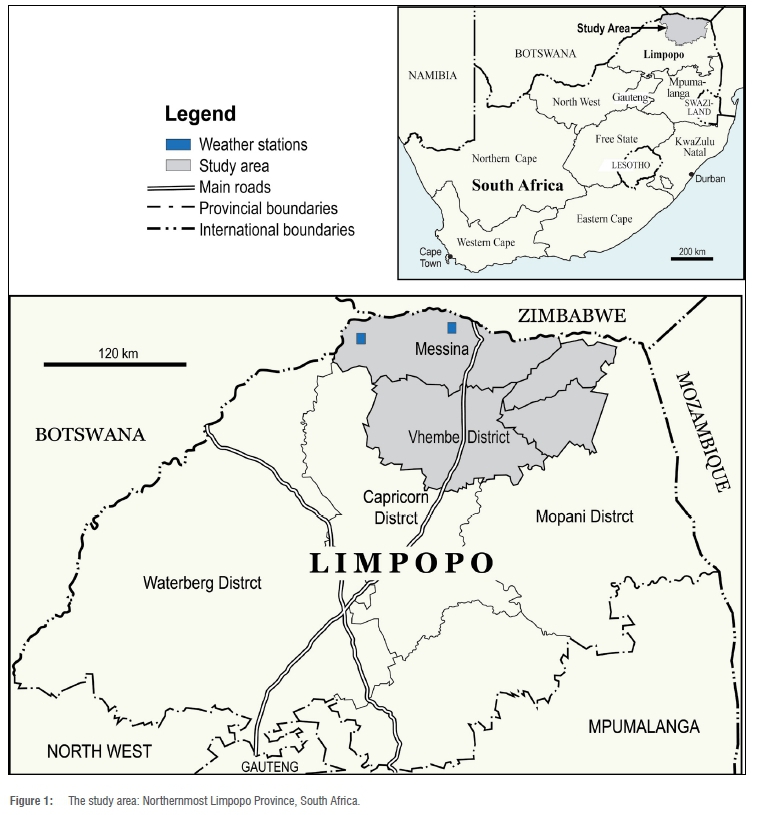
Study area
This study focused on the northern border region of the Limpopo Province, South Africa (Figure 1). The region is located in the Vhembe District Municipality, where a large portion of its rural population resides. This semi-arid region is located in one of the warmest parts of South Africa where temperatures regularly exceed 40 °C during the warm season.21 Mean daily maximum temperatures during summer also exceed 30 °C, and precipitation averages only ~250 mm p.a., most of which falls during summer.21 Such climatic conditions (particularly high temperatures) regularly cause heat stress, especially in the livestock sector, thereby reducing potential productivity.22 The Limpopo Province is one of the economically and financially poorest provinces in the country, with livelihoods in most rural villages depending on subsistence farming and casual employment. Government grants and remittances from off-site relatives contribute significantly to household incomes. Smallholder farmers produce crops and rear some livestock.
Data collection
Daily temperature (1950-2016) and relative humidity (1980-2016) data for two weather stations (Macuville: data period = 1950-2014; Venetia Mine: data period = 2015-2016) in northernmost Limpopo Province were provided by the South African Weather Service. Temperature and humidity values are variable across any given landscape due to topography, land cover and external climatic inputs (e.g. airflow from surrounding regions). The values we present here are thus in absolute terms, only relevant to the station localities, and for the broader region serve as a more general (relative) indication of conditions, rather than absolute conditions for any given site in the province. Information was collated monthly and seasonally. Traditional seasons in South Africa are divided into summer (December - February), autumn (March - May), winter (June - August), and spring (September - November).4 For ease of analysis, temperature data were further divided into two periods: 1950-1986 and 1980-2016.
Data were assessed to identify missing and incorrectly reported or recorded values (e.g. daily minimum temperature greater than the daily maximum temperature). Missing and/or incorrect values were then replaced using temporal interpolation techniques (hierarchical polynomial regression techniques, in particular) as described by Boissonnade et al.23 Missing values were replaced through interpolations between observations over time (temporal interpolation). In addition, change points were identified24 and homogenised using the quantile-matching adjustment method25. Using the quantile-matching method, up to 10 years' of data, before or after a change point, were used to produce reliable adjustments.24,25 For relative humidity, zero drift in sensors was assumed.
Data analyses
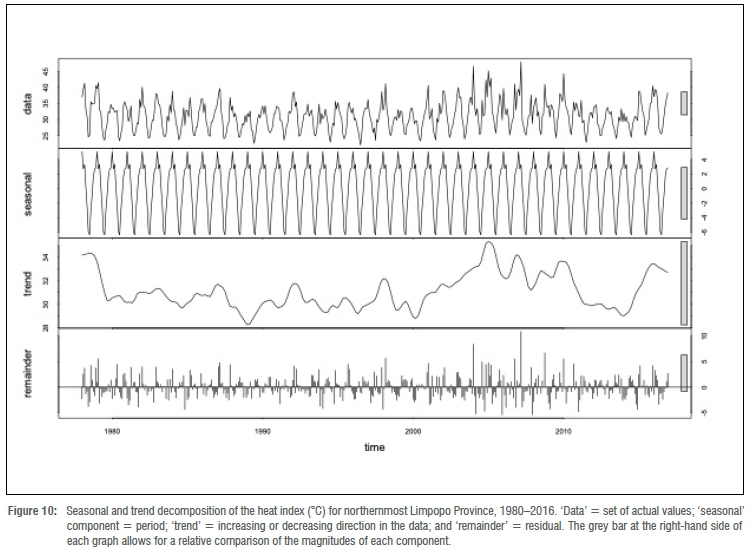
Temperature and relative humidity trends were determined using R software packages (lubridate and forecast)26,27 with seasonal and trend decomposition using the locally weighted smoothing (LOESS) (STL) function. LOESS was used in regression analysis for creating a smooth line through a timeplot, thus demonstrating the relationship between variables and forecast trends. Graphs plotted from STL show four components: (1) the original data (i.e. a set of actual values); (2) a seasonal component calculated using LOESS smoothing; (3) the trend (i.e. increasing or decreasing direction in the data); and (4) the remainder representing the residual.
The total number, amplitude and intensity of heatwave days were calculated for each year. Threshold values for a heatwave were based on the average maximum temperature of the hottest month of a given year plus 5 °C, as described by Mbokodo et al.28 The totals per year were only for heatwave days, where the maximum temperatures exceeded the threshold for three or more successive days, thus guaranteeing that heatwave events with a shorter duration were also detected. It is worth noting, however, that this heatwave computation ignores extremes associated with cooler months and changes in adaptation-related impacts.
Probability density plots, calculated using R software package ggplot229, were tested for significance at the 95% confidence level, and used to establish variability of temperature and relative humidity across the seasons and decades under study. Density plots provide a relative likelihood of these random variables falling within a particular range of values. The heat index (incorporating air temperature and relative humidity) was calculated using weathermetrics30. Maximum daily air temperatures and minimum relative humidity were used to determine the heat index. Weathermetrics' heat.index creates a numeric vector of heat index values from numeric vectors of air temperature and either relative humidity or dew point temperature. In calculating the heat index in R using the weathermetrics package, the following code was used:
heat.index (t = NA, dp = c(), rh = c(), temperature.metric = 'celsius', output.metric = celsius),
where t is numeric vector of air temperatures; rh is numeric vector of relative humidity (in %); temperature.metric is the character string indicating the temperature metric of air temperature and dew point temperature (possible values are 'celsius'); and output.metric is the character string indicating the metric into which heat index should be calculated (possible values are 'celsius').
Weathermetrics calculations for heat index are based on the National Weather Service Hydrometeorological Prediction Center Web Team Heat Index Calculator.31 Results from weathermetrics were validated by the RClimdex version 1.932 software calculations on warm days (TX90p) and warm spell duration indicator (WSDI). TX90p shows the percentage of days when maximum temperature (TX) is greater than the 90th percentile centred on a 5-day window, while WSDI highlights the annual count of days with at least 6 consecutive days when TX is greater than the 90th percentile.
Results
Temperature trends
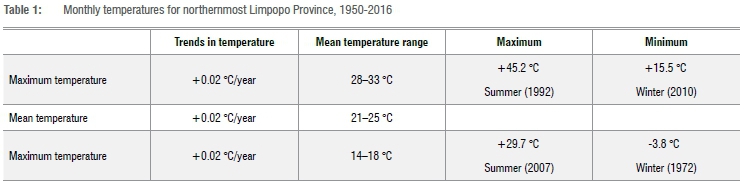
Time series graphs show positive trends in temperature, with averages marked for each month over the 1950-2016 period (see Figures 2-4). Rates of minimum, mean and maximum temperature increases were similar (+0.02 °C/year) for the study period. However, summer maximum temperatures recorded the highest rate of increase (+0.03 °C/ year) compared to other seasons and other temperature parameters (i.e. average and minimum). Seasonal and trend decomposition of temperatures show that mean maximum temperatures ranged between 28 °C and 33 °C (see Supplementary figure 1), average temperatures ranged from 21 °C to 25 °C (see Supplementary figure 2), and mean minimum temperatures from 14 °C to 18 °C (see Supplementary figure 3). The absolute highest and lowest recorded temperatures were during the summer of 1992 (45.2 °C) and winter of 1972 (-3.8 °C), respectively (see Table 1).
Strongest positive warming trends are observed for the past three and a half decades (i.e. from 1980-2016). For instance, mean annual maximum temperatures increased at a rate of +0.02 °C/year between 1950 and 1986, but substantially increased to +0.03 °C/year for the period 1980-2016.
The rate at which mean annual temperatures have increased, has remained similar over time: 0.02 °C/year over the period 1980-2016, compared to 0.02 °C/year for the period 1950-1986. None of the warming trends (i.e. for the periods 1950-2016, 1950-1986 or 19802016) were statistically significant at the 95% confidence level.
Heatwave trends
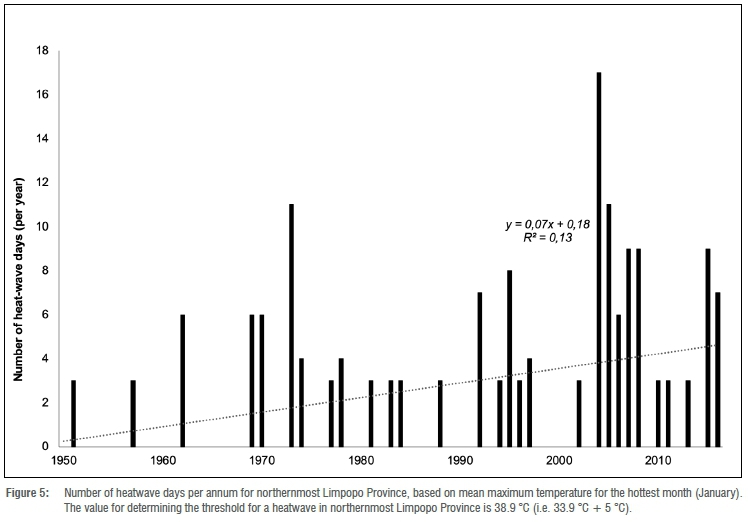
The value for determining the threshold for a heatwave in northernmost Limpopo Province was 38.9 °C (i.e. 33.9 °C + 5 °C). All heatwaves occurred during the summer season. The rate of increase in the number of heatwave occurrences per annum is +0.07 days/year for the study period (see Figure 5). The frequency of heatwaves for the period 19501986 was ~1.5/year, which then increased substantially to ~3.1/year for the period 1980-2016. Further, the mean duration of heatwaves increased during the last three decades (mean = 5.9 days) over that of the previous decades (mean = 4.6 days).
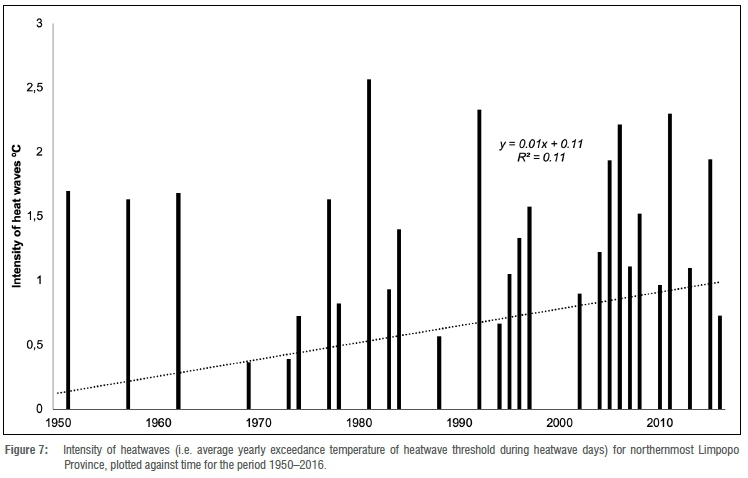
The annual heatwave amplitude (1950-2016) during periods associated with a heatwave in northernmost Limpopo Province is presented in Figure 6. The lowest (40.1 °C) heatwave amplitude was recorded in December of 1988, while the highest (45.2 °C) was in December of 1992. Generally, heatwave amplitude increased significantly (p=0.04) over the study period. The intensity of heatwaves (i.e. average temperature with which the heatwave threshold was exceeded per year, taking all heatwaves for that year into account [see Figure 7]) also increased significantly (p=0.04) over the period 1950-2016. Table 2 shows heatwave trends in terms of change in heatwave amplitude and intensity of heatwaves.

Relative humidity trends
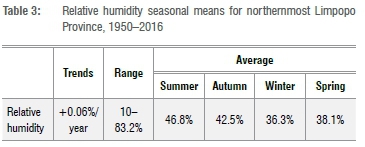
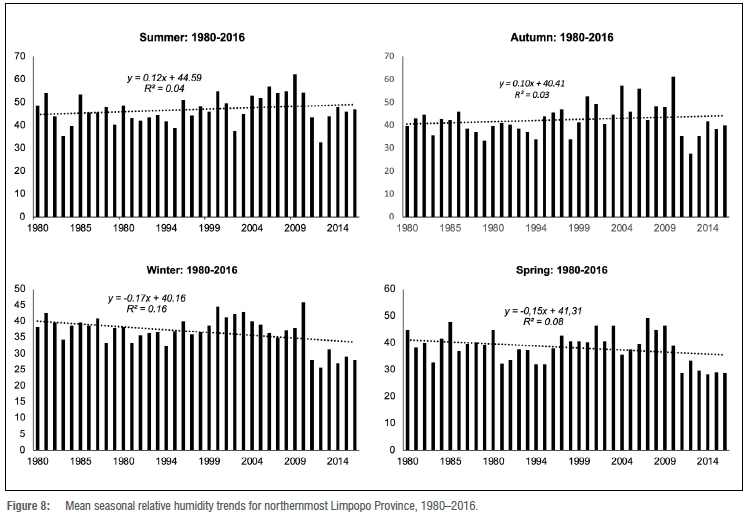
Results show a positive relative humidity trend (+0.06%/year), albeit not statistically significant (p=0.3) for the period 1980-2016, with mean seasonal relative humidity ranging between 10% during winter (July) of 1980, and 83.2% during autumn (April) of 2012. Generally, summers had the highest relative humidity (mean = 46.8%) and winters the lowest (mean = 36.3%) (Table 3). Seasonal relative humidity increased during summer (+0.12%/year) and autumn (+0.10%/year), and decreased during winter (-0.17%/year) and autumn (-0.15%/year) (Figure 8).
Variability in temperature and relative humidity
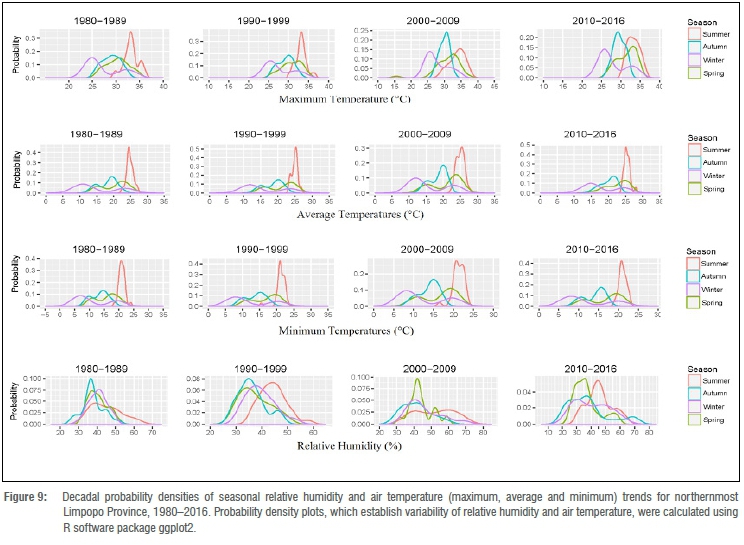
Weather parameters across all seasons had low probability densities (below 50%), implying high variability (Figure 9). Highest probability densities of maximum temperature were observed for summer over the periods 1980-1989 and 1990-1999, and in autumn over the periods 2000-2009 and 2010-2016. Winter probability densities were lowest over the entire study period, except for the period 2000-2010, when spring recorded the lowest (~12%). The highest (~37%) summer probability densities were recorded for the period 1990-1999, and lowest (15%) over the period 2000-2009. For winter, however, maximum temperature probability densities were consistently at ~15% throughout the study period, indicating high variability.
For average temperatures, the highest and lowest probability densities were recorded for summer and winter respectively, throughout the study period. Highest summer (~52%) probability densities were recorded during the period 1990-1999 and lowest (~30%) during 2000-2009. As with maximum temperatures, winter probability densities were consistently at ~10% for the period 1980-2016. Consistent with probability densities for average temperatures, minimum temperatures were always highest for summer and lowest for winter. Summer probability densities were highest (~41%) over the period 20102016, and lowest (~30%) during the period 2000-2019. Again, winter probability densities were consistently lowest at ~15% for the entire study period.
Probability densities of relative humidity across all seasons were always very low (i.e. less than 10%), with considerable inter-annual and decadal variability. The period 2010-2016 presented the highest variations, with probability densities of <0.5% for relative humidity. The highest probability densities (from highest to lowest) were recorded for the period 1980-1989 (autumn), 2000-2009 (spring), 1990-1999 (autumn) and 2010-2016 (spring). Conversely, the lowest probability densities (from lowest to highest) were recorded in winter (2010-2016), summer (2000-2009), summer (1980-1989) and spring (1990-1999), respectively.
Of the two variables (temperature and relative humidity), relative humidity was the least predictable weather variable across seasons for the study period. Mean summer temperatures across all decades were significantly (p=0.03) more predictable (~50%) than other temperature parameters during summer and other seasons. The only exceptions were predictions for autumn maximum temperatures over the years 2000-2009 and 2010-2016, both having probability densities of ~25%, a value which exceeded the summer percentages.
Heat index
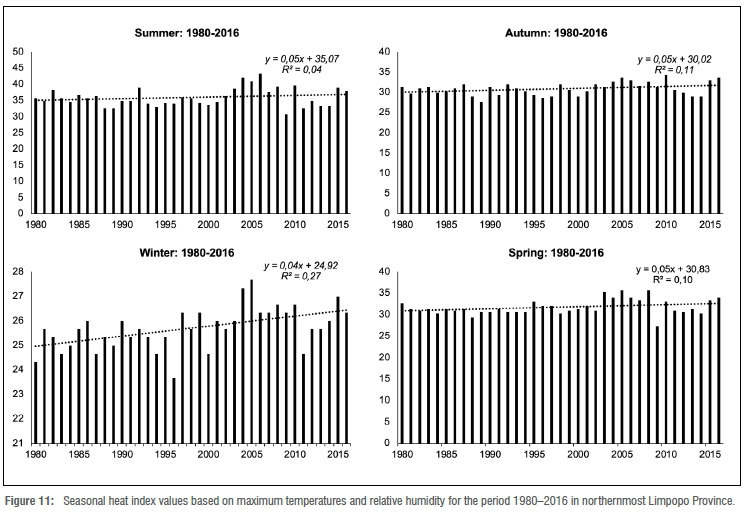
Heat index values (using R Package weathermetrics) were calculated for the period 1980-2016, based on available relative humidity and maximum temperature data. According to seasonal and trend decomposition time series (see Figure 10), the heat index ranged between 24 °C and 35 °C.
Highest heat index measurements were observed during the summer of 2007, and the lowest (+24 °C) during the winter of 1996.
Over the study period, positive trends were observed for all seasons (Figure 11) i.e. summer (+0.05 °C/year), autumn (+0.05 °C/year), winter (+0.04 °C/year) and spring (+0.05 °C/year). Overall, there has been a positive heat index trend (+0.05 °C/year). RClimdex calculations validating these results are provided in Supplementary figures 4 (TX90p) and 5 (WSDI).
Discussion
Our analysis shows that there has been a positive mean annual warming trend (+0.02 °C/year) for northernmost Limpopo Province over the period 1950-2016, which is in line with what other recent studies in the southern African region have reported.12,14,33,34 Temperature increases have also resulted in increased frequency, amplitude and intensity of heatwaves and a positive heat index trend (+0.03 °C/year). Climate studies from other southern African regions1,4,28,3537 have also reported increased frequency of heatwaves and hot days, associated with accelerated global warming. The primary concern with such climatic changes is that they significantly impact sectors such as agriculture and water resources, directly and/or indirectly, reducing productivity.37,38 Thus, the rapid increase in heatwave frequency and intensity over northernmost South Africa poses major concerns to agriculture in an already water-scarce environment, and even more so, given that evaporation rates and water consumption demands have increased.8,28 High temperatures, especially when combined with high humidity and low air movement, can exceed species-specific threshold levels (or thermal comfort zones), thereby causing heat stress.39 It is likely that farming systems in the northern border region of Limpopo Province are already adversely impacted by climate change, particularly so in small-scale subsistence settings where farmers have limited capacity to adapt. This is in line with findings from an earlier study in Limpopo Province, which established that, although farmers were able to recognise climate change, only a few employed some form of adaptation strategy.15
Increases in the frequency, occurrence, intensity and amplitude of heatwaves, as well as positive trends in the heat index (i.e. how hot it feels) have direct adverse effects on agriculture, especially livestock production. High temperatures cause heat stress in livestock.40 For instance, in poultry production, ambient temperatures above 30 °C are known to cause heat stress in chickens, resulting in reduced feed intake and body weight, and, in some cases, high mortality.4,41 This is a cause for concern in rural communities of northernmost Limpopo Province, which are resource limited, with low adaptive capacities. A recent study by Mbokodo et al.28 focusing on expected heatwaves in a future warmer South Africa, projects an increased frequency and duration of heatwaves. Such a scenario carries the likely consequence of significant adverse impacts on human health, economic activities (especially climate-sensitive farming) and livelihoods in vulnerable communities such as the northern border region of Limpopo Province.
Both minimum and maximum temperatures increased at a similar rate (+0.02 °C/year) over the study period - a finding inconsistent with previous studies in the region and elsewhere, which reported more rapid increases in maximum temperature compared to minimum temperatures.14,33,42,43 The observed rates of increase in minimum and maximum temperatures in northernmost Limpopo Province are inconsistent with several global warming reports, which have shown a decreasing diurnal temperature range due to minimum temperatures increasing at a faster rate than maximum temperatures.42-46 Diurnal temperature range is an important indicator of climate change, and is influenced by various spatial and temporal factors, including land-use / land-cover changes, irrigation, station moves, desertification, and a host of other indirect climatic effects.47 Thus, although global and regional perspectives on changes in the climate system are important, there are complex spatial variations, which necessitate local analysis of trends.
Simulated climate models (e.g. regional climate models and general circulation models) are often used for climate change projections. However, models may have limitations in determining local weather conditions.13,33 It is thus important to test and refine model reports using observed variations to ensure the accuracy of climate change projections. For instance, Jury13 analysed spatial and temporal historical climate observations in southern Africa to validate simulation models for projecting climate trends. Kruger et al.48 investigated historical trends in near-surface minimum and maximum temperatures, as well as extreme temperature indices in South Africa. This was achieved through critically comparing quality-controlled station observations with downscaled model projections, so as to provide valuable information concerning the interpretation of model-generated projections. Kruger et al.'s48 results demonstrate that model outputs tend to simulate the historical trends accurately for annual means of daily maximum and minimum temperatures, but have limitations when assessing temperature extremes. For correctly estimating the potential impact of climate change in a given region, particularly for sectors such as agriculture, it is necessary to reconcile climate observations and model projections.
Climate change research in remote rural areas such as the northern region of Limpopo Province should be ongoing, especially given that trends of concern seem to be increasing. Thus, climate change has an ever-changing impact on farming, especially on small-scale farming systems and enterprises in the region. Information on climatic trends, especially at local level, is important to help understand the likely impacts on farming productivity, and to inform appropriate strategic interventions to improve adaptation mechanisms.47 It is likely that temperatures in northernmost Limpopo Province are frequently surpassing livestock heat stress thresholds each year, ultimately compromising productivity, yet farmers continue with agricultural production without such insights. It is possible that the reported low productivity of rural poultry in the northern region of Limpopo Province may, in part, be a function of heat stress.41 Thus, access to climate information is essential to provide understanding of likely implications of climate change on agricultural production - something that needs to be effectively communicated to small-scale subsistence farmers for appropriate adaption.
Conclusion
Temperatures in northernmost Limpopo Province have steadily increased over the period 1950-2016. Consequently, heatwave frequency, intensity and amplitude have also increased. Further, temperatures and relative humidity have become more variable in recent decades. Of particular concern is the fact that, according to heat index trends, heat indices have increased. Such increases are likely to have adverse effects on sectors such as agriculture, especially in small-scale farming systems where farmers have limited adaptive capacities. To establish appropriate preparedness, an important starting point would be for future research to focus on establishing heat-stress tolerance thresholds for specific agricultural sectors in the northern border region of Limpopo Province.
Acknowledgements
We acknowledge the financial assistance from Open Society Foundation through the University of the Witwatersrand Global Change Institute as well as the weather data provided by the South African Weather Service.
Competing interests
We have no competing interests to declare.
Authors' contributions
N.M.B.N. was the principal researcher and main author of the manuscript. S.G. was the main supervisor of the research work and reviewed the manuscript. J.M. and E.A. co-supervised the research, analysed the data and reviewed the manuscript.
References
1. Stocker TF, Qin D, Plattner GK, Tignor M, Allen SK, Boschung J, et al. Summary for policymakers. In: Climate change 2013: The physical science basis: Contribution of Working Group I to the Fifth Assessment Report of the Intergovernmental Panel on Climate Change. Cambridge: Cambridge University Press; 2014. https://doi.org/10.1017/cbo9781107415324.004 [ Links ]
2. Ziervogel G, New M, Archer van Garderen E, Midgley G, Taylor A, Hamann R, et al. Climate change impacts and adaptation in South Africa. WIREs Clim Change. 2014;5(5):605-620. https://doi.org/10.1002/wcc.295 [ Links ]
3. Van Wilgen NJ, Goodall V Holness S, Chown SL, McGeoch MA. Rising temperatures and changing rainfall patterns in South Africa's national parks. Int J Climatol. 2016;36(2):706-721. https://doi.org/10.1002/joc.4377 [ Links ]
4. South African Department of Environmental Affairs. Long-Term Adaptation Scenarios Flagship Research Programme (LTAS) for South Africa. Climate trends and scenarios for South Africa [document on the Internet]. c2013 [cited 2017 Mar 04]. Available from: https://www.sanbi.org/sites/default/files/documents/documents/ltasclimate-trends-and-scenarios-tech-report2013low-res.pdf [ Links ]
5. Thornton PK, Ericksen PJ, Herrero M, Challinor AJ. Climate variability and vulnerability to climate change: A review. Glob Change Biol. 2014;20(11):3313-3328. https://doi.org/10.1111/gcb.12581 [ Links ]
6. Diallo I, Giorgi F, Sukumaran S, Stordal F, Giuliani G. Evaluation of RegCM4 driven by CAM4 over Southern Africa: Mean climatology, interannual variability and daily extremes of wet season temperature and precipitation. Theor Appl Climatol. 2015;121(3-4):749-766. https://doi.org/10.1007/s00704-014-1260-6 [ Links ]
7. Engelbrecht F, Adegoke J, Bopape MJ, Naidoo M, Garland R, Thatcher M, et al. Projections of rapidly rising surface temperatures over Africa under low mitigation. Environ Res Lett. 2015;10(8):1-16. https://doi.org/10.1088/1748-9326/10/8/085004 [ Links ]
8. Kusangaya S, Warburton ML, Archer van Garderen ERM, Jewitt GP. Impacts of climate change on water resources in southern Africa: A review. Phys Chem Earth. 2014;67-69:47-54. http://dx.doi.org/10.1016/j.pce.2013.09.014 [ Links ]
9. Keggenhoff I, Elizbarashvili M, King L. Recent changes in Georgia's temperature means and extremes: Annual and seasonal trends between 1961 and 2010. Weather Clim Extrem. 2015;8:34-45. https://doi.org/10.1016/j.wace.2014.11.002 [ Links ]
10. Hachigonta S, Nelson GC, Thomas TS, Sibanda LM, editors. Southern African agriculture and climate change: A comprehensive analysis. Washington DC: International Food Policy Research Institute; 2013. http://dx.doi.org/10.2499/9780896292086 [ Links ]
11. Tadross M, Jack C, Hewitson B. On RCM-based projections of change in southern African summer climate. Geophys Res Lett. 2005;32(23):1-4. https://doi.org/10.1029/2005gl024460 [ Links ]
12. MacKellar N, New M, Jack C. Observed and modelled trends in rainfall and temperature for South Africa: 1960-2010. S Afr J Sci. 2014;110(7-8), Art. #2013-0353. https://doi.org/10.1590/sajs.2014/20130353 [ Links ]
13. Jury MR. Climate trends in southern Africa. S Afr J Sci. 2013;109(1-2), Art. #980. http://dx.doi.org/10.1590/sajs.2013/980 [ Links ]
14. Kruger AC, Sekele SS. Trends in extreme temperature indices in South Africa: 1962-2009. Int J Climatol. 2013;33(3):661-676. https://doi.org/10.1002/joc.3455 [ Links ]
15. Gbetibouo GA. Understanding farmers' perceptions and adaptations to climate change and variability: The case of the Limpopo Basin, South Africa. Washington DC: International Food Policy Research Institute; 2009. https://www.ifpri.org/publication/understanding-farmers-perceptions-and-adaptations-climate-change-and-variability [ Links ]
16. Tshiala MF, Olwoch JM, Engelbrecht FA. Analysis of temperature trends over Limpopo province, South Africa. J Geog Geol. 2011;3(1):13. https://doi.org/10.5539/jgg.v3n1p13 [ Links ]
17. Kalumba AM, Olwoch JM, Van Aardt I, Botai OJ, Tsela P Nsubuga FW, et al. Trend analysis of climate variability over the West Bank-East London Area, South Africa (1975-2011). J Geog Geol. 2013;5(4):131. https://doi.org/10.5539/jgg.v5n4p131 [ Links ]
18. Lakhraj-Govender R, Grab S, Ndebele NE. A homogenized long-term temperature record for the Western Cape Province in South Africa: 19162013. Int J Climatol. 2017;37(5):2337-2353. https://doi.org/10.1002/joc.4849 [ Links ]
19. Archer van Garderen ER. (Re) considering cattle farming in southern Africa under a changing climate. Weather Clim Soc. 2011;3(4):249-253. https://doi.org/10.1175/wcas-d-11-00026.1 [ Links ]
20. Shisanya S, Mafongoya P. Adaptation to climate change and the impacts on household food security among rural farmers in uMzinyathi District of Kwazulu-Natal, South Africa. Food Secur. 2016;8(3):597-608. https://doi.org/10.1007/s12571-016-0569-7 [ Links ]
21. Makhado R, Potgieter M, Luus-Powell W, Cooper S, Oppong C, Kopij G, et al. Tragelaphus strepsiceros browse during the dry season in the mopani veld of Limpopo Province, South Africa. Trans R Soc S Afr. 2016;71(1):17-21. https://doi.org/10.1080/0035919x.2015.1102174 [ Links ]
22. Tankson JD, Vizzier-Thaxton Y, Thaxton JP, May JD, Cameron JA. Stress and nutritional quality of broilers. Poult Sci J. 2001;80:1384-1389. https://doi.org/10.1093/ps/80.9.1384 [ Links ]
23. Boissonnade AC, Heitkemper LJ, Whitehead D. Weather data: Cleaning and enhancement. In: Dischel RS. Climate risk and the weather market: Financial risk management with weather hedges. London: Risk Books; 2002. p. 73-93. Available from: http://citeseerx.ist.psu.edu/viewdoc/download?doi=10.1.1.527.2282&rep=rep1&type=pdf [ Links ]
24. Vincent LA, Wang XL, Milewska EJ, Wan H, Yang F, Swail V. A second generation of homogenized Canadian monthly surface air temperature for climate trend analysis. J Geophys Res Atmos. 2012;117(D18):1-13. https://doi.org/10.1029/2012jd017859 [ Links ]
25. Wang XL, Feng Y, Vincent LA. Observed changes in one-in-20-year extremes of Canadian surface air temperatures. Atmos Ocean. 2014;52(3):222-231. https://doi.org/10.1080/07055900.2013.818526 [ Links ]
26. Spinu V, Grolemund G, Wickham H. lubridate: Make dealing with dates a little easier. R package version 1.7.4; 2018. [ Links ]
27. Hyndman RJ, Athanasopoulos G, Bergmeir C, Caceres G, Chhay L, O'Hara-Wild M, et al. Package 'forecast'; 2020. Available from: https://cran.r-project.org/web/packages/forecast/forecast.pdf [ Links ]
28. Mbokodo I, Bopape MJ, Chikoore H, Engelbrecht F, Nethengwe N. Heatwaves in the future warmer climate of South Africa. Atmosphere. 2020;11(7):712. https://doi.org/10.3390/atmos11070712 [ Links ]
29. Wickham H. ggplot2. WIREs Comp Stat. 2011;3(2):180-185. https://doi.org/10.1002/wics.147 [ Links ]
30. Anderson GB, Peng RD. weathermetrics: Functions to convert between weather metrics (R package). Version 1.2.2. 2016. [ Links ]
31. National Weather Service Hydrometeorological Prediction Center Web Team. Heat Index Calculator; 2015. Available from: https://www.wpc.ncep.noaa.gov/html/heatindex.shtml [ Links ]
32. Zhang X, Feng Y Chan R. Introduction to RClimDex v1.9. Environment Canada; 2018. Available from: https://usermanual.wiki/Document/manual.2056401896/view [ Links ]
33. Davis CL, Hoffman MT, Roberts W. Recent trends in the climate of Namaqualand, a megadiverse arid region of South Africa. S Afr J Sci. 2016;112(3-4), Art. #2015-0217. https://doi.org/10.17159/sajs.2016/20150217 [ Links ]
34. Kruger AC, Nxumalo M. Surface temperature trends from homogenized time series in South Africa: 1931-2015. Int J Climatol. 2017;37(5):2364-2377. https://doi.org/10.1002/joc.4851 [ Links ]
35. Huth R, Kyselý J, Pokorná L. A GCM simulation of heat waves, dry spells, and their relationships to circulation. Clim Change. 2000;46(1-2):29-60. https://doi.org/10.1023/a:1005633925903 [ Links ]
36. Meehl GA, Tebaldi C. More intense, more frequent, and longer lasting heat waves in the 21st century. Science. 2004;305(5686):994-997. https://doi.org/10.1126/science.1098704 [ Links ]
37. Schlenker W, Roberts MJ. Nonlinear temperature effects indicate severe damages to US crop yields under climate change. Proc Natl Acad Sci USA. 2009;106(37):1594-1598. https://doi.org/10.1073/pnas.0906865106 [ Links ]
38. Van der Velde M, Tubiello FN, Vrieling A, Bouraoui F. Impacts of extreme weather on wheat and maize in France: Evaluating regional crop simulations against observed data. Clim Change. 2012;113(3-4):751-765. https://doi.org/10.1007/s10584-011-0368-2 [ Links ]
39. Lefcourt AM, Adams WR. Radiotelemetry measurement of body temperatures of feedlot steers during summer. J Anim Sci. 1996;74(11):2633-2640. https://doi.org/10.2527/1996.74112633x [ Links ]
40. Thornton PK, Van de Steeg J, Notenbaert A, Herrero M. The impacts of climate change on livestock and livestock systems in developing countries: A review of what we know and what we need to know. Agric Syst. 2009;101(3):113-127. https://doi.org/10.1016/j.agsy.2009.05.002 [ Links ]
41. Nyoni NMB, Grab S, Archer ER. Heat stress and chickens: climate risk effects on rural poultry farming in low-income countries. Clim Dev. 2019;11(1):83-90. https://doi.org/10.1080/17565529.2018.1442792 [ Links ]
42. Easterling DR, Horton B, Jones PD, Peterson TC, Karl TR, Parker DE, et al. Maximum and minimum temperature trends for the globe. Science. 1997;277(5324):364-367. https://doi.org/10.1126/science.277.5324.364 [ Links ]
43. New M, Hewitson B, Stephenson DB, Tsiga A, Kruger A, Manhique A, et al. Evidence of trends in daily climate extremes over southern and west Africa. J Geophys Res Atmos. 2006;111(D14):1-11. https://doi.org/10.1029/2005jd006289 [ Links ]
44. Karl TR, Jones PD, Knight RW, Kukla G, Plummer N, Razuvayev V et al. A new perspective on recent global warming: Asymmetric trends of daily maximum and minimum temperature. Bull Am Meteor Soc. 1993;74(6):1007-1024. https://doi.org/10.1175/1520-0477(1993)074<1007:anporg>2.0.co;2 [ Links ]
45. Liu B, Xu M, Henderson M, Qi Y Li Y Taking China's temperature: Daily range, warming trends, and regional variations, 1955-2000. J Clim. 2004;17(22):4453-4462. https://doi.org/10.1175/3230.1 [ Links ]
46. Blunden J, Arndt DS. State of the climate in 2011. Warming: Asymmetric trends of daily maximum and minimum temperature. Bull Am Meteor Soc. 2012;93(7):S1-282. https://doi.org/10.1175/3230.1 [ Links ]
47. Qu M, Wan J, Hao X. Analysis of diurnal air temperature range change in the continental United States. Weather Clim Extrem. 2014;4:86-95. https://doi.org/10.1016/j.wace.2014.05.002 [ Links ]
48. Kruger AC, Rautenbach H, Mbatha S, Ngwenya S, Makgoale TE. Historical and projected trends in near-surface temperature indices for 22 locations in South Africa. S Afr J Sci. 2019;115(5-6), Art. #4846. https://doi.org/10.17159/sajs.2019/4846 [ Links ]
 Correspondence:
Njongenhle Nyoni
Email: nmbnyoni@gmail.com
Received: 23 Jan. 2020
Revised: 10 June 2021
Accepted: 12 July 2021
Published: 29 Nov. 2021
Editor: Yali Woyessa
Funding: Open Society Foundation
Supplementary Data
The supplementary data is available in pdf: [Supplementary data]

