


Servicios Personalizados
Articulo
 Inglés (pdf)
 Articulo en XML
 Referencias del artículo
Indicadores

Links relacionados
-
 Citado por Google
 -
 Similares en Google
Compartir

 Permalink
South African Journal of Science
versión On-line ISSN 1996-7489
versión impresa ISSN 0038-2353
S. Afr. j. sci. vol.117 no.11-12 Pretoria nov./dic. 2021
http://dx.doi.org/10.17159/sajs.2021/8848
RESEARCH ARTICLE
Food security and related health risk among adults in the Limpopo Province of South Africa
Hlekani V. MbhatsaniI; Ngoako S. MabapaI; Tambe B. AyukII; Tshifhiwa C. MandiwanaI; Lindelani F. MushaphiI; Merriam MohlalaIII; Xikombiso G. MbhenyaneII
IDepartment of Nutrition, University of Venda, Thohoyandou, South Africa
IIDivision of Human Nutrition, Stellenbosch University, Stellenbosch, South Africa
IIICentre for Biokinetics, Recreation and Sport Science, University of Venda, Thohoyandou, South Africa
ABSTRACT
Food insecurity, obesity and hypertension remain major public health issues related to nutrition in South Africa. The purpose of this study was to determine household food security and the health risk of the adult population in the Limpopo Province using cross-sectional designs. A stratified random sampling method was used to recruit adults aged 18 to 65 years in the Limpopo Province of South Africa. Data were collected using a validated, structured questionnaire. All data were analysed using SPSS version 25.0. The study included 640 participants with an average age of 36.2±17.6 years and a household size of five persons; 74.5% of participants fell in the low monthly income bracket (<ZAR3000). The mean dietary diversity score was 3.99 (CI: 2.79-5.19). The prevalence of food insecurity was 31.3%, obesity 35.2% and hypertension 32.3%. Being a woman, older and married significantly positively influenced obesity and hypertension. Also, a healthy eating lifestyle such as high dietary diversity was found to positively influence obesity status, while daily eating of fruit and vegetables positively significantly influenced the hypertension status of participants (p<0.05). Food insecurity, obesity and hypertension rates remain high among adults in the Limpopo Province of South Africa with consumption of a diet low in dietary variety. Aged and married women were more likely to be obese and hypertensive, while daily fruit and vegetable intake were found to be a protective factor. Educational and nutritional intervention should be designed and geared towards promoting fruit and vegetable intake in the community.
SIGNIFICANCE:
• Households had a diet low in dietary variety, with dietary diversity revealed as a determinant of health risk.
• Dietary diversity is inversely correlated with household food security.
• The findings also identified household determinants of obesity and hypertension, which are major public health issues in South Africa.
Introduction
Culture is learned behaviour common to a given society and shapes behaviour and consciousness of that particular society from one generation to another.1 Food intake is heavily influenced by social, economic, political and cultural processes. Food habits are said to be a sub-system of a material culture, social structure and ideology that includes values, attitudes and norms.2 Current eating habits of Africans reflect multicultural influences and inadequate knowledge of the indigenous eating culture.3 Different cultures have different customs, food beliefs and taboos that influence their eating patterns.4
South Africa is a developing country with a heterogeneous socio-economic and multicultural society. The current eating patterns of black rural Africans indicate three porridge meals daily which are high in carbohydrates, moderate in protein and low in fat. Meat is consumed more regularly than in the past. The traditional diet has been abandoned due to the evolving food system. A nutrition transition has been noticed and it is the key contributor to the obesity epidemic, characterised by a change from a traditional diet to a Western-style diet.5 Large shifts have occurred in both diet and physical activity patterns, particularly in the last one to two decades of the 20th century.6
South Africa has a triple burden of disease, exacerbated by the HIV/Aids epidemic. A consequence of these competing priorities is that there is little recognition of the magnitude of the burden of non-communicable diseases in South Africa. A demographic surveillance area study conducted by the Africa Centre for Health and Population Studies in rural KwaZulu-Natal reported that the prevalence of obesity and hypertension among adults 15-50 years old was 32% and 24% in 2004, respectively.7 Also, from 1997 to 2004 in South Africa, 195 people died every day due to some form of heart and blood vessel disease (cardiovascular diseases). It is estimated that one in four South Africans between the ages of 15 and 64 years suffer from high blood pressure - one of the leading causes of heart attacks, strokes, kidney failure and premature death.8 Furthermore, 39% of the reported mortality in 2010 was due to non-communicable diseases, increasing considerably to 51% of deaths in 2013.8
Many studies have reported that food insecurity is negatively associated with nutritional status and health outcomes such as acute and chronic infections, iron-deficiency anaemia, developmental and mental health problems.9-13 In addition, a number of studies have reported an association between food insecurity and overweight/obesity among adults.14,15 However, a limited number of studies have been conducted to evaluate the association between food insecurity and chronic diseases among the adult population. Most of the studies made use of self-reported chronic diseases measures to evaluate the association with food insecurity, without confirmation through objective assessment of the reported diseases.14,16
The purpose of this study was, therefore, to determine household food security and health risk of the adult population in the Limpopo Province. The study explored different factors combined that may be contributing to the health risk and nutritional status of the study population.
Methods
The design was a cross-sectional, correlational study that surveyed households in the Limpopo Province of South Africa. The sample size was calculated from a population of 1 537 483 using Slovin's formula with 95% confidence level and 5% margin of error, which yielded a sample size of 385 from three of the six districts. A higher number was targeted to control for attrition and withdrawals. Stratified random sampling was used to recruit 640 adults (men and women) aged between 18 and 65 years. Data were collected using a validated questionnaire. The questionnaire consisted of five main sections namely: demographic data (gender, age, marital status, level of education, family size and household income), dietary patterns, household food security (determined using the 24-hour qualitative recall, hunger scale and food inventory), physical activity patterns and anthropometric measurements, specifically body mass index (BMI)/obesity and blood pressure.
The 24-hour recall, hunger scale and food inventory were used to assess consumption and availability of foods in a household. The prevalence of hunger was measured using a hunger scale questionnaire adapted from the World Health Organization (WHO) standardised tool used in the South African National Food Consumption Survey of 1999.17 The physical activity patterns were assessed by asking questions that addressed sedentary lifestyle and physical exercise practice.
BMI and blood pressure were evaluated using both self-reported and clinical measurements. Weight and height were measured thrice using a calibrated electronic scale and stadiometer, respectively, and an average was computed. BMI was calculated from the weight and height measurements (weight in kg/height in metres squared). Systolic and diastolic blood pressures were measured in triplicate in a seated position with 5-min intervals between repeat measurements. Clinical evidence of hypertension was established to be either a measured systolic blood pressure (SBP) >140 mmHg and/or diastolic blood pressure (DBP) >90 mmHg. The self-reported use of antihypertensive medication was also considered.
Ethical consideration
This study was approved by the higher degree and ethics committee of the University of Venda (SHS/08/NUT/003). Permission was also obtained from the chiefs or local councillors. The participants signed a consent form after the study purpose was explained to them. The research adhered to the principles of the Declaration of Helsinki.
Data analysis
Data were analysed using SPSS version 25.0. Descriptive statistics were used to depict overall food security, obesity and hypertension status. Chi-square tests were used to examine associations between these outcome variables (obesity and hypertension status) and independent variables (socio-demographic characteristics, food insecurity and physical activity). The relationship between the participants' BMI and systolic pressure, dietary diversity score (DDS) and obesity and other variables were investigated using Pearson's correlation coefficient. The association between participants' socio-demographic parameters and DDS of <4 food groups was done using logistic regression analysis. Probability (p) values less than 0.05 were considered statistically significant.
Results
Socio-demographic profile
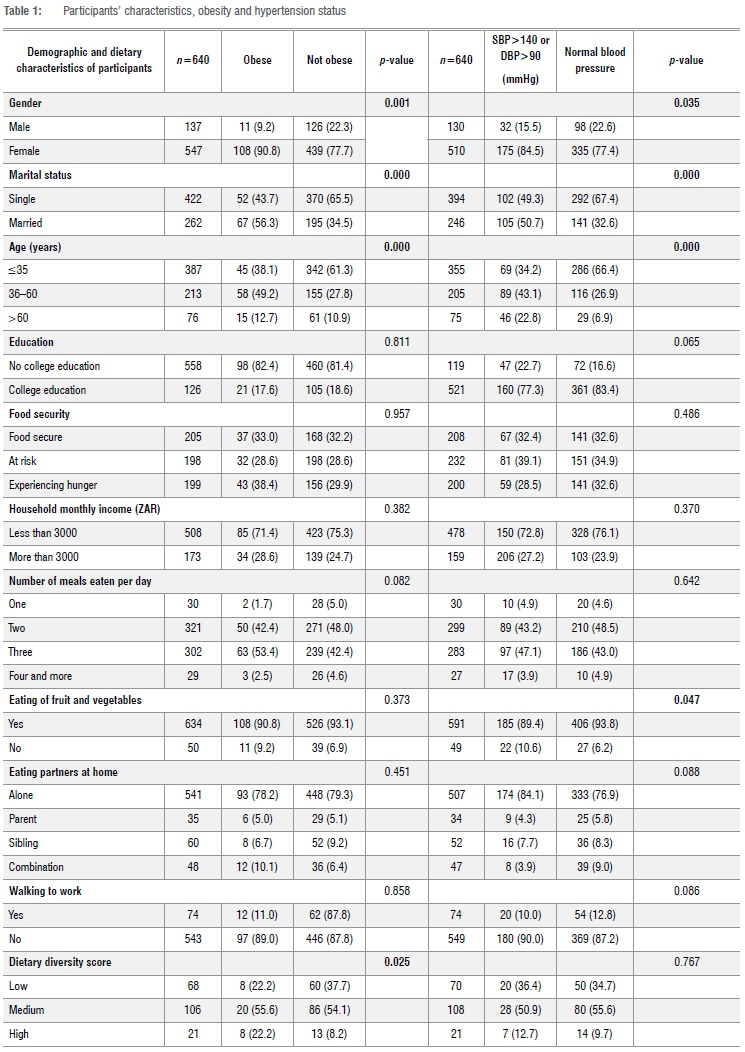
The study included 640 individuals with an average age of 36.2±17.6 years. The average age of men was 32.5 years while the average age of the women was 37.2 years. A predominant proportion (74.5%) of the sample had low monthly income (<ZAR3000), and only 25.2% had a monthly income of above ZAR3000. An average of five persons lived in the surveyed households. The majority (81.5%) of the participants had secondary level of education while just 18.5% did not. Less than two-thirds (61.6%) of the participants were single and 38.4% were married (Table 1).
Health risk
Regarding the physical activity level of the participants, 85.1% were involved in physical activity (self-reported), with household chores (19.5%) and walking (18.2%) being the most frequently reported. Three-quarters (75.5%) of the participants liked watching TV, with 58.5% indicating that they watch for more than 2.5 h at a time.
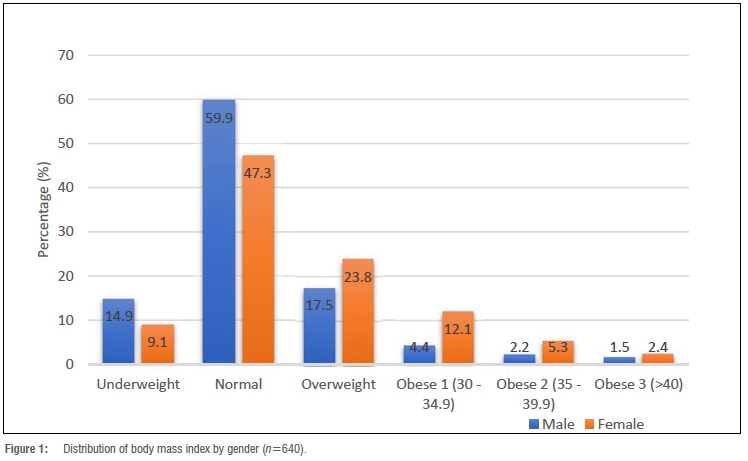
A higher proportion of women (43.6%) than men (25.6%) were obese or overweight (Figure 1). The mean systolic blood pressure was 121.1±20.3 mmHg, while diastolic blood pressure was 78.0±15.8 mmHg. The study revealed that 32.3% of participants showed clinical evidence of hypertension; of these clinically hypertensive participants, 80.7% were unaware of their condition and therefore were not receiving any treatment. Further analysis also showed that 61.3% of these hypertensive participants were over 60 years old.
Dietary patterns
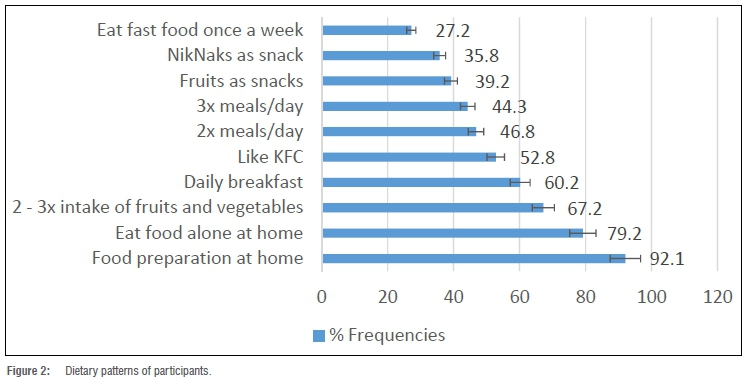
Dietary pattern analysis showed that the majority (92.2%) of participants mostly consumed food prepared at home and did so alone (79.2%). Approximately two-thirds (67.2%) of the participants consumed fruit and vegetables two to three times a week, while 16% reported that they consumed fruit and vegetables daily. In addition, 39.2% reported that they consumed fruit as snacks, while 35.8% consumed NikNaks™ (a local brand of puffed maize) as a snack. Regarding the number of meals eaten per day, 46.8% had two meals per day as compared to 44.3% who had three meals per day (Figure 2). The 24-hour recall revealed that mealie meal, salt, sugar, tea, bread and meat were the most consumed foods in the surveyed households. In addition, the household food inventory revealed that most of the households had mealie meal (32.3%), white bread (38.3%), brown bread (24.2%), corn flakes (17.5%), Rice Krispies® (14.3%) and Weet-Bix™ (8.0%) on the day of the survey.
Dietary diversity of the households
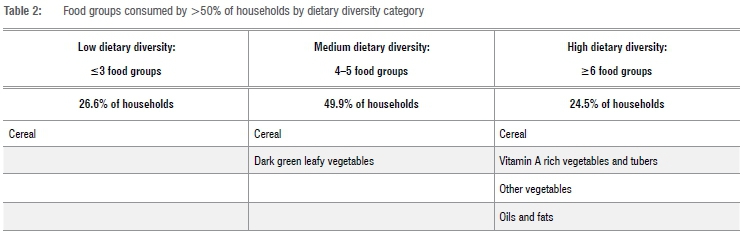
The household dietary diversity of participants was assessed and categorised into three groups: low, medium and high dietary diversity. The findings show that 49.9% of the participants' households had medium dietary diversity, 25.6% low dietary diversity and 24.5% high dietary diversity (more than six food groups). An average household consumed four food groups a day. The food groups consumed by at least 50% of households were also assessed and findings revealed that cereal was predominately consumed at all the different levels of dietary diversity. Cereal was the main food group consumed by those with the lowest dietary diversity. The medium dietary diversity group mostly consumed cereal and dark green leafy vegetables. The households classified as high dietary diversity households mostly consumed cereals, vitamin A rich vegetables and tubers, other vegetables, and oils and fats (Table 2). The mean DDS was 3.99 (confidence interval (CI): 2.79-5.19).
The household dietary diversity was significantly associated with age group and income of the household after adjusting for other factors. Participants <35 years and 36-60 years were 13% (OR: 0.13; 95% CI: 0.03-0.63) and 11% (OR: 0.11; 95% CI: 0.02-0.58) less likely to have a DDS<4, respectively, than the age group of 60 years and above. Participants in households with a monthly income of less than ZAR3000 were twice (OR: 2.44; 95% CI: 1.12-5.34) as likely to have a DDS<4 food groups (Table 3).
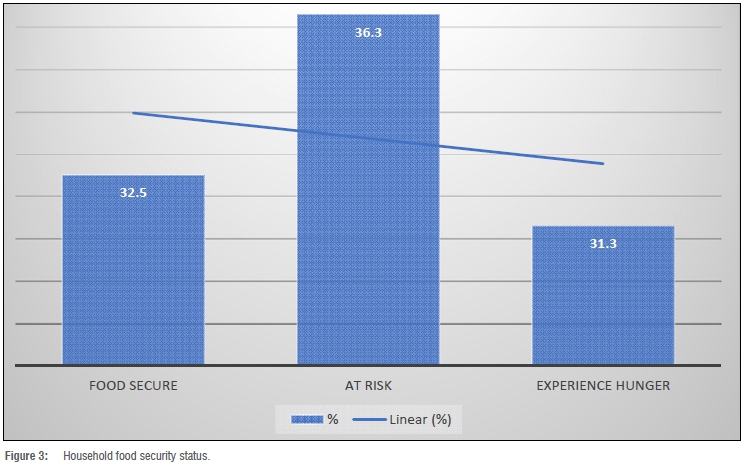
Food security
Food insecurity was higher in the present study, while obesity and hypertension were lower than the national rates. The findings reveal that 32.5% of the households surveyed were food secure, 36.3% of participants were at risk of hunger and 31.3% experienced hunger (Figure 3). The present findings align with the previous rates of food security found by the Limpopo provincial and national South African National Health and Nutrition Examination Survey published in 2013.18 The Survey found a significant inverse correlation between household food insecurity and dietary diversity (r=-0.14, p=0.043).
Associations between participants' health profile, dietary patterns and food security
The association between the participants' characteristics, obesity and hypertension are given in Table 1. Being a woman was significantly associated with obesity (p=0.000), with 90.8% of obese participants being women, and 9.2% men. In addition, being married and in the age group of 36-60 years were also found to be significantly associated with obesity. Furthermore, age (p=0.000), marital status (p=0.042), and a healthy eating lifestyle such as daily eating of fruit and vegetables were significantly associated with hypertension status in the current study (Table 1). There was a significant weak positive correlation between BMI and systolic blood pressure severity (r=0.13, p<0.001). The participants with higher BMI were found to have significantly higher levels of systolic blood pressure as compared to those with lower BMI. We also found a significant association between DDS and obesity (p=0.025) and no significant influence of food insecurity on obesity and hypertension status. Walking to work was not associated with obesity.
Discussion
The main aim of the study was to assess the influence of food insecurity and other predictors on obesity and hypertension status among adults in the Limpopo Province of South Africa. Over one-third of the participants (35.2%) were obese or overweight, with an average BMI of 25.1 kg/ m2. Being a woman, older and married were significantly associated with obesity in the current study. The possible reasons could be that women are responsible for food distribution in the household, while older and married persons could have more access to food. In another South African study conducted to determine the risk factors of obesity among the population, it was also found that the female gender and being married were associated with a high BMI.19 Furthermore, current findings reveal a significantly weak positive correlation between BMI and blood pressure severity (p=0.001). This implies that obesity influences hypertension status in the study area. When persons are obese or overweight, the heart has to work harder to pump blood through the body, exerting strain on arteries, resulting in resistance to the flow of blood, causing blood pressure to rise. Previous cohort studies conducted in four sub-Saharan African countries indicated that BMI was one of the primary factors found to be associated with hypertension.20 Similarly, another study conducted by the United States Health and Nutrition Examination Surveys reported that a positive correlation between BMI and hypertension with bMI>30 kg/m2 was more prevalent.21 Thus, increased BMI might lead to increases in blood pressure and cardiovascular problems, proposing the need for measures of better prevention of this increase.22
The overall prevalence of hypertension in this study was 32.3% of adults, using the 140/90 mmHg diagnostic threshold of which only 19.3% of participants were aware and treated for the condition. Socio-demographic variables such as gender, age and marital status, and healthy eating behaviour such as the daily intake of fruit and vegetables were found to influence the prevalence of hypertension among the study sample. The current findings are in line with previous studies conducted in countries with high prevalence of hypertension, including the WHO SAGE (wave 1 and wave 2) data which reported age as the major determinant of hypertension among South Africans, with 38% and 42% of participants being unaware of their conditions in wave 1 and wave 2, respectively.23,24 Further analysis revealed that eating fruit and vegetables was a preventative factor in hypertension, and adds to the increasing body of research supporting the relationship between fruit and vegetable intake and hypertension.25
The mean score of the DDS of the current study was 3.99 and the participants' age and household income were found to be the major determinants after adjusting for other factors. This is similar to the national mean DDS of 4.02.26 Cereal was the main food group consumed by those with the lowest dietary diversity. The present findings show a better DDS when compared to a South African study conducted on the low-income elderly in Sharpeville that delivered a mean DDS of 3.41. The mean DDS delivered in the current study seems lower when compared to studies conducted in other developing countries like the Philippines (mean DDS of 4.91)27 and Burkina Faso (mean of DDS 4.6).28 We found a significant inverse correlation between food security and dietary diversity, as did a study conducted in Sekhukhune in Limpopo, and other studies.2931 Food insecure households have a limited ability to purchase healthier food options which are often more costly.
The prevalence of food insecurity in the current study was found to be higher than the national rate. Our findings reveal that 36.3% of participants were at risk and 31.3% experienced hunger as compared to the national rate of 28.3% and 26.0%, respectively, in 2012, according to the South African National Health and Nutrition Examination Survey statistics.18 These findings were slightly lower when compared to another study conducted in one district of the Limpopo Province.
In addition, food insecurity was not associated with hypertension in this study. This might be because the sample was homogeneous. These findings are consistent with an earlier study by Seligman et al.14 who reported that food insecurity appears to be more strongly associated with diabetes than with hypertension, specifically at the most severe levels of food insecurity.14 No significant association was found between food security and obesity in the current study. Other studies, however, have also shown no significant association between food security and obesity among the participants.32,33 These findings contradict results of a study conducted by Gipson-Jones et al.34 who reported that food insecure parents were more likely to have overweight/obese children.34 This might be due to the fact that food insecure families have limited ability to purchase healthier food options.
This study was limited because causality cannot be examined because of the cross-sectional study design. Therefore, we cannot attribute cause and effects. Secondly, data were collected using a convenient sample of adults in the community and, therefore, results may not be generalised to the larger population. We did not collect data on smoking and alcohol use, which are main determinants of health risk. Thirdly, data were self-reported, thus social desirability may have affected the extent to which participants reported food-related behaviours in their household. Finally, a single blood pressure measurement is generally not sufficient for a diagnosis of hypertension.
Conclusion and recommendations
Food insecurity, obesity and hypertension rates remain high among adults in the Limpopo Province of South Africa. Current findings suggest that one in three households are food insecure. Being a woman of advanced age and being single was found to significantly influence obesity and hypertension rates among adults in the study area. Intake of fruit and vegetables was found to positively influence hypertension status. Therefore, educational and nutritional interventions should be designed and targeted towards promoting fruit and vegetable intake in the community. Screening campaigns should be planned to screen asymptomatic individuals for overweight/obesity, elevated blood pressure and hypertension disorders.
Acknowledgements
The project was funded by the University of Venda.
Competing interests
We have no competing interests to declare.
Authors' contributions
X.G.M. conceptualised the study. H.V.M., N.S.M., T.B.A., T.C.M., L.F.M., M.M. and X.G.M. collected the data, analysed the data, wrote the draft and approved final versions.
References
1. Yew Wong Chin V Azlan Mohd Noor N. Sociocultural determinants of health and illness: A theoretical inquiry. Geografia Malays J Soc Space. 2014;10(1):49-59. http://ejournal.ukm.my/gmjss/article/view/18364 [ Links ]
2. Kgaphola M, Viljoen A. Food habits of rural Swazi households: 1939-1999. Part 2: Social structural and ideological influences on Swazi food habits. J Consum Sci. 2010;32(1):16-25. https://doi.org/10.4314/jfecs.v32i1.52856 [ Links ]
3. López AJ. Postcolonial whiteness: A critical reader on race and empire. Albany, NY: State University of New York Press; 2005. [ Links ]
4. Gittelsohn J, Vastine A. Sociocultural and household factors impacting on the selection, allocation and consumption of animal source foods: Current knowledge and application. J Nutr. 2003;133(11):4036S-4041S. https://academic.oup.com/jn/article-abstract/133/11/4036S/4818067 [ Links ]
5. Popkin BM. The nutrition transition in the developing world. Dev Policy Rev. 2003;21(5-6):581-597. https://doi.org/10.1111/j.1467-8659.2003.00225.x [ Links ]
6. Harris J, Chisanga B, Drimie S, Kennedy G. Nutrition transition in Zambia: Changing food supply, food prices, household consumption, diet and nutrition outcomes. J Food Secur. 2019;11(2):371-387. https://doi.org/10.1007/s12571-019-00903-4 [ Links ]
7. Bärnighausen T, Welz T, Hosegood V Bätzing-Feigenbaum J, Tanser F, Herbst K, et al. Hiding in the shadows of the HIV epidemic: Obesity and hypertension in a rural population with very high HIV prevalence in South Africa. J Hum Hypertens. 2008;22(3):236. https://www.nature.com/articles/1002308 [ Links ]
8. Statistic South Africa. Mortality and Causes of Death in South Africa, 2013: Findings from Death Notification. Pretoria; 2014. [ Links ]
9. Whitaker R, Phillips S, Orzol S. Food insecurity and the risks of depression and anxiety in mothers and behavior problems in their preschool-aged children. Pediatrics. 2006;118:e859-868. https://doi.org/10.1542/peds.2006-0239 [ Links ]
10. Slack KS, Yoo J. Food hardship and child behavior problems among low-income children. Soc Serv Rev. 2005;79(3):511-536. https://doi.org/10.1086/430894 [ Links ]
11. KursmarkM,WeitzmanM.Recentfindingsconcerningchildhoodfoodinsecurity. Current Opinion in Clinical Nutrition Metabolic care. 2009;12:310-316. https://journals.lww.com/co-clinicalnutrition/Fulltext/2009/05000/Enteral_feeding_and_gut_atrophy.16.aspx?casa_token=0eUgbuMaWGcAAAAA:9qk1Da_rPyMNp-kAkPS0HxD5bqaQ55TM3XsXNLhkXQCt_7cy4BbFLInwnnuNPdoV1FrpSWFm9p5t02ce_XxOcOkvIuWKvCRDvA. [ Links ]
12. Skalicky A, Meyers AF, Adams WG, Yang Z, Cook JT, Frank DA. Child food insecurity and iron deficiency anemia in low-income infants and toddlers in the United States. Matern Child Health J. 2006;10(2):177-185. https://doi.org/10.1007/s10995-005-0036-0 [ Links ]
13. Rose-Jacobs R, Black MM, Casey PH, Cook JT, Cutts DB, Chilton M, et al. Household food insecurity: Associations with at-risk infant and toddler development. Pediatrics. 2008;121:65-72. https://doi.org/10.1542/peds.2006-3717 [ Links ]
14. Seligman H, Laraia B, Kushel M. Food insecurity is associated with chronic disease among low-income NHANES participants. J Nutr. 2009;140(2):304-310. https://doi.org/10.3945/jn.109.112573 [ Links ]
15. Dinour L, Bergen D, Yeh M. The food insecurity-obesity paradox: A review of the literature and the role food stamps may play. J Am Diet Assoc. 2007;107(11):1952-1961. https://doi.org/10.1016/jjada.2007.08.006 [ Links ]
16. Kushel MB, Gupta R, Gee L, Haas JS. Housing instability and food insecurity as barriers to health care among low-income Americans. J Gen Intern Med. 2006;21(1):71-77. https://doi.org/10.1111/j.1525-1497.2005.00278.x [ Links ]
17. Labadarios D, Steyn NP Maunder E, MacIntyre, U, Gericke G, Swart R, et al. The National Food Consumption Survey (NFCS): South Africa. Public Health Nutr. 1999;8(5):533-543. https://doi.org/10.1079/PHN2005816 [ Links ]
18. Shisana O, Labadorias D, Rehle T, Simbayi L, Zuma K, Dhansay A. South Africa National Health and Nutrition Examination Survey (SANHANES-1). Cape Town: HSRC Press; 2013. [ Links ]
19. Malhotra R, Hoyo C, 0stbye T, Hughes G, Schwartz D, Tsolekile L, et al. Determinants of obesity in an urban township of South Africa. S Afr J Clin Nutr. 2008;21(4):315-320. https://doi.org/10.1080/16070658.2008.11734173 [ Links ]
20. Baiyegunhi LJS, Makwangudze KE. Home gardening and food security status of HIV/AIDS affected households in Mpophomeni, KwaZulu-Natal Province, South Africa. Hum Ecol. 2013;44(1):1-8. https://doi.org/10.1080/09709274.2013.11906637 [ Links ]
21. Wang Y, Wang QJ. The prevalence of prehypertension and hypertension among US adults according to the new joint national committee guidelines: New challenges of the old problem. Arch Intern Med. 2004;164(19):2126-2134. https://doi.org/10.1001/archinte.164.19.2126 [ Links ]
22. Linderman GC, Lu J, Lu Y Sun X, Xu W, Nasir K, et al. Association of body mass index with blood pressure among 1.7 million Chinese adults. JAMA Netw Open. 2018;1(4), e181271. https://doi.org/10.1001/jamanetworkopen.2018.1271 [ Links ]
23. Lloyd-Sherlock P Beard J, Minicuci N, Ebrahim S, Chatterji S. Hypertension among older adults in lowand middle-income countries: Prevalence, awareness and control. Int J Epidemiol. 2014;43(1):116-128. https://doi.org/10.1093/ije/dyt215 [ Links ]
24. Ware LJ, Chidumwa G, Charlton K, Schutte AE, Kowal P. Predictors of hypertension awareness, treatment and control in South Africa: Results from the WHO-SAGE population survey (Wave 2). J Hum Hypertens. 2019;33(2):157-166. https://doi.org/10.1038/s41371-018-0125-3 [ Links ]
25. Wang L, Manson JE, Gaziano JM, Buring JE, Sesso HD. Fruit and vegetable intake and the risk of hypertension in middle-aged and older women. Am J Hypertens. 2012;25(2):180-189. https://doi.org/10.1038/ajh.2011.186 [ Links ]
26. Labadarios D, Steyn N, Nel J. How diverse is the diet of adult South Africans. Nutr J. 2011;10(33):1-11. [ Links ]
27. Kennedy G, Pedro M, Seghieri C, Nantel G, Brouwer ID. Dietary diversity score is a useful indicator of micronutrient intake in non breast-feeding Filipino children. J Nutr. 2007;137:472-477. [ Links ]
28. Kennedy G. Evaluation of dietary diversity scores for assessment of micronutrient intake and food security in developing countries [PhD thesis]. Wageningen: Wageningen University; 2009. [ Links ]
29. Faber M, Schwabe C, Drimie S. Dietary diversity in relation to other household food security indicators. Int J Food Saf Nutr Publ Health. 2008;1(2):157-171. [ Links ]
30. Thornton AJ. Dietary diversity and food security in South Africa: An application using NIDS Wave 1 [masters thesis]. Cape Town: University of Cape Town; 2016. https://open.uct.ac.za/handle/11427/20617 [ Links ]
31. Psaki S, Bhutta ZA, Ahmed T, Ahmed S, Bessong P Islam M, et al. Household food access and child malnutrition: Results from the eight-country MAL-ED study. Popul Health Metr. 2012;10, Art. #24. https://doi.org/10.1186/1478-7954-10-24 [ Links ]
32. Wake M, Salmon L, Waters E, Wright M, Hesketh K. Parent-reported health status of overweight and obese Australian primary school children: A cross-sectional population survey. Int J Obes Relat Metab Disord. 2002;26(5):717. [ Links ]
33. Young-Hyman D, Herman LJ, Scott DL, Schlundt DG. Care giver perception of children's obesity-related health risk: A study of African American families. Obes Res. 2000;8(3):241-248. https://doi.org/10.1038/oby.2000.28 [ Links ]
34. Gipson-Jones T, O'Neal L, Sheats J, Thorpe JR, Beech B, Bruce MA. Food security status and overweight/obesity among 2-to 5-year-old boys and girls in a community-based clinic. Fam Community Health. 2019;42(2):117-122. https://doi.org/10.1097/FCH.0000000000000218 [ Links ]
 Correspondence:
Xikombiso Mbhenyane
Email: xgm@sun.ac.za
Received: 01 Sep. 2020
Revised: 19 Feb. 2021
Accepted: 23 July 2021
Published: 29 Nov. 2021
Editors: Pascal Bessong, Sandiswa Mbewana
Funding: University of Venda

