


Servicios Personalizados
Articulo
 Inglés (pdf)
 Articulo en XML
 Referencias del artículo
Indicadores

Links relacionados
-
 Citado por Google
 -
 Similares en Google
Compartir

 Permalink
South African Journal of Science
versión On-line ISSN 1996-7489
versión impresa ISSN 0038-2353
S. Afr. j. sci. vol.117 no.11-12 Pretoria nov./dic. 2021
http://dx.doi.org/10.17159/sajs.2021/8908
RESEARCH ARTICLE
Life cycle assessment of single-use and reusable plastic bottles in the city of Johannesburg
Kunle I. OlatayoI; Paul T. MativengaI, II; Annlizé L. MarnewickI
IPostgraduate School of Engineering Management, University of Johannesburg, Johannesburg, South Africa
IIDepartment of Mechanical, Aerospace and Civil Engineering, School of Engineering, The University of Manchester, Manchester, United Kingdom
ABSTRACT
Polyethylene terephthalate (PET) bottles of water have experienced huge growth in demand and sales in South Africa. This expansion in use creates challenges as well as opportunities for managing the life cycle impact. The properties that make PET desirable for fluid-containing bottles have also made it highly resistant to environmental biodegradation. Reusable plastic bottles are now marketed as a solution to reduce the impact of single-use plastic bottles. We assessed the life cycle impact of single-use PET bottles and an alternative, reusable PET bottle based on consumption patterns in South Africa and the material flow and supply chain in the urban environment. This robust consideration of local conditions is important in evaluating the life cycle impact. In an examination of 13 impact categories, the reusable PET bottle had lower impact than the single-use bottle in all the impact categories examined. The mass of PET bottle material required to deliver the water needs at any given time is a dominant factor on the environmental burden. Extending the life of reusable bottles and designing lighter weight bottles would reduce their life cycle impact. Information obtained in evaluating alternatives to plastic water bottles can be valuable for providing a foundation assessment for policymakers and plastic bottle manufacturers to make informed choices and to focus on improvements in life cycle impact.
SIGNIFICANCE:
• The significant impact of the production phase in the life cycle of both single-use and reusable PET bottles confirms the need to design a much more lightweight bottle to reduce the mass of materials used in production.
• Another key consideration was the long transportation distance covered during the production phase, and the negative impact of current vehicular emissions. Municipalities and waste collectors should consider the use of low-carbon transport.
• This study highlights the value of extending the life of plastic bottles, as well as recycling for material recovery, remanufacturing and repurposing these bottles within the City.
• The use of fewer, larger single-use bottles compared with a greater number of smaller single-use bottles is discussed.
Keywords: plastic, life cycle assessment, PET, single-use bottle, reusable bottle
Introduction
The plastic packaging sector has the highest percentage of plastic consumption globally, contributing to about 40% of plastic usage in 2014.1 However, the majority of the plastics produced in this sector is single-use plastic.2 The most widely used plastic for packaging is polyethylene terephthalate (PET) due to the combination of valuable properties such as strength, chemical and thermal stability, easy processing, durability, and cost effectiveness.3 These valuable qualities make it desirable for the production of packaging for water.4 The plastic bottle is a major application of PET3, with PET constituting 62% of manufactured bottles globally5.
Interestingly, the valuable properties that make PET desirable for bottle production also make it highly resistant to environmental biodegradation. It has been suggested that PET can accumulate in landfills for years, leading to major environmental and health concerns.4,6,7 It has been reported that the plastic bottle is the most common single-use plastic packaging, most of which becomes waste after initial use.8 According to the estimation of the South African Plastic Recycling Organisation9, about 90% of plastic bottle waste goes to landfills. Most water bottling companies are still reluctant to consider recycling plastics as the cost of new plastic resin may be lower than the associated cost of recycling.10 In South Africa, there is rising concern about mismanaged plastic packaging waste, as plastic pollution is on the increase.11
Considering the numerous benefits and corresponding environmental burden of plastic PET bottles, there is an urgent need for a better understanding of their life cycle, fate and pathways for any nation or community.12,13 It is imperative to develop a locally sustainable solution to the challenges of production, accumulation and impacts of plastic bottles in the environment. Most practical solutions recommended include substituting plastic with other materials, recycling, and reuse. Many studies have examined the environmental impacts of different materials as substitutes for plastic packaging and bottles, and others have evaluated the impacts of different end-of-life waste management scenarios. Table 1 compares the aims, assessments and main findings of previous studies.
Based on Table 1 and prior research, it is suggested that when considering global warming potential, it cannot be assumed that glass bottles are more environmentally friendly than PET bottles.14 The other studies in Table 1 also show that environmental burden varies according to choice of end-of-life options. These findings highlight the need to do a detailed life cycle assessment (LCA) of different packaging options.
For South Africa, a review of the different studies on plastic revealed that there is no known available comprehensive information on the environmental life cycle of plastic bottles. A number of studies in the country have focused on microplastic pollution in water resources15,16 and policies and sustainability in plastic use17-19. The studies on microplastics showed the accumulation and high concentration of plastics on shores and beaches due to an increase in the urbanisation levels in areas around them and this pollution poses environmental and health risks to the environment, biodiversity and coastal communities. Also, the failure to consider key stakeholders in the policy implementation process of the Plastic Bags Regulation, which prescribes a minimum thickness of 24 um and maximum printing of 25% of the surface area of the bag and a fixed minimal charge of ZAR0.46 per plastic bag18, has been identified as a barrier to eliminating plastic shopping bags from the environment.
Therefore, in addressing the knowledge gaps regarding the environmental life cycle of plastic packaging in South Africa, and plastic bottles for water in particular, a LCA was conducted to comprehensively assess the environmental impact of plastic bottles in one of the most populated and commercialised cities in Africa, namely Johannesburg. The City of Johannesburg is sited at an elevation of about 1740-to 1810 metres in the Highveld, a plateau area of South Africa.20 It is not a coastal city, neither is it built on a river or harbour; however, there are some streams and artificial lakes and canals.
In this study, we assessed the environmental impacts associated with the life cycle of single-use PET bottles and reusable PET bottles. Our assessment considered the local supply chain and use patterns, the different phases of production, use, and disposal, and the current and future role of plastic collection and recycling as driven by an informal waste collection sector. Single-use PET bottles are described as the plastic bottles that are mostly discarded and that become waste after the initial consumption of their contents.21 Reusable PET bottles are the bottles designed to be stronger and that are used, washed, and reused.
These two types of plastic bottles, shown in Figure 1, were considered for this study because of their substantial use in South Africa.22 The single-use PET bottle is one of the most common single-use plastic packaging.23 Bottled water has constantly experienced huge growth in demand and sales in South Africa in recent years as a result of the continual water crisis plaguing the nation due to drought and water diseases24 and issues with wide-scale availability of purified water. The bottled water industry makes a major contribution to the economy of South Africa as it generated about ZAR3 550 million in sales and employed 1800 people in South Africa in 201 1.25 For the reusable PET bottles, their reusability and the refill water initiative at different shopping outlets and petrol stations in the country support the continued demand for the product. There is also potential for increased growth of the PET bottle industry with the increase in the number of entrepreneurs entering the market. Determining the environmental impacts of these PET bottles is thus timely and important for South Africa. Furthermore, to our knowledge, no study has assessed and compared the environmental impacts of reusable bottles with single-use bottles. Most importantly, similar studies conducted globally cannot be applied directly to South Africa, as system parameters contribute significantly in determining the environmental impacts of products and processes in an individual country.

Life cycle assessment is an important method used to analyse and quantify the potential environmental impacts and resource consumption associated with a product system.26 Evaluating alternative plastic water bottles provides a foundation assessment for policymakers and plastic bottle manufacturers to make informed choices and to focus on improvements in environmental performance.
Methodology
The LCA method was used for this study. The four steps for conducting an LCA were followed, namely goal and scope definition, inventory analysis, impact assessment and interpretation.26 Furthermore, sensitivity analysis was applied to evaluate the reliability of the results by varying some of the input data to determine the corresponding changes in the outputs. This helped to determine the significance and influences of selected data and evaluation methods on the LCA results.27,28
Goal and scope definition
The purpose of our study was to comparatively analyse and quantify the resource consumption and environmental impacts associated with the use of single-use PET bottles and a probable environmentally friendly plastic bottle alternative, namely reusable PET bottles, in the City of Johannesburg, South Africa. Specifically, we evaluated the resource consumption and environmental impact associated with the different phases of production, use and disposal of single-use and reusable PET bottles. Sensitivity analysis was used to assess the impact of input data regarding the evaluation of resource use and environmental impacts. We then assessed (1) estimated impacts based on annual consumption of PET bottles and (2) implications of informal collection and recycling of PET bottle waste, which is a key factor in South Africa.
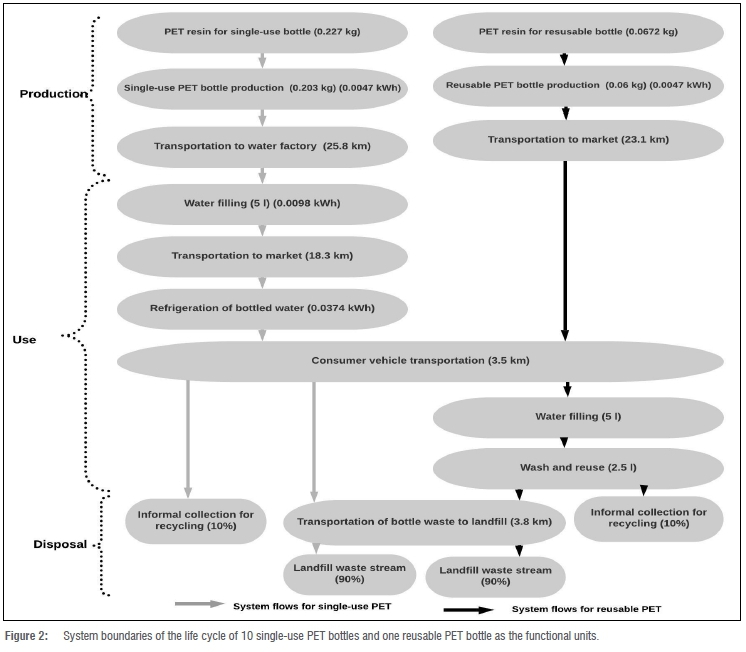
The system boundaries of the LCA define the processes within a product supply chain and account for time, space and functional unit.29,30 The system boundaries of the plastic life cycle study included all activities and processes related to the production, use and disposal of plastic PET bottles in Johannesburg as illustrated in Figure 2. Life cycle activities such as raw material extraction and recycling were held constant as an assumption.31,32
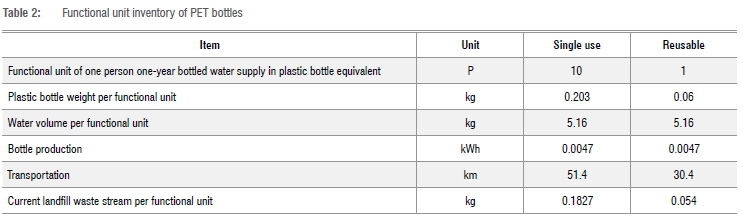
The functional unit was defined as the delivery of bottled water to one person in Johannesburg for the period of one year. The functional unit was equivalent to a service life of a year for the reusable PET bottle, as informed by the findings of the survey by Tukur et al.33 It has been suggested that the extended use of the reusable PET water bottle is not recommended due to the risk of discharge of antimony from PET bottles to the liquid contents.34 For users, the deteriorating taste of water is also a factor. Considering that the South African market, with an estimated population of 58.8 million35, consumed 617.3 million units of single-use PET bottled water in 201924, the functional unit of 10 single-use 0.5-L PET bottles was assumed for this study. This assumption is closely supported by a report of the South African National Bottled Water Association which estimated that 270 million litres of water are bottled annually.36 It is noted that the average consumption in urban areas could be slightly higher than in other areas; however, there are limited data available for specific locations in the country. Similar assumptions have been made by other related studies.14 Therefore, for this study, a single unit of a reusable 0.5-L PET bottle serves the same function as 10 units of single-use 0.5-L PET bottles.
LCA inventory analysis
The data and information for the impact assessment were derived from actual measurements of bottles, study of use patterns, industry professionals and government agencies, and the review of a standard LCA database (EcoInvent 3.0) and scientific literature. The material inventory was based on the actual weight of bottles, water and packaging film and national statistics. The distances were estimated with the use of Google Maps, and electricity for production was supplied from the national grid. The scenarios for the manufacturing and transportation processes in this impact assessment were based on the actual PET bottle supply chain system investigated for the City of Johannesburg.
Production phase of PET bottles
The PET bottles considered in this study were assumed to be produced from 100% virgin PET resins which are petroleum-based materials. Also, the bottle weight analysed included the weights of both the bottle cap (polypropylene) and label (low-density polyethylene). These assumptions are supported by previous research.7 Actual measurements were conducted to derive the weights of the bottles. The weights of the single-use and reusable bottles are 0.0203 kg (bottle 0.018; cap 0.002; label 0.0003) and 0.060 kg (bottle 0.055; cap 0.005), respectively. The bottle production processes involve the plastic resin production, preforms production and blow moulding into bottles. Considering that a 1-kg PET bottle requires 1.12 kg PET resin7 for production, a single-use bottle production consumes about 0.0227 kg of virgin PET resins. Similarly, a reusable bottle consumes about 0.0672 kg of virgin PET resins. The data for the blow-moulding process were extracted from the EcoInvent 3.0 database on SimaPro. As reported before, the study adopted a functional unit of per person annually for the bottled water needs of an individual in South Africa. This was 10 single-use 0.5-L PET bottles as supported by use patterns, and an equivalent functional unit of 1 reusable 0.5-L PET bottle per person annually.
Transportation of the bottle from the production plant was included in this phase. The transportation is a function of the weight of the goods and distance covered, calculated in kilogram-kilometre (kg-km) for all the routes.14 The bottle manufacturing firm is located in Modderfontein, South Africa. The impact data for the truck transportation were retrieved from the EcoInvent 3.0 database. A distance of 25.8 km was estimated from the bottle factory in Modderfontein to the water factory in Randburg, South Africa, for water filling of single-use bottles. Also, transportation of reusable bottles from Modderfontein to market in Johannesburg's central business district was estimated at 23.1 km.
Use phase of PET bottles
The impacts associated with the service life of the single-use bottle include the injection of water into the bottle (filling), transportation of bottled water to the market, refrigeration at the market, transportation to homes and initial consumption by end-users. The impact data for the water injection and refrigeration processes were modelled with the EcoInvent 3.0 database. The weight of water to fill the 0.5-L PET bottle is 0.516 kg. The plastic film to package the set of 10 bottles of water weighs 0.0184 kg. Both the weights of the water and plastic film were derived by actual measurement. Furthermore, the refrigeration of the bottled water was set at 0.0374 kWh7, and the electricity for water filling at 0.0098 kWh (1 BTU = 0.000293071 kWh of electricity). An estimated distance of 18.3 km was covered to transport bottled water from the water factory in Randburg to the market in Johannesburg's central business district. For the reusable bottles, based on the actual supply chain, the impacts considered include transportation from the market to homes, initial consumption by filling with water, and the subsequent cleaning and reuse by end-users. Impact activities such as electricity for water filling and refrigeration were not considered as the real supply chain for reusable bottle in South Africa involves buying an empty bottle at the store and filling with water (which is usually tap or non-refrigerated water) at home or at designated places. The successive cleaning of the reusable bottle involves washing manually with a small volume of water, thus no electricity is involved. The water consumption for successive cleaning of a bottle is taken as half the bottle volume and the total is 2.5 L for the year. This assumption is supported by other studies.37,38 Also, the consumer vehicle transportation distance from the market in Johannesburg's central business district to homes was estimated at 3.5 km.
Disposal phase of PET bottles
In modelling the disposal phase of the two PET bottles, the single-use PET bottles are considered to be disposed of after the initial consumption of the contents21, whilst the reusable PET bottles are assumed to be used repeatedly for one year and then disposed of, based on reports of random users. Water quality, bottle damage, aesthetics, new designs, etc. are expected to influence use patterns and shelf life. Approximately 90% of plastic bottle waste in South Africa ends up in landfills.9 The average distance from the waste disposal location to the Robinson Landfill Site in Turffontein Stafford, South Africa is 3.8 km. Furthermore, plastic waste is mostly polymeric and does not degrade for hundreds of years.32,39 However, plastic waste in landfill contributes to pollution and this was modelled in the software.
The LCA inventory of all the activities and processes involved in the different phases of the life cycles of the single-use and reusable PET bottles is further presented in Table 2. The total distances covered by the single-use and reusable PET bottles from production to disposal are 51.4 km and 30.4 km, respectively.
LCA Impact Assessment
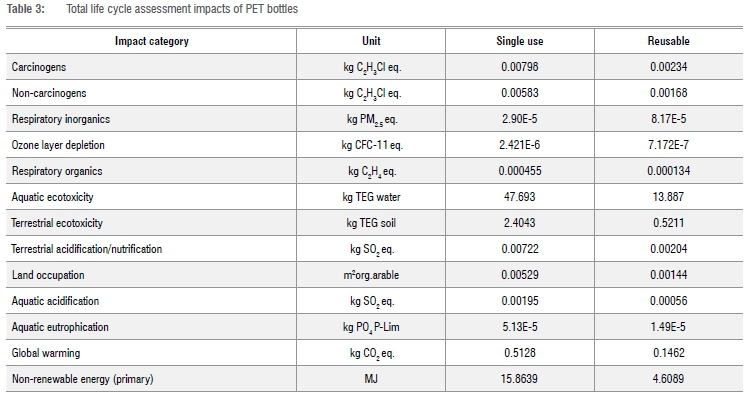
The IMPACT 2002+ assessment method in SimaPro 9 was used for the potential impact assessment of the PET bottles. This method has been used by other similar LCA studies7,38,40, as it gives a comprehensive assessment of the processes examined, and is also among the current and up-to-date LCA methodologies. The impact categories evaluated in this LCA study were carcinogens, non-carcinogens, global warming, ozone layer depletion, aquatic eutrophication, aquatic ecotoxicity, terrestrial ecotoxicity, respiratory organics, respiratory inorganics, terrestrial acidification/nutrification, aquatic acidification, non-renewable energy (primary), and land occupation.
The carcinogens and non-carcinogens (kg C2H3Cl eq.) are related to the formation of chemical compounds that affect human health and the ecosystem. Global warming (kg CO2 eq.) is related to climate change, which is of public concern, and the environmental impact is assessed using greenhouse gases consisting of carbon dioxide, methane, nitrous oxide and other less prevalent gases. The ozone layer depletion (kg CFC11 eq.) impact is associated with the depletion of the ozone layer by chemical substances, as the ozone shields humans and organic matter from the ultraviolet radiation of the sun. The exposure to phosphorous compounds in the environment can be linked to aquatic eutrophication (kg PO4 P-Lim) and this negatively affects plants and organisms through oxygen deprivation. Respiratory organics (kg C2H4 eq.) and inorganics (kg PM2.5 eq.) are environmental impact categories related to the formation of tropospheric ozone and are a threat to health and quality of life.
Terrestrial and aquatic acidification (kg SO2 eq.) has to do with the release of chemicals such as sulfur dioxides into the environment, causing lower than normal pH, which affects the acidity of the ecosystem. Aquatic and terrestrial ecotoxicity refers to substances that are poisonous to organisms in the ecosystem when emitted. Non-renewable energy (MJ) is primary energy such as coal and petroleum which cannot be reused, within a particular period, after the initial use. Land occupation (m2org.arable) is associated with land mass that has the capability of being ploughed for useful purposes such as agriculture.
Results and discussions
Table 3 shows the total impact values of the single-use and reusable PET bottles in all the impact categories. As shown, the reusable PET bottle had lower impact in all impact assessment categories evaluated than did the single-use PET bottle.
Comparative assessment of the life cycle phases
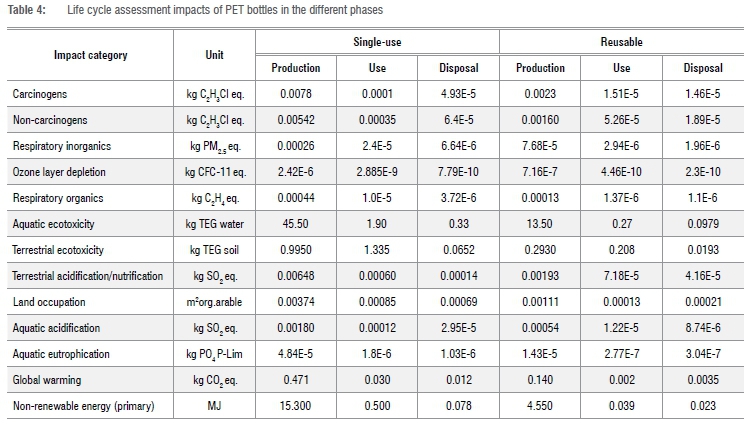
The equivalent phases of the life cycles of the two different bottles were analysed and compared. The detailed values of the results for the different life cycle phases of production, use and disposal for the two PET bottles are shown in Table 4.
In all the impact categories, the impacts from the production, use and disposal phases of the single-use bottle were higher than the equivalent phases for the reusable bottle. The comparison of the use phases of the two PET bottles produced more interesting results. The percentage difference (or ratio) between the higher impact values of the single-use bottle and the lower impact values of the reusable bottle were very substantial in all impact categories in the use phases, unlike the differences between the other equivalent phases of the two bottles.
This is possibly due to the additional amount of transportation in the use phase of the single-use PET bottle, as the single-use bottle experienced an initial distance of 18.3 km in the use phase when bottled water was transported from the water factory to the market in Johannesburg's central business district and another distance of 3.5 km for the consumer vehicle to transport from the market to the home. The only distance covered in the use phase by the reusable bottle was the consumer vehicle transportation from the market to the home (3.5 km). Transportation by motor vehicle increases fossil fuel use, which subsequently increases the amounts of chemical pollutants emitted into the environment.7 Thus, single-use bottles are expected to have more impact. The sale of a higher number of single-use bottles in a pack could be a consideration in reducing impact from transport, provided other wider factors are also considered.
For the single-use bottle, the production phase had the highest impact in the impact categories, followed by the use phase and then the disposal phase. Also, for the reusable bottle, the production phase had the highest impact, followed by the use phase, with the disposal phase having the least impact. Manufacturers of reusable bottles should focus on the design and on reducing the environmental impact of manufacture and extended producer responsibility for, particularly, end-of-life waste management. The highest impact values experienced in the production phases of the two PET bottles compared to the other phases is consistent with studies in other countries.14,38 The production phase of the single-use bottle has more impact than that of the reusable bottle due to the total weight of the 10 bottles for the functional unit.
The disposal phase of the reusable bottle has more impact than the use phase. This shows the importance of developing other end-of-life scenarios higher on the waste hierarchy. Instead of sending the reusable bottles to landfill, the uptake of bottle collection for recycling for material recovery, remanufacturing or repurposing should be promoted.
Sensitivity analysis of mass ratio
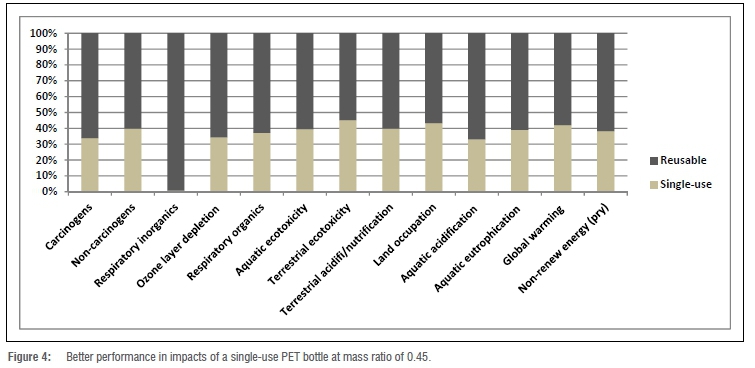
Sensitivity analysis was conducted for this study by identifying parameters that could have an effect on the environmental impact results produced by the single-use PET bottle and reusable PET bottle. This helped to determine the reliability of the impact results and the consequence of alternative modelling. Considering that the LCA results established that the reusable bottle is more environmentally friendly, this analysis was done to determine the possibility of producing a more sustainable single-use PET bottle if certain variables in the life cycle of the bottle are reviewed. Additionally, in order to reduce or equalise the environmental impacts of the single-use PET bottle with that of the reusable bottle, the parameter of mass ratio of the required bottles was varied around their base values. This approach has been recommended by other studies.14 Realising the recommendations would require advanced technological development. The single-use/reusable mass ratio exercise involves holding the mass of the reusable bottle constant while varying the mass of the single-use bottle around its base value, and then computing the impacts to determine when the impact category values of the two bottles become equal. This could further improve the environmental performance of the single-use PET bottle in the impact categories. The mass ratio of the bottles can be associated with the production phase, which had the greatest impact in the life cycles of the PET bottles. When the mass of the required single-use PET bottles is varied, the bottles could be equalised with the reusable bottle in most of the impact categories, except terrestrial ecotoxicity at a single-use/reusable mass ratio of 0.92, as shown in Figure 3. Also, it could perform better in all the impact categories at a mass ratio of 0.45, as presented in Figure 4. In practice this means that, (1) subject to technological advances, single-use bottles have to be lighter by circa 45%, or (2) lighter larger single-use bottles have to be promoted provided their total mass is lower than the smaller single-use bottle alternatives. Research, development and extending the useful life of reusable water bottles will make life cycle impacts of existing single-use bottles even less favourable.
The results further established that the mass or quantity of products from the production phase can greatly influence the environmental impact. The reduction in the mass of the single-use PET bottle could be achieved by introducing a much more lightweight design, which will result in reduced weight of the bottles, and will subsequently have less impact.
It needs to be noted that this study assessed the scenario of the two PET bottles as 100% virgin material. Other studies have already shown that the more the fraction of recycled PET, the better the performances in the impact categories.7,41
Environmental impacts and waste management of bottles
The implications of the LCA results of the single-use and reusable PET bottles on the informal collection and recycling of these bottles for the City of Johannesburg are covered in this section.
LCA impacts and informal collection and recycling of PET bottles
The future increase in the consumption of plastic bottled water in the City of Johannesburg, with an estimated population of 5 635 000 as at 201942, will result in future increases in the volume of PET bottle waste generated. Regrettably, approximately 90% of plastic bottle waste in South Africa ends up in landfills, according to the analysis by the South African Plastic Recycling Organisation9 applied in this study. However, several studies have established the preference for recycling over landfill, incineration, etc. in their assessments of the life cycle of different PET waste management options.43,44 Interestingly, the recycling system of South Africa is incomplete without acknowledging the contributions of the informal sector.45,46 Waste collectors from this sector are small-scale, self-employed agents, regularly found pushing their trolleys on the streets of Johannesburg and many urban areas of other developing countries.47,48 For example, a total of 519 370 tonnes of plastic waste was collected for recycling in 2018 in South Africa.49 The challenge is how to scale up the waste collection and to maximise the economic and social benefits for citizens.
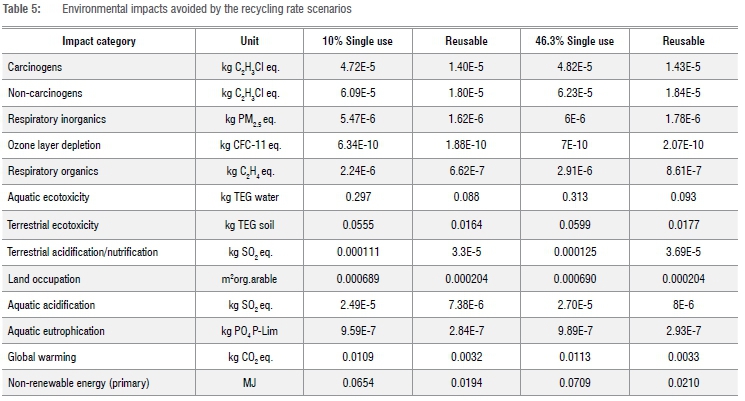
In view of the importance of recycling and the contribution of the informal sector, we analysed two different recycling rate scenarios for the environmental impact that would be avoided by diverting the bottle waste from landfill to recycling in the disposal phase. These scenarios were the residual 10% of PET bottle recycled (assumed 90% landfill disposal), and the present 46.3% plastic recycling rate of South Africa obtained from Plastic SA49. It is crucial that the amount of 46.3% is examined given that not all plastic is collected. It is considered here as aspirational. The environmental impacts avoided through recycling are presented in Table 5.
The results show the significance of the environmental impact prevented by the two recycling rate scenarios. Also, the results support the inclusion of the informal sector in the official waste management system, as it contributes to environmental sustainability by reducing the volume of waste meant for landfill sites and by providing material for recycling.45,50 In moving from recycling rates of 10% to 46.3%, the impacts avoided do not improve significantly. This suggests that recycling is not the major solution for reducing environmental impact, but that addressing the occurrence of plastic at source is the answer. However, it needs to be noted that, when considering the sustainability pillars, the informal recycling sector creates opportunities for revenue generation for society, provided the health and safety aspects of waste collection are also considered.
LCA and sustainable design and manufacturing of PET bottles
General awareness about the potential impacts of the chemical components of PET bottles, and plastics in general, on human health and the environment is increasing. PET bottles are generally used as a container for liquids and the varied design features depend on the kind of liquid to be stored.51 Innovations in the sustainable design and manufacture of PET bottles are being directed towards the reduction of the thickness or mass of plastic bottles.51,52 The sustainable design of plastic or PET bottles is often defined in the area of circular economy or life cycle. The model of life cycle considers all the exposure, energy and emissions relating to the different phases of the life cycle of a product, including the extraction of raw material, production, use, and disposal and waste management. Taking into consideration the importance of life cycle in the design phase of plastic bottles will help manufacturers develop sustainable PET bottles that will positively affect the total environmental impacts at all life cycle phases of the bottle.
The sustainable design of PET bottles has its own challenges due to the complex nature of plastic, particularly the management of the end-of-life phase. As a result, DeCoster and Bateman53 emphasised the importance and need for manufacturers to apply sustainable manufacturing approaches that will extend the lifetime of the product and reduce usage of resources, such as modularisation, design for closed loop, virtual manufacturing, product service system contract, upgradeable products and maintainable products.
Conclusions
We comparatively analysed and quantified the environmental impacts associated with the life cycles of single-use PET bottles and reusable PET bottles in the City of Johannesburg in South Africa. Our study highlights the magnitude of the environmental problem facing the City caused by the huge consumption of PET bottles. There could also be a potential increase in this problem due to population growth and increased sales and demand for bottled water in the market. Our assessment established that the reusable PET bottle has a better environmental performance than the single-use PET bottle in the City of Johannesburg across all LCA impact categories. The primary reason for this difference is that more single-use bottles are needed for one year's supply of water compared to using one reusable bottle. The mass of material in the process of production contributes significantly to this greater impact. This also means that extending the life of the reusable bottle will make a positive contribution to reducing the life cycle impacts. Under the current conditions of usage of single-use bottles, use of lighter weight larger water bottles (rather than the alternative total number of smaller bottles) should be considered.
The significant impact of the production phase in the life cycle of the PET bottles confirms the need to design a much more lightweight single-use bottle and to reduce the mass of materials used in production. This was also established by the sensitivity analysis, which shows that the processes of manufacture and bottle forming associated with the production phase in the life cycle of a bottle product can be a major environmental cost, as the mass or quantity of material required can have a significant environmental impact. Also, more sustainable transportation of goods is required to lower the environmental impact.
Furthermore, we present the existing environmental impact in the City by analysing the total annual environmental impacts from the consumption of these PET bottles. Similarly, our analysis shows the importance and limitation of recycling and the beneficial role played by the informal sector in the waste management of plastic bottles by reducing the volume of plastic bottle waste meant for landfill sites and channelling it to recycling. However, recycling does not significantly reduce the life cycle impact of plastic bottle usage. A solution for addressing the demand for and consumption of plastic bottles at source is more desirable.
Acknowledgements
We acknowledge SimaPro for the provision of LCA software for the study.
Competing interests
We have no competing interests to declare.
Authors' contributions
K.I.O.: Methodology, data analysis, software, writing - original draft preparation, investigation. PT.M.: Conceptualisation, supervision, validation, writing - review and editing. A.L.M.: Conceptualisation, supervision, validation, writing - review and editing.
References
1. Plastic Europe. Plastics: The facts 2014/15. An analysis of European latest plastics production, demand and waste data [document on the Internet]. c2015 [cited 2020 Jun 28]. Available from: https://www.plasticseurope.org/application/files/5515/1689/9220/2014plastics_the_facts_PubFeb2015.pdf [ Links ]
2. Muise I, Adams M, Cote R, Price GW. Attitudes to the recovery and recycling of agricultural plastics waste: A case study of Nova Scotia, Canada. Resour Conserv Recycl. 2016;109:137-145. https://doi.org/10.1016/j.resconrec.2016.02.011 [ Links ]
3. Frigione M. Recycling of PET bottles as fine aggregate in concrete. Waste Manage. 2010;30:1101-1106. https://doi.org/10.1016/j.wasman.2010.01.030 [ Links ]
4. Orset C, Barret N, Lemaire A. How consumers of plastic water bottles are responding to environmental policies. Waste Manage. 2017;61:13-27. https://doi.org/10.1016/j.wasman.2016.12.034 [ Links ]
5. American Chemistry Council (ACC), Association of Plastic Recyclers (APR). 2018 US National post-consumer plastic bottle recycling report [document on the Internet]. c2019 [cited 2020 Apr 15]. Available from: https://www.plasticsmarkets.org/jsfcode/srvyfiles/w151_q2_sp88_0_2018_UNITED_STATES_NATIONAL_POSTCONSUMER_PLASTIC_BOTTLE_RECYCLING_REPORT.pdf [ Links ]
6. Revathi R, Kumar TR, Raman MS, Umanath B, Student UG. Reuse of bottles for wall construction and crafting. Int J Eng Sci. 2017;7(4):6693-6696. [ Links ]
7. Horowitz N, Frago J, Mu D. Life cycle assessment of bottled water: A case study of Green2O products. Waste Manage. 2018;76:734-743. https://doi.org/10.1016/j.wasman.2018.02.043 [ Links ]
8. Heinrich Böll. Plastic atlas 2019: Facts and figures about the world of synthetic polymers [document on the Internet]. c2019 [cited 2020 May 21]. Available from: https://za.boell.org/en/2019/11/06/plastic-atlas-facts-and-figures-about-world-synthetic-polymers [ Links ]
9. South African Plastic Recycling Organisation (SAPRO). Why recycle? [webpage on the Internet]. c2019 [cited 2020 May 22]. Available from: https://www.plasticrecyclingsa.co.za/why-recycle/ [ Links ]
10. Intagliata C. Does recycling plastic cost more than making it? [webpage on the Internet]. c2012 [cited 2020 May 17]. Available from: https://www.livescience.com/32231-does-recycling-plastic-cost-more-than-making-it.html [ Links ]
11. Ryan P Perold V Osborne A, Moloney C. Consistent patterns of debris on South African beaches indicate that industrial pellets and other mesoplastic items mostly derive from local sources. Environ Pollut. 2018;238:1008-1016. https://doi.org/10.1016/j.envpol.2018.02.017 [ Links ]
12. Sonnemann G, Valdivia S. Medellin Declaration on marine litter in life cycle assessment and management. Int J Life Cycle Assess. 2017;22:1637-1639. https://doi.org/10.1007/s11367-017-1382-z [ Links ]
13. Boucher J, Faure F, Pompini O, Plummer Z, Wieser O, Felippe de Alencastro, L. (Micro) plastic fluxes and stocks in Lake Geneva basin. Trends Anal Chem. 2019;112:66-74. https://doi.org/10.1016/j.trac.2018.11.037 [ Links ]
14. Kouloumpis V Pell RS, Correa-Cano ME, Yan X. Potential trade-offs between eliminating plastics and mitigating climate change: An LCA perspective on polyethylene terephthalate (PET) bottles in Cornwall. Sci Total Environ. 2020;727(138681):1-10. https://doi.org/10.1016/j.scitotenv.2020.138681 [ Links ]
15. Naidoo T, Glassom D, Smith AJ. Plastic pollution in five urban estuaries of KwaZulu-Natal, South Africa. Mar Pollut Bull. 2015;101(1):473^80. https://doi.org/10.1016/j.marpolbul.2015.09.044 [ Links ]
16. Verster C, Minnaar K, Bouwman H. Marine and freshwater microplastic research in South Africa. Int Environ Assess Manage. 2017;13(3):533-535. https://doi.org/10.1002/ieam.1900 [ Links ]
17. Nhamo G. Waste management policy implementation in South Africa: An emerging stakeholder participation paradox. South Afr J Environ Educ. 2003;20:39-52. [ Links ]
18. Dikgang J, Leiman A, Visser M. Analysis of the plastic bag levy in South Africa. Resour Conserv Recycl. 2012;66:59-65. https://doi.org/10.1016/j.resconrec.2012.06.009 [ Links ]
19. Babayemi JO, Nnorom IC, Osibanjo O, Weber R. Ensuring sustainability in plastic use in Africa: Consumption, waste generation, and projections. Environ Sci Eur. 2019;31(60):1-20. https://doi.org/10.1186/s12302-019-0254-5 [ Links ]
20. Campbell JT. Johannesburg South Africa [webpage on the Internet]. c2019 [cited 2020 Aug 04]. Available from: https://www.britannica.com/place/Johannesburg-South-Africa [ Links ]
21. Ma X, Park C, Moultrie J. Factors for eliminating plastic in packaging: The European FMCG experts' view. J Clean Prod. 2020;256(120492):1-20. https://doi.org/10.1016/j.jclepro.2020.120492 [ Links ]
22. PET Plastic Recycling South Africa (PETCO). Plastic bottle recycled tonnage grown by 822% since 2005 [webpage on the Internet]. c2017 [cited 2020 May 22]. Available from: https://petco.co.za/plastic-bottle-recycled-tonnage-grown-822-since-2005/ [ Links ]
23. Jambeck J, Geyer R, Wilcox C, Siegler T, Perryman M, Andrady A, et al. Plastic waste inputs from land into the ocean. Science. 2015;347(6223):768-771. https://doi.org/10.1126/science.1260352 [ Links ]
24. Euromonitor International Limited. Bottled water in South Africa [webpage on the Internet]. c2020 [cited 2020 Jun 05]. Available from: https://www.euromonitor.com/bottled-water-in-south-africa/report [ Links ]
25. Metcalf C. Bottled water industry vital player in SA economy [document on the Internet]. c2012 [cited 2020 May 29]. Available from: https://www.environment.co.za/sustainable-green-business-news/bottled-water-industry-vital-player-in-sa-economy.html [ Links ]
26. ISO 14040. Environmental management - life cycle assessment principles and framework. European Standard EN ISO 14040 International Standardization Organization (ISO) [document on the Internet]. c2006 [cited 2020 Jun 22]. Available from: https://www.iso.org/standard/37456.html [ Links ]
27. Wager PA, Hischier R. Life cycle assessment of post-consumer plastics production from waste electrical and electronic equipment (WEEE) treatment residues in a Central European plastics recycling plant. Sci Total Environ. 2015;529:158-167. https://doi.org/10.1016/j.scitotenv.2015.05.043 [ Links ]
28. Chen Y Cui Z, Cui X, Liu W, Wang X, Li X, et al. Life cycle assessment of end-of-life treatments of waste plastics in China. Resour Conserv Recycl. 2019;146:348-357. https://doi.org/10.1016/j.resconrec.2019.03.011 [ Links ]
29. Eriksson O, Frostell B, Bjorklund A, Assefa G, Sundqvist JO, Granath J, et al. ORWARE - A simulation tool for waste management. Resour Conserv Recycl. 2002;36(4):287-307. https://doi.org/10.1016/S0921-3449(02)00031-9 [ Links ]
30. Antelava A, Damilos S, Hafeez S, Manos G, Al-Salem SM, Sharma BK, et al. Plastic solid waste (PSW) in the context of life cycle assessment (LCA) and sustainable management. Environ Manag. 2019;64:230-244. https://doi.org/10.1007/s00267-019-01178-3 [ Links ]
31. Garfi M, Cadena E, Sanchez-Ramos D, Ferrer I. Life cycle assessment of drinking water: Comparing conventional water treatment, reverse osmosis and mineral water in glass and plastic bottles. J Clean Prod. 2016;137:997-1003. http://dx.doi.org/10.1016/j.jclepro.2016.07.218 [ Links ]
32. Arena U, Mastellone ML, Perugini F. Life cycle assessment of a plastic packaging recycling system. Int J Life Cycle Assess. 2003;8(2):92-98. https://doi.org/10.1007/BF02978432 [ Links ]
33. Tukur A, Sharp L, Stern B, Tizaoui C, Benkreira H. PET bottle use patterns and antimony migration into bottled water and soft drinks: The case of British and Nigerian bottles. J Environ Monit. 2012;14(4):1237-1247. https://doi.org/10.1039/C2EM10917D [ Links ]
34. Shotyk W, Krachler M, Chen B. Contamination of Canadian and European bottled waters with antimony from PET containers. J Environ Monit. 2006;8(2):288-292. https://doi.org/10.1039/b517844b [ Links ]
35. Stats SA. Mid-year population estimates 2019 [document on the Internet]. c2019 [cited 2020 Jul 11]. Available from: https://www.statssa.gov.za/publications/P0302/P03022019.pdf [ Links ]
36. South African National Bottled Water Association (SANBWA). About bottled water: Fact sheet [webpage on the Internet]. No date [cited 2020 May 15]. Available from: http://www.sanbwa.org.za/water_factsheet.asp [ Links ]
37. Landi D, Germani M, Marconi M. Analysing the environmental sustainability of glass bottles reuse in an Italian wine consortium. Proceedings of the 26th CIRP Life Cycle Engineering (LCE) Conference. Procedia CIRP 2019;80:399-404. https://doi.org/10.1016/j.procir.2019.01.054 [ Links ]
38. Abejon R, Bala A, Vazquez-Rowe I, Aldaco R, Fullana-i-Palmer P. When plastic packaging should be preferred: Life cycle analysis of packages for fruit and vegetable distribution in the Spanish peninsular market. Resour Conserv Recycl. 2020;155(104666):1-8. https://doi.org/10.1016/j.resconrec.2019.104666 [ Links ]
39. Bez J, Heyde M, Goldhan G. Waste treatment in product specific life cycle inventories. Int J Life Cycle Assess. 1998;3(2):100-105. https://doi.org/10.1007/BF02978497 [ Links ]
40. Jolliet O, Margni M, Charles R, Humbert S, Payet J, Rebitzer G, et al. IMPACT 2002+: A new life cycle impact assessment methodology. Int J Life Cycle Assess. 2003;8:324-330. https://doi.org/10.1007/BF02978505 [ Links ]
41. Zhang R, Ma X, Shen X, Zhai Y Zhang T, Ji C, et al. PET bottles recycling in China: An LCA coupled with LCC case study of blanket production made of waste PET bottles. J Environ Manag. 2020;260(110062):1-10. https://doi.org/10.1016/j.jenvman.2019.110062 [ Links ]
42. Macrotrends LLC. South Africa metro area population 1950-2020 [webpage on the Internet]. c2020 [cited 2020 Jun 07]. Available from: https://www.macrotrends.net/cities/22486/johannesburg/population [ Links ]
43. Grant T, James KL, Lundie S, Sonneveld K. Stage 2 report for life cycle assessment for paper and packaging waste management scenarios in Victoria [document on the Internet]. c2001 [cited 2020 Jul 28]. Available from: https://docplayer.net/144697950-Stage-2-report-for-life-cycle-assessment-for-paper-and-packaging-waste-management-scenarios-in-victoria.html [ Links ]
44. Chilton T, Burnley S, Nesaratnam S. A life cycle assessment of the closed-loop recycling and thermal recovery of post-consumer PET. Resour Conserv Recycl. 2010;54(12):1241-1249. https://doi.org/10.1016/j.resconrec.2010.04.002 [ Links ]
45. Langenhoven B, Dyssel M. The recycling industry and subsistence waste collectors: A case study of Mitchells Plain. Urban Forum. 2007;18(1):114-132. https://doi.org/10.1007/BF02681233 [ Links ]
46. Schenck CJ, Blaauw PF. Living on what others throw away: A preliminary exploration into the socio-economic circumstances of people collecting and selling recyclable waste. UNISA's The Bright Site Project [document on the Internet]. c2010 [cited 2020 Jul 12]. Available from: https://www.researchgate.net/publication/269100683_Living_on_what_others_throw_away_An_exploration_of_the_socio_economic_circumstances_of_people_collecting_and_selling_recyclable_waste [ Links ]
47. Hayami Y Dikshit AK, Mishra SN. Waste pickers and collectors in Delhi: Poverty and environment in an urban informal sector. J Develop Stud. 2007;42(1):41-69. https://doi.org/10.1080/00220380500356662 [ Links ]
48. Schenck R, Blaauw PF. The work and lives of street waste pickers in Pretoria - A case study of recycling in South Africa's urban informal economy. Urban Forum. 2011;22:411-430. https://doi.org/10.1007/s12132-011-9125-x [ Links ]
49. Plastic SA. Key statistics from latest recycling report [webpage on the Internet]. c2019 [cited 2020 May 23]. Available from: https://www.plasticsinfo.co.za/2019/08/31/key-statistics-from-latest-recycling-report/ [ Links ]
50. Samson M. Reclaiming reusable and recyclable materials in Africa: A critical review of English language literature. WIEGO working paper (Urban Policies) No. 16 [document on the Internet]. c2010 [cited 2020 May 14]. Available from: https://www.wiego.org/sites/default/files/publications/files/Samson_WIEGO_WP16.pdf [ Links ]
51. Steenis ND, Van der Lans IA, Herpen E, Van Trijp HCM. Effects of sustainable design strategies on consumer preferences for redesigned packaging. J Clean Prod. 2018;205:854-865. https://doi.org/10.10167j.jclepro.2018.09.137 [ Links ]
52. Mcharek M, Hammadi M, Azib T, Laroucib C, Choley JY Collaborative design process and product knowledge methodology for mechatronic systems. Comput Ind. 2019;105:213-228. https://doi.org/10.1016/j.compind.2018.12.008 [ Links ]
53. De Coster R, Bateman R. Sustainable product development strategies: Business planning and performance implications. Proc IMechE B J Eng Manuf. 2012;226(10):1665-1674. https://doi.org/10.1177/0954405412455123 [ Links ]
 Correspondence:
Kunle Olatayo
Email: kunleo@uj.ac.za
Received: 17 Sep. 2020
Revised: 16 Apr. 2021
Accepted: 04 July 2021
Published: 29 Nov. 2021
Editor: Priscilla Baker
Funding: None

