


Services on Demand
Article
 English (pdf)
 Article in xml format
 Article references
Indicators

Related links
-
 Cited by Google
 -
 Similars in Google
Share

 Permalink
South African Journal of Science
On-line version ISSN 1996-7489
Print version ISSN 0038-2353
S. Afr. j. sci. vol.117 n.11-12 Pretoria Nov./Dec. 2021
http://dx.doi.org/10.17159/sajs.2021/8738
RESEARCH ARTICLE
A validated method for the analysis and profiling of 'nyaope' using gas chromatography - mass spectrometry
Pabalala M. MthembiI, II; Ellen M. MwenesongoleI, III; Michael D. ColeIV
IDepartment of Genetics, University of the Free State, Bloemfontein, South Africa
IISouth African Police Service Forensic Science Laboratory -Chemistry Section, Pretoria, South Africa
IIIDepartment of Chemical and Forensic Sciences, Botswana International University of Science and Technology, Palapye, Botswana
IVFaculty of Science and Engineering, Anglia Ruskin University, Cambridge, United Kingdom
ABSTRACT
Nyaope, a Tswana word for a mixture or 'mish-mash', describes a drug cocktail consisting of heroin, cannabis, and on occasion other controlled substances and warfarin. It is highly addictive with extremely unpleasant side effects caused by withdrawal from the drug. It is a problem drug especially in townships in South Africa. However, its prevalence in neighbouring southern African states and further afield is not yet known. There is currently no validated method for the analysis and comparison of nyaope. We describe a validated method for the gas chromatography - mass spectrometry analysis of nyaope so that within-batch and between-batch comparisons of nyaope can successfully be made for the first time. The validated method managed an accuracy within the range 80-120%, the precision was less than 20% for all analytes and managed linearity with R2>0.99. The detection limits for diamorphine, efavirenz, nevirapine and Δ9-tetrahydrocannabinol were 14.2, 18.6, 18.7 and 9.94 pg on column, respectively, and the limits of quantitation were 43.1, 56.3, 56.6 and 30.1 pg on column, respectively. The simulated and casework samples were successfully discriminated into original batches using the identified nyaope components, the unsupervised chemometric methods principal component analysis and hierarchical clustering, as well as chromatographic profiles.
SIGNIFICANCE:
• A validated method for the analysis and comparison of nyaope allows for data exchange between law enforcement agencies in South Africa and, provided the appropriate quality control measures are in place, between South Africa, neighbouring states and countries further afield. Additionally, public health measures can be put in place now that it is possible to use a validated method to determine the contents of nyaope.
Keywords: heroin, cannabis, nyaope, GC-MS, sample comparison
Introduction
Despite the first reports being in the early 2000s1,2, there remains a dearth of analytical chemistry and forensic science literature on the drug 'nyaope'. Nyaope, the name of which is derived from the Tswana word for mixture or 'mish-mash'2, is reported to be a mixture of powdered heroin, herbal cannabis and prescription antiretrovirals. It has also been reported to contain methamphetamine and warfarin, although some of these claims are disputed. An unpublished study reports a much wider range of drugs found in nyaope samples.3 In parts of South Africa, it is known as 'Woonga' (spelled 'Wunga' in Zulu).2 It has no single composition and mixtures follow trends4, although the predominant drug by mass is cannabis, followed by heroin. It is typically smoked after being mixed with tobacco.
Nyaope contains substances that have been controlled by the South African Drug and Drug Trafficking Act since1992. The name nyaope itself is a street name and therefore cannot be listed in the Act. It is inexpensive, with a single dose costing zAR20.00- 30.00 (circa USD2), and is widely used by the coloured and black communities in South African townships, by addicts who are sometimes as young as 12 or 13 years old.4 In a conversation with a colleague from the Portuguese criminal police (Alegre J 2019, oral communication, May 08), it was established that, although the drug is widely reported in South Africa, nothing is known of its distribution in neighbouring Mozambique, Zimbabwe, Botswana and Namibia, although there are anecdotal reports of its use in Angola. Because of the severe form that the addiction to nyaope can take, as well as the intensity and nature of the withdrawal symptoms, the social cost of this drug is enormous5 and addicts, including children, adopt chaotic lifestyles, such as dropping out of school and engaging in criminal activity including theft and prostitution, to fund their drug taking4.
The health risks associated with using nyaope are not well investigated but reports include restriction of growth and development in neonates6 and infective endocarditis7 which had been misdiagnosed elsewhere as pulmonary tuberculosis or pneumonia8. The vast majority of users are HIV positive.7 Other problems associated with nyaope use include damaged and infected veins, damaged heart valves, tissue infections, liver failure, kidney disease and lung problems.9 It therefore represents a significant public health risk.
In South Africa, at present, the criminal law punishes drug-related offences by a fine or imprisonment. The scale of the nyaope problem is difficult to quantify. At present, there are few representative surveys on drug use and abuse in South Africa. A recent policy brief summarises the rise in trafficking and abuse of heroin in South Africa.10 However, there is a growing thesis that to tackle the drug problem in South Africa, including that associated with nyaope, a number of approaches need to be taken.4 These approaches include (1) punishment of those manufacturing, trafficking and distributing the drug. Additionally, a forensic care process is proposed towards addressing the nyaope problem where (2) drug users are properly catered for by rehabilitation schemes, (3) the social circumstances of the drug users are changed and (4) a Public Health Awareness Scheme is implemented.4 Of course, these approaches could be applied to many drug problems across the globe.
In order that (1) and (4) can be achieved and supported, it is necessary to prove the identity of the drug as nyaope and then to identify and quantify the drug contents. In order to achieve this identification, a validated analytical method for the analysis of the contents of and comparison of nyaope is required - to date no such method has been developed. This is further exacerbated by the fact that the usual methods for cannabis analysis cause heroin to break down, and, conversely, those used for heroin cause cannabis to break down. Our previous studies have identified that two forensic science questions need to be identified before police operations involving nyaope commence11: how should nyaope be stored post-seizure11, and how should the drug be prepared prior to analysis by gas chromatography - mass spectrometry (GC-MS)12. In this paper, we present, for the first time, a validated analytical method for the identification of nyaope and quantification of the drug components, which addresses the analysis of heroin and cannabis when contained in the same drug sample. We further demonstrate that, with correct collection, storage and sample preparation, it is possible to compare nyaope samples, identify those which are related and discriminate between those that are not, using, for the first time, chemometric clustering techniques. How this method will assist law enforcement and public health officials in South Africa, and further afield, is also discussed.
Materials and methods
Chemicals
Tertiary butyl alcohol (t-BuOH) was purchased from Merck (Darmstadt, Germany), tetracosane 99% was purchased from Sigma-Aldrich (St Louis, MO, USA), isopropanol (i-PrOH)-AR grade was purchased from Associated Chemical Enterprise (Johannesburg, South Africa). Representative compounds, identified in casework samples of nyaope by the South African Police Service (SAPS), were used to validate the GC-MS method. Certified reference standards of A9-tetrahydrocannabinol (A9-THC) and diamorphine (both 1 mg/mL) were purchased from Cerilliant-Sigma Aldrich (Austin, TX, USA). Caffeine and phenacetin were purchased from the US-Pharmacopeia (Rockville, MD, USA) as USP powder reference standards while efavirenz and nevirapine were purchased from WHO International Chemical Reference Substances (Strasbourg, France) as ICRS powder reference substances.
Preparation of internal standards
The internal standard solution, tetracosane (C24), was prepared at a final concentration of 0.02 mg/mL in tertiary butyl alcohol. Tertiary butyl alcohol has previously been shown to be the solvent of choice for presenting nyaope extracts to the GC-MS.12 The internal standard solution was used to dilute the certified reference standards, and other samples, before GC-MS analysis.
Preparation of calibration standards
Stock solutions (1 mL at 1 mg/mL) of A9-THC in methanol and diamorphine in acetonitrile were placed in an amber GC-MS vial, evaporated to dryness under nitrogen and then re-dissolved in 1 mL of the internal standard solution to give stock solutions of 1 mg/mL. Phenacetin, caffeine, efavirenz and nevirapine were dissolved at concentrations of 1.03, 1.00, 0.998 and 1.05 mg/mL, respectively, in the internal standard solution. From these, 14 standards in the concentration range 0-1.0 mg/mL, at notional concentrations of 0, 0.001, 0.0025, 0.005, 0.0075, 0.01, 0.025, 0.05, 0.075, 0.1, 0.25, 0.5, 0.75 and 1.0 mg/mL were prepared.
Instrumentation
GC-MS analysis was carried out using an Agilent Technologies system (Chemetrix, RSA) consisting of a gas chromatograph, Agilent 7890A, and mass selective detector (Agilent 5975 CVL MsD) with an auto sampler 7683 B series (1 μL injection). Chromatographic separation was performed using a computer-controlled autosampler with a fused-silica capillary column HP-5MS (30 m x 0.25 mm i.d., film thickness 0.25 μm; J&W Scientific, Folsom, CA, USA). Splitless injection was used at 280 °C. The GC oven temperature programme consisted of an initial temperature of 100 °C for 0.4 min, raised to 290 °C at a rate of 60 °C/min, held at 290 °C for 2.4 min then raised to reach 316 °C at 60 °C/min and held for 3 min. The total run time was 9.4 min. High-purity helium (99.9995%) was used as the carrier gas, at a flow rate of 1 mL/ min. The MS parameters used were as follows: the interface temperature was 280 °C, the inlet temperature 250 °C, the ion-source temperature 230 °C, electron ionisation was achieved with a source voltage of 70 eV and the mass spectrometer (quadrupole) was used in scan mode. The spectra were recorded in the scan range (m/z) 35 to 550 amu, at a scan rate of 1 scan/s.
Method validation
The method was validated by determining the precision of the retention index of each compound, the linearity of detector response, the limit of detection and of quantitation, repeatability and the reproducibility of the measurements.13,14 The precision of the retention index was obtained for each compound (phenacetin, caffeine, efavirenz, nevirapine, Δ9-THC and diamorphine) by calculating the mean, standard deviation and relative standard deviation of the retention index, relative to tetracosane, for 10 replicate analyses.
Linearity of the detector response to the exemplar drugs was determined by preparation of calibration curves for samples in the concentration range 0.00-1.00 mg/mL. The regression equations for detector response relative to the internal standard, the value of R2and residual plot analysis were used to confirm linearity of detector response.
Limit of detection (LOD) and limit of quantitation (LOQ) were determined by the calibration curve slope using reference sample solutions with concentrations in the vicinity of the LOD15, namely 0.000, 0.001, 0.0025, 0.005, 0.01 and 0.05 mg/mL and the equations:
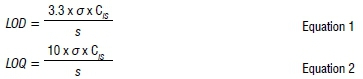
where σ=standard error of the measured response, S=slope of the regression line and CIS=concentration of the internal standard = 0.018 mg/mL
To measure the accuracy of the method (closeness to true concentration), 10 replicate measurements of standards of known concentrations were made, the experimental concentrations determined and Equation 3 applied:

Precision is a measure of the closeness of the analytical results obtained from a series of replicate measurements of the same measure under the conditions of the method. Intra-assay precision (repeatability) and inter-assay precision (reproducibility) were assessed using drug standard mixtures of phenacetin, caffeine, efavirenz, nevirapine, Δ9-THC and diamorphine at three concentration levels (0.01, 0.1 and 1.00 mg/mL). Repeatability was assessed by making 10 replicate analyses of the drug standards at three concentration levels and calculating the mean, standard deviation and relative standard deviation of the relative response to the internal standard.
Reproducibility was assessed by making five replicate analyses of the drug standards over five consecutive days at the three concentration levels, and calculating both within group (W) and between group (B) precision using one-way ANOVA (Group = Day)16:
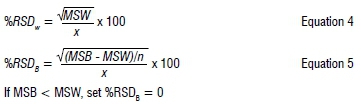
where RSD = relative standard deviation, X = grand mean of all observations, n = number of observations in group, MSW = mean of squares within group, MSB = mean of squares between groups.
Nyaope sample profiling and comparison
In order to investigate the validity of the method for nyaope sample identification and comparison, both simulated samples and casework samples of nyaope were analysed.
Street cannabis and heroin samples seized by the SAPS were used to prepare simulated nyaope samples. Three blind simulated samples were prepared by mixing a heroin street sample, a cannabis street sample, efavirenz tablets and nevirapine tablets, in different combinations and proportions, to mimic as closely as possible a typical street nyaope sample. The three mixtures were homogenised by grinding using a mortar and pestle. The samples were then further divided into six blind sub-samples each to give a total of 18 samples marked S1-S18. Homogenised samples which had a mass ranging between 12 mg and 14 mg were mixed with 3 mL of the internal standard solution (0.02 mg/ mL tetracosane in tertiary butyl alcohol) in a 20-mL head space vial. The mixture was sonicated for 15 min12,17,18, filtered into amber GC-MS vials and analysed in triplicate. Each of the extracts of the simulated samples S1-S18 was analysed at 0, 24, 48 and 72 h in order to confirm the stability of the extract once prepared.13 Additionally, chromatograms of members of each of the three groups were compared at the same time intervals to determine whether samples from the same parent batch could be discriminated after these time intervals. Finally, chromatograms from one member of each of the three groups were compared at these time intervals to demonstrate whether it is possible to discriminate between groups.
Five casework samples of nyaope were ground into a fine powder using a mortar and pestle. Sub-samples (circa 12-14 mg) of these street samples were placed in a 20-mL vial and extracted with 3 mL of the internal standard solution prior to analysis. Each of the casework samples was analysed in triplicate by GC-MS at t=0 after extraction. The chromatograms were compared to determine whether it was possible to discriminate between street samples. Each extract was then analysed after 24, 48 and 72 h to demonstrate stability of extracts of such samples. Semi-quantitation was conducted on caffeine, diamorphine and Δ9-THC for each of the five casework samples.
Two unsupervised chemometric methods - agglomerative hierarchical cluster analysis (HCA) and principal component analysis (PCA) - were performed on both the blind simulated and casework nyaope samples using the XLSTAT statistical and data analysis solution 2019 version. The HCA and PCA analysis were conducted for the samples analysed at 0, 24, 48 and 72 h.
Results and discussion
Compound identification - stability of retention indices
It is important that retention indices are stable for a given analytical method if drug comparisons are to be made. The retention indices were evaluated over five days for each component. The stability data for representative components of nyaope are given in Table 1. The ANOVA test (single factor) demonstrated (Fcalc = 0.029, Fcrit = 4.965) that there was no significant difference between days and that the retention indices were stable.

The relative standard deviation (Table 1) for the retention indices of the compounds caffeine, diamorphine, efavirenz, nevirapine, phenacetin and Δ9-THC were all below 0.025%, further illustrating the stability of this parameter. Identification of components of nyaope can therefore be made on the basis of retention index and the mass spectrum of each separated compound.
Linearity of detector response
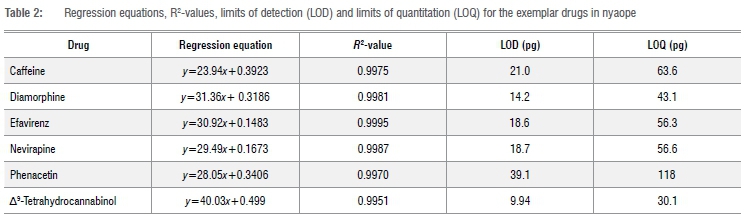
The detector response to standard compounds was linear over the concentration range investigated. The regression equations and R2-values are given for each of the components of nyaope measured (Table 2). All of the R2-values are above 0.99. This and analysis of residuals demonstrate that the detector response to these drugs is linear.
Limits of detection and quantitation
The detection limits and the limits of quantitation using this analytical method were determined as mass of the free drug on column and are given in Table 2. The detection limits varied between 9.94 pg and 39.1 pg on column and the limit of quantitation between 30.1 pg and 118 pg on column. The method is sufficiently sensitive to both detect these drugs in nyaope and quantitate them in a street sample.
Accuracy
Ten replicate analyses were performed for each drug at each of three known concentrations and the percentage accuracy of the measurement was determined. Accuracy figures were found to lie between 82% and 112%. These lie between the limits of 80% and 120% and are therefore considered accurate19-21, further validating the method.
Repeatability and reproducibility
Repeatability was assessed through 10 replicate analyses of the drugs at each of three different concentrations. The relative standard deviations of all analyses were found to lie below or at 15% (with nevirapine just above 15%, 0.01 mg/mL, RSD = 15.78%), demonstrating that the method is repeatable.22,23
Reproducibility was assessed through five replicate analyses of the drug standards. The relative standard deviations for both within-group and between group precision were found to lie below 15% (with caffeine and nevirapine just above 15%, 0.01 mg/mL, RSD = 15.01% and 15.19% respectively) demonstrating that the method is reproducible.14,19,20
On the basis of the data described above, and the recommendation of the UNODC that cannabis and heroin can be analysed by GC-MS, without derivatisation18,24, the method was deemed suitable for the analysis of the principal drug types in nyaope.
Nyaope sample profiling and comparison
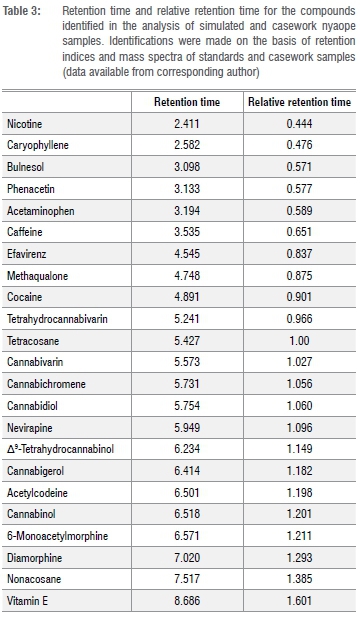
Each of the simulated samples was analysed after 0, 24, 48 and 72 h. The average peak area ratio (PAR) was determined for each of the simulated samples. The ANOVA of one of the samples gave Fcalc = 0.0106 < Fcrit = 2.798, demonstrating that there was no significant difference between the PAR over the 72 h. Retention time data are provided in Table 3. Pooled average response ratios for each of the batches were determined by averaging the PAR at t = 0, 24, 48 and 72 h. ANOVA of the samples from one of the batches using the F-test (single factor) gave Fcalc = 0.0268 < Fcrit = 2.342, demonstrating that there were no significant differences amongst the PARs for the samples belonging to the same batch over the 72 h autosampler storage.
From the data obtained, it can be demonstrated that each compound of interest can be identified, and that their relative proportions do not change over a 72-h period once extracted from nyaope into tertiary butyl alcohol, thus confirming previous work.12 When each of the six samples for the three different simulated samples was analysed, it was found that the PAR, relating to each batch, could not be separated. It is therefore now possible to relate samples of nyaope to each other when they have come from a once larger parent batch, as demonstrated by the PAR.
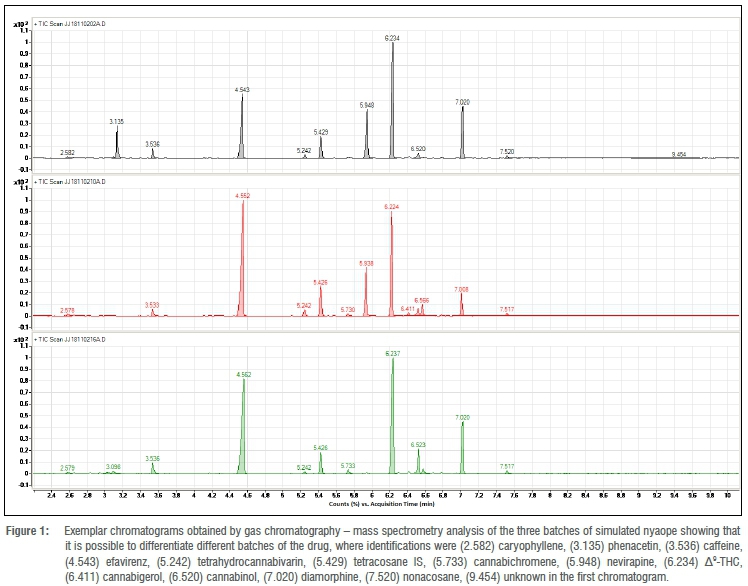
When separated by GC-MS, it was possible to differentiate between the three batches of simulated nyaope (Figure 1) on the basis of the chromatographic profile. This method of extraction and analysis allows, for the first time, analysis and comparison of nyaope samples by a forensic science laboratory.
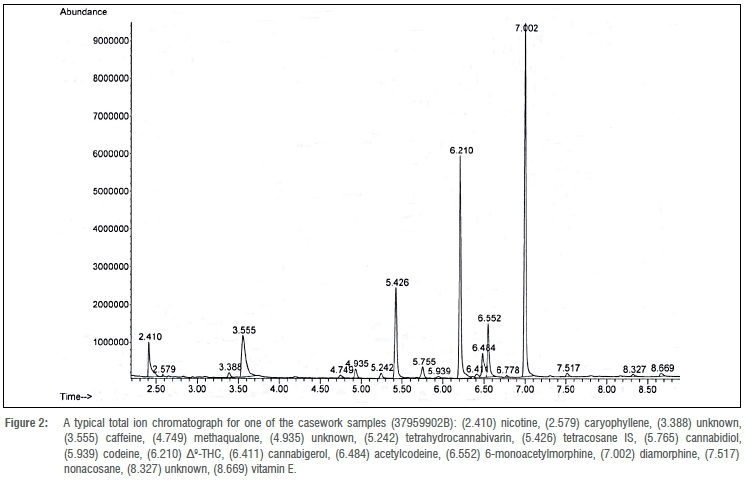
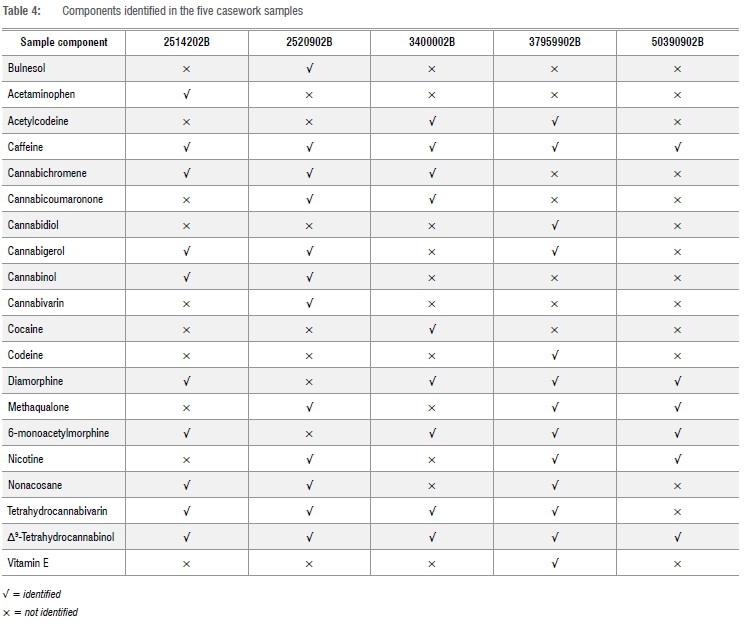
To demonstrate that the method could be applied to casework samples, five samples of nyaope (denoted as 2514202B, 2520902B, 3400002B, 37959902B and 50390902B) were analysed. Figure 2 is a typical total ion chromatograph for one of the casework samples (37959902B). The components identified in the other casework samples are summarised in Table 4. The components - cocaine, diamorphine, methaqualone and Δ9-THC - were identified on the basis of their retention time and mass spectral data using certified reference material. Caffeine was identified on the basis of retention time and mass spectral data using USP reference standards. Acetaminophen, acetylcodeine, bulnesol, cannabichromene, cannabicoumaronone, cannabidiol, cannabigerol, cannabinol, cannabivarin, codeine, caryophyllene, 6-monoacetylmorphine, nicotine, nonacosane, tetrahydrocannabivarin and vitamin E were identified by comparing the experimental mass spectral data with the NIST mass spectral library NIST 14. From the components identified, it can be seen that it is possible to discriminate between street samples of nyaope and that the method described can be applied to forensic casework.
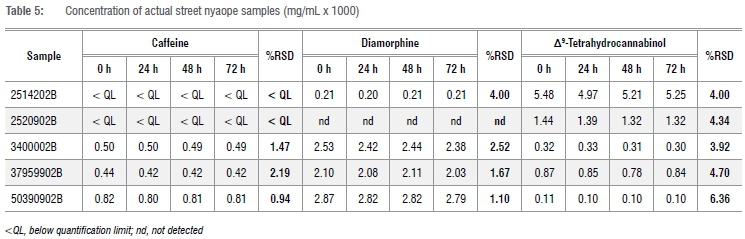
Semi quantitation of the five casework samples is summarised in Table 5, which shows the concentrations of the components caffeine, diamorphine and Δ9-THC. The caffeine concentration for samples 2514202B and 2520902B was below the limit of quantitation (63 pg on column). The pooled average concentration for each time interval of the three sub-samples in a batch was used to calculate the average %RSD, shown in Table 5, in order to determine if the concentrations were significantly different. The average %RSD was found to be <10% for all the components (caffeine, diamorphine and Δ9-THC) in the samples. This indicates that there was no significant difference between the concentrations of a particular component, over a period of 72 h once extracted into tertiary butyl alcohol. This suggests that all the components were stable for the 72 h of autosampler stability, confirming the previous finding.12
To demonstrate that the extracts of casework samples are stable for up to 72 h after extraction, a chromatographic analysis of the five casework samples was undertaken. The ANOVa of the PAR of one of the casework samples (37959902B) using F-test (single factor) gave Fcalc = 0.0429 < Fcrit = 3.285, demonstrating that there were no significant differences between the PAR over the 72 h. ANOVA of the pooled average response ratios gave Fcalc = 0.0429 < Fcrit = 3.285, demonstrating that there were no significant differences amongst the PARs for the samples belonging to the same group over the 72-h autosampler storage. From these data, it can be concluded that, as with simulated nyaope samples, casework samples of nyaope are stable up to 72 h after the preparation of drug extracts into tertiary butyl alcohol.
Hierarchical cluster analysis
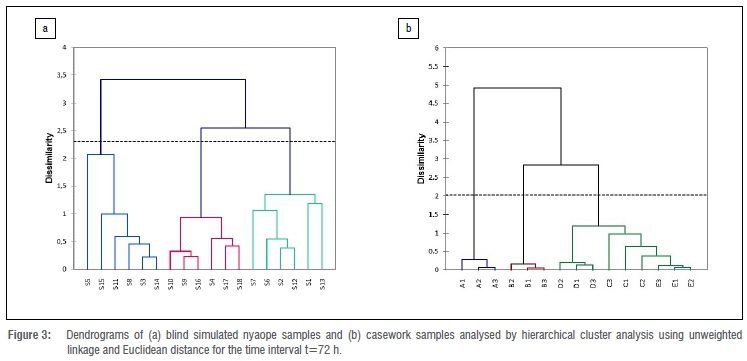
HCA, using agglomerative clustering and unweighted linkage, was conducted on the average concentrations of caffeine, diamorphine, efavirenz, nevirapine, phenacetin and Δ9-THC for each of the 18 blind simulated and the 5 casework nyaope samples. The matrices generated for the HCA clustering indicated in Table 6 for the time interval t=72 h, demonstrate that the HCA method was suitable for discriminating the samples into different classes.25 The matrices demonstrate that there was a maximum distance between Class 2 and Class 3 for the simulated samples and between Class 1 and Class 3 for the casework samples.
They further demonstrate that there was a minimum distance between Class 1 and Class 3 for the simulated samples and between Class 2 and Class 3 for the casework samples.
The results of the HCA performed on both the simulated and casework nyaope samples is also indicated in the dendrograms in Figure 3 for the time interval t=72 h. The results demonstrate that HCA successfully discriminated both the simulated and casework samples into three and five different batches, respectively. The HCA further demonstrated that both simulated and casework nyaope samples can still be discriminated even after 72 h of autosampler storage.
Principal component analysis
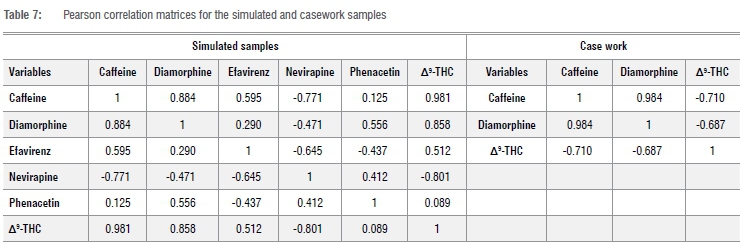
The correlation matrices for the PCA analysis of both simulated and casework nyaope samples (Table 7) indicate that all values are different from zero at a significance level of a=0.95 (two-tailed), which indicates that there is a linear correlation between the variables.26 The transpose of these correlation matrices are identical to the matrices themselves. As a result, their product would yield identity matrices, which demonstrates that the PCA is orthogonal.26 The PCA indicates that there are three principal components (F1, F2 and F3) for the simulated samples and one principal component (F1) for the casework samples that explain the variability of the variables.
The eigenvalues of these principal components were greater than 1.00. The total variability (%) of the principal components (F1 and F2) for the simulated samples was more than the minimum 70%, while the principal component F1 alone accounted for more than 70% of the variability for the casework sample. This further indicates that the two principal components, F1 and F2, for the simulated samples, and the single component F1 for the casework sample, are sufficient to explain the variability of the data set.27,28 As indicated in Figure 4, the PCA discriminated the simulated samples into three different batches and the casework samples into five different batches, similar to the observation made using the chromatographic profiles and HCA. The PCA further demonstrated that the simulated nyaope samples could still be discriminated even after 72 h of autosampler storage, confirming the stability of the samples once extracted into tertiary butyl alcohol.
Conclusions
We describe, for the first time, a method for the comparative analysis of nyaope. Provided that the samples are correctly seized and stored12, extracted into tertiary butyl alcohol11, and analysed within 72 hours11, this study demonstrates, for the first time, that quantitative comparisons of nyaope samples can be made. It also demonstrates, for the first time, that clustering techniques can be successfully applied to nyaope samples to identify different members of the same batch. This means that law enforcement agencies in the Southern African Development Community and beyond have, for the first time, the ability to analyse nyaope and compare forensic science data. This will allow distribution and trafficking routes to be identified and will assist in the determination of the origins of this drug. It does, however, require that decisions are made about how the samples will be treated prior to any investigative activity. It has been shown12 that the extraction of the drugs for analysis should be made as soon as possible after samples are seized, and this requires planning before any police action.
It is also interesting that whilst antiretrovirals have been reported to be present in nyaope, in the five casework samples analysed here, the antiretrovirals efavirenz and nevirapine were not identified. It may be that they were below the detection limit of the instrument or that they were indeed absent. However, the method does provide for the determination of these antiretrovirals where they are present at concentrations above the detection threshold. It should, however, be noted that other antiretrovirals cannot be detected by GC-MS, but that liquid chromatography - mass spectrometry (LC-MS) is a suitable method. However, LC-Ms is not currently readily available to SAPS.
This method assists law enforcement and public health officials in a number of ways. It assists the law enforcement agencies in the identification and comparison of nyaope samples. It allows the establishment, for the first time, of a database on the composition of nyaope. It allows exchange of analytical data between jurisdictions, provided that the necessary quality control protocols are in place. It also facilitates the prosecution of trafficking offences. In terms of public health, it allows determination of the drugs present in nyaope and better public health information to be disseminated amongst the users of nyaope. In turn, they may choose, having this information, to avoid using this drug cocktail.
Acknowledgements
We thank members of the European Network of Forensic Science Institutes (ENFSI) Drugs Working Group, and especially Joana Alegre, Portuguese Criminal Police, for helpful discussion and their interest in this work. We thank the University of the Free State, South Africa, for financial support and the South African Police Service (SAPS) for support in conducting this research and for allowing the findings to be disseminated.
Competing interests
The research was supported by the South African Police Service Forensic Science Laboratory, of which P.M.M. is an employee. E.M.M. and M.D.C. have no conflicts of interest to declare.
Authors' contributions
PM.M.: Conceptualisation, methodology, data collection, writing -original draft, review and editing. E.M.M.: Supervision, writing - original draft, validation, review and editing. M.D.C.: Supervision, writing -original draft, validation, review and editing.
References
1. Mokwena K. 'Consider our plight': A cry for help from nyaope users. Health SA Gesondheid. 2016;21:137-142. https://doi.org/10.1016/j.hsag.2015.09.001 [ Links ]
2. Grelotti DJ, Closson EF, Smit JA, Mabude Z, Matthews LT, Safren SA, et al. Whoonga: Potential recreational use of HIV antiretroviral medication in South Africa. AIDS Behav. 2014;18:511-518. https://doi.org/10.1007/s10461-013-0575-0 [ Links ]
3. Mokwena KE. The novel psychoactive substance 'nyaope' brings unique challenges to mental health services in South Africa. Int J Emerg Ment Health Hum Resil. 2015;17(1):251-252. https://doi.org/10.4172/1522-4821.1000152 [ Links ]
4. Monyakane MM-EM. A rehabilitative South African criminal law response to nyaope, drug addiction: A recommendation for health oriented nyaope drug weaning. Res Pediatr Neonatol. 2018;3(1):206-214. http://dx.doi.org/10.31031/rpn.2018.03.000554 [ Links ]
5. Masombuka J. Children's addiction to the drug 'nyaope' in Soshanguve Township: Parents' experiences and support needs [thesis]. Pretoria: University of South Africa; 2013. http://hdl.handle.net/10500/11903 [ Links ]
6. Thomas R, Velaphi S. Abuse of antiretroviral drugs combined with addictive drugs by pregnant women is associated with adverse effects in infants and risk of resistance. S Afr J Child Health. 2014;8(2):78-79. https://doi.org/10.7196/sajch.734 [ Links ]
7. Meel R, Essop MR. Striking increase in the incidence of infective endocarditis associated with recreational drug abuse in urban South Africa. S Afr Med J. 2018;108(7):585-589. https://doi.org/10.7196/samj.2018.v108i7.13007 [ Links ]
8. Chambers D. 10 die after destroying their hearts by mainlining nyaope. TimesLive South Africa. 2018 July 02. Available from: https://www.timeslive.co.za/news/south-africa/2018-07-02-10-die-after-destroying-their-hearts-by-mainlining-nyaope/ [ Links ]
9. Recovery Direct. Cape Town's Top Whoonga / Nyaope Rehab Centre [webpage on the Internet]. No date [cited 2019 Jun 06]. Available from: https://www.recoverydirect.co.za/drug/whoonga-addiction/ [ Links ]
10. Haysom S. Hiding in plain sight: Heroin's stealthy takeover of South Africa. ENACT Heroin Policy Brief. 2019 April 11. Available from: https://enactafrica.org/research/policy-briefs/hiding-in-plain-sight-heroins-stealthy-takeover-of-south-africa [ Links ]
11. Mthembi PM, Mwenesongole EM, Cole MD. Chemical profiling of the street cocktail drug 'nyaope' in South Africa using GC-MS II: Stability studies of the cannabinoid, opiate and antiretroviral components during sample storage. Forensic Sci Int. 2019;300:187-192. https://doi.org/10.1016/j.forsciint.2019.04.040 [ Links ]
12. Mthembi PM, Mwenesongole EM, Cole MD. Chemical profiling of the street cocktail drug 'nyaope' in South Africa using GC-MS I: Stability studies of components of 'nyaope' in organic solvents. Forensic Sci Int. 2018;292:115-124. https://doi.org/10.1016/j.forsciint.2018.08.001 [ Links ]
13. ICH Harmonised Tripartite Guideline: Validation of analytical procedures: Text and methodology, Q2 (R1) [document on the Internet]. c2005 [cited 2019 Jul 07]. Available from: http://www.ich.org/fileadmin/Public_Web_Site/ICH_Products/Guidelines/Quality/Q2_R1/Step4/Q2_R1_Guideline.pdf [ Links ]
14. UNODC. Guidance for the validation of analytical methodology and calibration of equipment used for testing of illicit drugs in seized materials and biological specimens. Vienna: United Nations; 2009. [ Links ]
15. Bonfilio R, Cazedey ECL, De Arañjo MB, Salgado HRN. Analytical validation of quantitative high-performance liquid chromatographic methods in pharmaceutical analysis: A practical approach. Crit Rev Anal Chem. 2012;2:87-100. https://doi.org/10.1080/10408347.2012.630926 [ Links ]
16. Skoog DA, West DM, Holler FJ, Crouch SR. Fundamentals of analytical chemistry. 8th ed. Toronto: Brooks/Cole - Thomson Learning Inc.; 2004. [ Links ]
17. Ahmad UK, Muniandy Y Hassan MS. Physical analysis and chemical profiling of illicit herbal cannabis using multivariate analysis. Malaysian J Forensic Sci. 2005;5(1):26-34. http://forensics.org.my/mjofs/pdf/fssmVol.5No.1/Article%2005.pdf [ Links ]
18. United Nations Office on Drugs and Crime. Recommended methods for the identification and analysis of cannabis and cannabis products. Vienna: United Nations Publications; 2009. [ Links ]
19. Peters FT, Drummer O H, Musshoff F. Validation of analytical methods. Forensic Sci Int. 2007;165(2-3):216-224. https://doi.org/10.1016/j.forsciint.2006.05.021 [ Links ]
20. González O, Blanco ME, Iriarte G, Bartoloméd L, Maguregui MI, Alonso RM. Bioanalytical chromatographic method validation according to current regulations, with a special focus on the non-well defined parameters limit of quantification, robustness and matrix effect. J Chrom A. 2014;1353:10-27. https://doi.org/10.1016/j.chroma.2014.03.077 [ Links ]
21. Kadiana N, Raju KSR, Rashid M, Malika MY Taneja I, Wahajuddin M. Comparative assessment of bioanalytical method validation guidelines for pharmaceutical industry. J Pharm Biomed Anal. 2016;126:83-97. https://doi.org/10.1016/j.jpba.2016.03.052 [ Links ]
22. TarcomnicuI I, Van Nuijs AL, Simons W, Bervoets L, Blust R, Jorens PG, et al. Simultaneous determination of 15 top-prescribed pharmaceuticals and their metabolites in influent waste water by reversed-phase liquid chromatography coupled to tandem mass spectrometry. Talanta. 2011;83:795-803. https://doi.org/10.1016/j.talanta.2010.10.045 [ Links ]
23. Karolak S, Nefau T, Bailly E, Solgadi A, Levia Y Estimation of illicit drug consumption by waste water analysis in Paris area (France). Forensic Sci Int. 2010;200(1-3):153-160. https://doi.org/10.1016/j.forsciint.2010.04.007 [ Links ]
24. United Nations Office on Drugs and Crime - Laboratory and Scientific Section. Methods for impurity profiling of heroin and cocaine: Manual for use by national drug testing laboratories. Vienna: United Nations Publications; 2005. [ Links ]
25. Hennig C. Dissolution point and isolation robustness: Robustness criteria for general cluster analysis methods. J Multivar Anal. 2008;99(6):1154-1176. https://doi.org/10.1016/j.jmva.2007.07.002 [ Links ]
26. Shlens J. A tutorial on principal component analysis [document on the Internet]. c2005 [cited 2020 Mar 22]. Available from: http://www.cs.cmu,edu/~elaw/papers/pca.pdf [ Links ]
27. Kaiser H. A second generation little jiffy. Psychometrika. 1970;35(4):401-415. https://doi.org/10.1007/bf02291817 [ Links ]
28. Jolliffe IT, Cadima J. Principal component analysis: A review and recent developments. Philos Trans R Soc A. 2016;374, Art. #20150202. http://dx.doi.org/10.1098/rsta.2015.0202 [ Links ]
 Correspondence:
Pabalala Mthembi
Email: mthembim@saps.gov.za
Received: 07 Aug. 2020
Revised: 15 Apr. 2021
Accepted: 04 July 2021
Published: 29 Nov. 2021
Editor: Priscilla Baker
Funding: University of the Free State

