


Services on Demand
Article
 English (pdf)
 Article in xml format
 Article references
Indicators

Related links
-
 Cited by Google
 -
 Similars in Google
Share

 Permalink
South African Journal of Science
On-line version ISSN 1996-7489
Print version ISSN 0038-2353
S. Afr. j. sci. vol.117 n.9-10 Pretoria Sep./Oct. 2021
http://dx.doi.org/10.17159/sajs.2021/8921
RESEARCH ARTICLE
Quantifying economic activity in the informal recycling sector in South Africa
Linda GodfreyI, II
IWaste RDI Roadmap, Council for Scientific and Industrial Research, Pretoria, South Africa
IIUnit for Environmental Sciences and Management, North-West University, Potchefstroom, South Africa
ABSTRACT
Informal waste reclaimers are a key part of South Africa's recycling economy, being responsible for around 51% of all paper and packaging waste collected in South Africa in 2017. Active in the waste and recycling landscape for more than three decades, their activity predates the earliest voluntary paper and packaging Extended Producer Responsibility schemes. However, these voluntary schemes have been instrumental in scaling South Africa's recycling economy. Investment by brand owners, retailers, converters and recyclers has helped develop local end-use markets, creating a demand for paper and packaging recyclables and a resultant increase in their collection. An analysis of tonnage and price data shows that the mean estimate of money paid by the private sector to the informal waste sector through the purchase of recyclables at intermediaries such as buy-back centres, was ZAR625 million in 2012, increasing to ZAR872 million in 2017. This private sector 'investment' in the local recycling economy has led to direct and indirect job creation and improved livelihoods, particularly for a large, well-established and effective informal waste sector, and has indirectly funded municipal waste diversion strategies, saving municipalities in both the collection and disposal of waste.
SIGNIFICANCE:
• Informal waste reclaimers make a significant contribution to the diversion of paper and packaging recyclables from landfill to recycling in South Africa.
• Limited information exists on the earnings of informal reclaimers.
• This paper provides new insights on the annual financial payments made by the private sector to informal reclaimers for the collection of recyclables.
Keywords: informal waste reclaimers, earnings, recycling, Extended Producer Responsibility
Introduction
South Africa's 2nd National Waste Management Strategy1 set the goal that 'all metropolitan municipalities, secondary cities and large towns have initiated separation at source programmes' by 2016, with '25% of recyclables diverted from landfill sites for re-use, recycling or recovery'. This goal was not achieved, with only a handful of cities and towns to date having implemented separation-at-source programmes, none of which cover the full spatial extent of the city or town. However, informal waste reclaimers, also referred to as waste pickers, have operated in this space for years, collecting recyclables through what Samson2 calls 'separation-outside-source'.
Informal waste reclaimers have been active in the collection of paper and packaging recyclables in South Africa for more than three decades, with early policy documents such as the 1st National Waste Management Strategy3 and the White Paper on Integrated Pollution and Waste Management4 referencing their activity in the waste sector. Some of the earliest research on the informal waste sector in South Africa is thought to be that of De Kock5 and Naidoo6, who recognised waste picking as a means of survival for the 'unemployed, urban poor' who had no alternative means to financially support themselves and their families.
However, informal waste reclaimers play a key, although largely unrecognised, role in the South African recycling value chain.2,7,8 They provide an important bridge between the municipal service chain and the formal, private sector value chain in developing countries, effectively moving 'waste' from kerbside and landfill into the recycling economy.9,10 Early data published by the packaging sector, suggested that 80-90% (by weight) of post-consumer paper and packaging collected in South Africa in 2014, was done so by informal waste reclaimers at little to no cost to government or business.10,11
Recycling has been taking place in South Africa for many decades. Steelrec, the predecessor to Collect-a-Can which supports the collection and recycling of used beverage cans, was established in 1976 by Metal Box and Crown Cork (the predecessors of Nampak and ArcelorMittal).12,13 Waste sorting facilities in major metropolitan areas such as Johannesburg and Pretoria were already operating in the 1970s.14 However, as noted by Collect-a-Can13, local end-use markets were limited in the 1970s, resulting in the stockpiling of beverage cans. Early paper and packaging (input) recycling rates were low, typically <20% in 1990, with the exception of paper which had already reached a recovery rate of 29%.10
For many waste streams, recycling is a negative value-added process requiring some form of market intervention, such as subsidies.15-17 This is often due to the cost of collection, which accounts for a disproportionate share of the overall cost of recycling.16 As noted by Nahman18, the purpose of Extended Producer Responsibility (EPR) is, amongst others, to provide funding for the provision of incentives, subsidies and infrastructure to increase the supply of recyclables. As with recycling economies in many developed countries, the South African paper and packaging recycling economy has been subsidised by brand owners, converters and retailers through a number of voluntary ePr schemes, managed by Producer Responsibility Organisations (PROs)19 such as PETCO, Polyco, FibreCircle, MetPac and TGRC. The earliest established PROs in South Africa include Collect-a-Can, established in 1993, and PETCO, which was established in 2004. Collect-a-Can was able to increase beverage can collection rates from 18% in 1993 to 72% in 2015.20 Since the establishment of PETCO, post-consumer bottle PET recycling increased from 16% in 2005 to 55% in 2016.21 Prior to 2000, only around 2% of PET was collected annually for recycling. According to the Sustainability Business Handbook22: 'At the time, PET recycling was a small-scale and uncoordinated activity that functioned without any industry direction or intervention.'
While the informal collection of recyclables predates the establishment of voluntary EPR schemes in South Africa, it appears that these EPR schemes, and the mandated PROs, were able to significantly scale-up recycling activities, by directing private sector funding into the development of local recycling infrastructure and local end-use markets. This created demand for recyclables, further fuelling collection and growing local recycling rates. As at 2017, an estimated 58.2% of paper and packaging put into the South African market was collected for recycling.10,19 This investment in the local recycling industry is expected to continue as national government moves to implement mandatory EPR. The draft Paper and Packaging Industry Waste Management Plan submitted to government outlined a planned investment of ZAR2.85 billion over the period 2019-2023.19
The informal waste sector has, however, asserted that it too has been subsidising South Africa's recycling economy, with little compensation. As noted by Mr Kodisang23 of WIEGO,
The invisible subsidy we don't see, is the subsidy of free labour of our informal waste reclaimers, a marginalized sector of our community forced to seek out a livelihood through the resource value only from the sale of recyclables. We can't have a recycling industry based on the free labour of poor people, this has to change.
Informal reclaimers have, to date, typically only been paid the market-related, although highly variable, resource value upon sale of recyclables at intermediaries such as buy-back centres. Informal reclaimers are not paid for the collection service they provide, unlike many formal collectors. This issue of compensation for the currently free 'labour costs' of South Africa's informal waste sector, is addressed in the Waste Picker Integration Guideline for South Africa24, and is currently the subject of a number of pilot projects. However, it is likely that payment for both the resource value and collection service will have significant cost implications for South Africa's recyclers, and ultimately producers.
A number of studies have explored the individual daily, weekly or monthly earnings of waste reclaimers in South Africa.7,25,26,27 However, the author is unaware of research that has attempted to quantify the total annual payment made by the private sector to the informal waste sector. In this paper, therefore, an attempt is made to calculate the amount of money paid to the informal waste sector in South Africa, through intermediaries such as buy-back centres. Framed differently, the paper addresses the question: How much money has the informal waste sector earned through value-creation from paper and packaging recyclable waste in South Africa?
Methods, assumptions and data sources
To determine the payments made to the informal waste sector, tonnage and price data were sourced for South Africa. Because price data formed the limiting data set, the calculations were made for the years 2012 and 2017. Further information on each of the data sets is provided in the following sections.
Tonnages collected
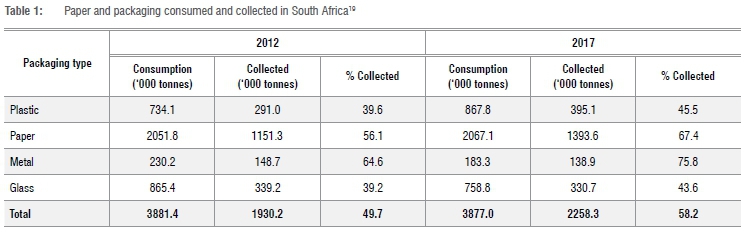
Accurate, reliable waste data in South Africa, like most developing countries, are limited.28,29 As such, data on the tonnages of paper and packaging recyclables collected in South Africa in 2012 and 2017 were sourced from industry19,30 (Table 1).
The data provided annually by BMi Research is for high-level paper and packaging categories. As the price data were available for sub-categories, further data on waste tonnages were sourced from the individual PROs, through their annual reports (Table 2).

Plastic
High-level plastic data were sourced from BMi30 and Packaging SA31, with the disaggregated data by polymer type, sourced from Plastics SA32,33. For 2012, both packaging and non-packaging tonnages were used.32 The tonnages of waste plastic exported, as reported by Plastics SA, while it should be included in the calculations (as it was collected in South Africa despite the end-destination for reprocessing), could not be included, as the export tonnages were not assigned to specific polymer groups. The excluded export tonnages account for 5.2% of the waste plastic collected in 2012.
The 2017 collected plastics data were more challenging to obtain. The Plastics SA report33 notes 'Since 2015, plastics report on input figures, aligned with international reporting methods', which would suggest that all figures provided in the report are collection figures. However, the different figures provided in the report for (only) PET (67 872 recycled and 93 235 collected), suggests that the data in the report are in fact output (recycled) figures. As such, the BMi data for total plastic collected, total polyolefins collected and total PET collected were used.31 The total polyolefins figure was subdivided into the sub-polymers using the ratios of recycled tonnages, assuming the same 'wastage' across the different polyolefins.
Paper
Detailed tonnages for the various sub-grades of paper were accessed from the Paper Recycling Association of South Africa.34,35 It is noted that there are minor discrepancies in tonnage data between BMi, Packaging SA and PRASA. For this reason, the data were sourced directly from the PRO responsible for paper recycling in South Africa. Only the 'paper recovered in South Africa' data were used (excluding imports), as it is unlikely that the local informal waste sector would have been involved in the collection of imported paper.
Metal
High level data for metals were also sourced from BMi. According to Packaging SA19: 'Since 2013, more than R1.258 billion in capital investments have been made by industry players ... to convert the beverage can industry from steel to aluminium'. As such, it has been assumed that the metal collection data given for 201230, do not yet include aluminium. The tonnages for steel/tinplate and aluminium for 2017 were sourced from BMi.31
Glass
Only one data set was provided by BMi for 'glass'.30,31 No further subdivision of glass by colour was used, as price data also were not available for sub-categories.
Prices for recyclables
Recyclable price data for the year 2012, as paid-for recyclables at buy-back centres across South Africa, were sourced from Viljoen36 and Viljoen et al.37 Price data for 2017 were sourced from Schenck et al.38 The 2012 data were captured at buy-back centres in 11 of South Africa's large cities, i.e. Bloemfontein, Cape Town, Durban, East London, Johannesburg, Kimberley, Mafikeng, Mbombela, Pietermaritzburg, Gqeberha (Port Elizabeth) and Pretoria. The 2017 data were captured at the provincial level. The average provincial price per paper and packaging grade was used here, i.e. Gauteng, Eastern Cape, Western Cape, KwaZulu-Natal, Mpumalanga, Free State and Northern Cape.
Where no price data were available for a specific sub-category of paper or packaging, the lowest value from another city/town or region was applied. As such, the resultant total values are likely to be conservative underestimates of the money paid to informal reclaimers.
The 2017 price data contained much greater detail in prices for subcategories compared to the 2012 data. However, the 2017 price detail for sub-categories could often not be used, as the matching tonnage data were not available, e.g. for 2017 prices, the average for the five different low-density plastic grades was used. Because there is no recorded data on the breakdown of the tonnages of clear/brown/green PET bottles collected in South Africa (Scholtz C 2020, written communication, 23 December) it is assumed that the majority of bottles collected (driven by the higher value) are clear PET bottles and as such, the prices for clear bottles have been used.
Informally collected recyclables
There is also very little reliable data on the number of informal waste reclaimers in South Africa, and the tonnages of recyclable waste collected by the informal sector. Available data published by BMi30,39,40 on the percentage of paper and packaging recyclables collected by informal trade, including sub-categories where available, are shown in Table 2. 'Informal trade' is defined by BMi40 as 'informal businesses that sell directly to you'.
The reports also note that 'informal trade is responsible for the bulk of collection'30,39. None of the PROs were able to provide accurate figures on the percentage of paper and packaging collected by informal waste reclaimers.
According to Plastics SA41, an estimated 70% in 2011 and 58% in 2012 of recyclable plastic waste was sourced from post-consumers and landfills. The Plastics SA report33 shows that, in 2017, this number had increased, as 'The largest quantity of recyclables, 74%, was obtained from landfill and other post-consumer sources'. As this is where informal reclaimers work, it is assumed that a high percentage of this post-consumer waste is collected by the informal sector. The same percentage (68%) was therefore used for plastic (with the exception of PET) for both 2012 and 2017. The percentage of PET plastic collected by informal reclaimers is reported as being higher, due to its higher value (prices). For paper, the BMi reports30,39 noted 'mostly informal' for paper collection (assumed here to be around 80%), which decreased to 30% in 2015. While paper and cardboard are highly sought after by informal reclaimers, the Paper Manufacturers Association of South Africa has suggested a maximum of 50% collection by the informal sector in 2017 for most paper grades, with corrugated paper as low as 33% (Molony J 2020, written communication, 10 January). These figures are based on what they know to be collected by the formal sector. Metals are reported as 30-40% collected by informal trade; however, this number may in fact be higher given the prices for metal, in particular aluminium, and the resultant demand by the informal sector. Using this figure of 30-40% will also likely result in an underestimate in the calculation of money paid to informal waste reclaimers.
Based on the information provided by the PROs, the contribution by the informal sector to the local recycling economy, in terms of the reported percentage of recyclable waste collected, appears to have declined over the years. It is not clear if this is due to improved data by the private sector, or whether this is a real decrease in the informal sector's contribution, due to erosion by the formal sector.
In terms of the number of informal reclaimers, the Waste Sector Survey42 indicated that the informal waste sector could be 2-3 times larger than the formal waste sector, at 60 000-90 000 people. The South African Department of Environmental Affairs estimated the number at 62 147.43 As there is no agreement on the number of informal reclaimers in South Africa, assessments have been made for two different scenarios -60 000 and 90 000.
Uncertainty
The uncertainty in the percentage of recyclable waste collected by the informal sector has an impact on the results presented in the following section. This is particularly evident for waste paper, where a significant decline in the percentage of paper collected by informal reclaimers between 2012 (80%) and 2017 (50%) was reported by the sector. For this reason, a range in figures is provided in the following section.
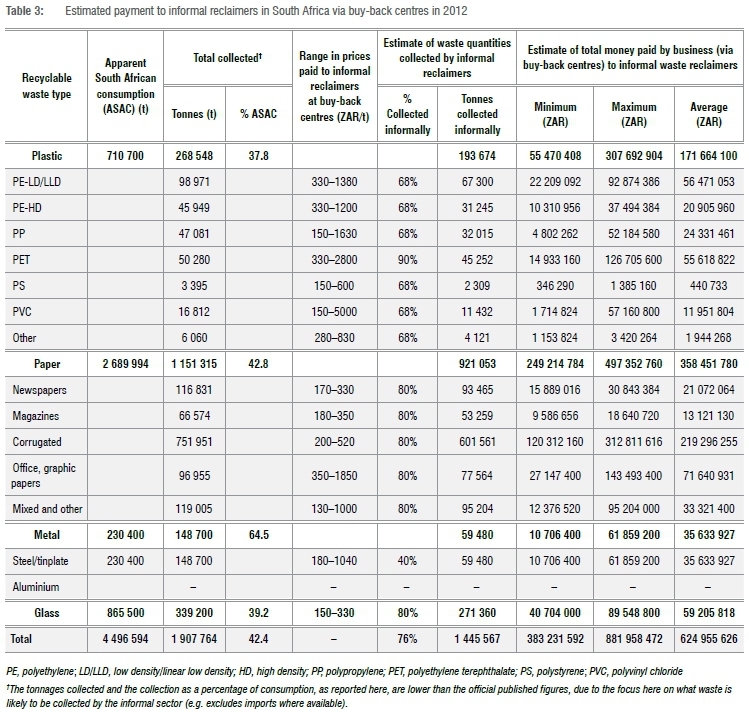
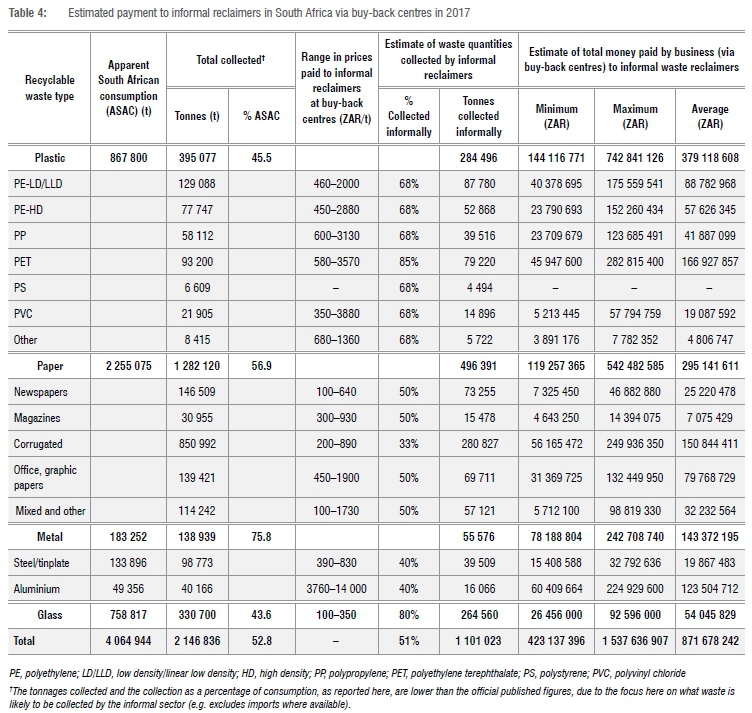
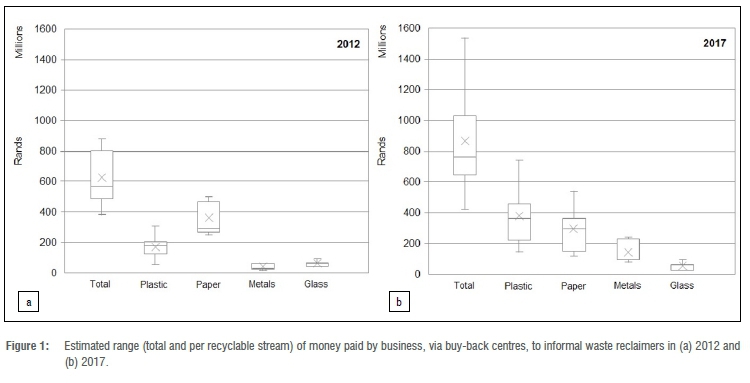
Results and discussion
Based on the above assumptions and available data sets, the results (presented in Tables 3 and 4 and Figure 1) show that between ZAR383 million and ZAR882 million was paid to the informal waste sector, via buy-back centres, in 2012. This increased to between ZAR423 million and ZAR1.54 billion in 2017. The mean estimate of total annual payments made to the informal waste sector in South Africa, via buy-back centres, is estimated to have increased from ZAR625 million in 2012 to ZAR872 million in 2017. Without data on the geographic distribution of collected recyclables, it is not possible to say where in this income range the answer lies. However, given that a large percentage of the paper and packaging recyclers reside in the major metropolitan areas, 'in close proximity to their incoming material sources'33, e.g. Gauteng, where prices are also generally higher than in other parts of the country, it is likely that these average values are conservative.
According to the data provided by industry, the total tonnages collected by the informal sector decreased from 1.45 Mt in 2012 to 1.10 Mt in 2017. While the overall percentage of paper and packaging collected by the informal sector in South Africa decreased from 76% in 2012 to 51% in 2017, the average money paid to informal reclaimers increased by around 40% over the same period, highlighting the increase in recyclable prices over this 5-year period. The waste streams which supported the largest average payments to informal waste reclaimers in 2017 were PET plastic, corrugated paper and aluminium (Table 4).
Given the uncertainty in the informal waste sector data, and the large variations in the price data, the external validity44 of this research was tested through triangulation with other studies. Because total countrywide payments made to informal reclaimers had not previously been calculated for South Africa, validity was tested against individual reclaimer earnings, thereby adopting a 'bottom-up' approach.
The estimated annual income per waste reclaimer in South Africa was calculated for two different scenarios (Table 5). At a conservative 60 000 informal waste reclaimers, the monthly income equates to ZAR868 in 2012, increasing to ZAR1211 in 2017. It is acknowledged that, while these are average amounts, the monthly income per reclaimer can vary significantly, depending on, for example, the number of hours worked; whether working at kerbside or on landfill; the geographic areas in which they work; and the type of material collected.26,36 Based on the buy-back centre price data used in this study, it is clear that there are significant differences in the earnings of waste reclaimers, given variation in prices of different recyclables as well as the geographic area within which they work.
Blaauw et al.45 note a range in the average monthly income of informal waste reclaimers working in Pretoria, South Africa (in 2010), based on a 'bad week' and a 'good week' of waste picking, of ZAR449 and ZAR1142 respectively. Viljoen et al.27, who presented a national study of the socio-economic dynamics and vulnerability of street waste pickers (between April 2011 and June 2012), calculated the mean informal reclaimer income 'usually earned for a day's waste' at ZAR72.11. While the number of days worked by informal reclaimers varies significantly26, a daily earning of ZAR72.11 could equate to a monthly income of around ZAR1440-R1730. Finally, a national study conducted by the South African Department of Environmental Affairs46 showed a mean monthly earning of informal waste reclaimers of ZAR1430. These studies have noted the long work days of informal reclaimers, often 8 h or more per day, and the long work weeks, often 5-7 days per week.26,27,46
While there is considerable variation in the income earned by waste reclaimers, a comparison with these studies26,27,45,46 suggests that this bottom-up triangulation approach provides findings of the same order of magnitude as the results from this study (Table 5). As comparison, the South African minimum wage47 of ZAR20 per hour, based on an 8-h working day, five days per week, would generate a minimum monthly income of ZAR3500 per month.
The apparent decrease in the tonnages of recyclables informally collected and the monthly income paid to reclaimers were also discussed with representatives of the African Reclaimers Organisation, to assess whether these modelled results were actually 'observed' on the streets of South Africa. The main findings were supported by the African Reclaimers Organisation, highlighting the growing risk to informal waste reclaimers. The erosion in the informal sector's contribution to South Africa's recycling economy was noted by the African Reclaimers Organisation as being due to greater involvement by formal actors, which are often contracted by local municipalities. This risk is further compounded by an increase in the number of informal reclaimers, due to an escalating unemployment rate, which creates greater competition for easily accessible material. Reclaimers noted that due to this 'formal sector erosion', they were forced to diversify into other materials, including different types of plastic. The increasing contribution of plastic to the recyclables collected by the informal sector is evident in the results (Tables 3 and 4). Plastic made up 13.4% of the paper and packaging recyclables collected by the informal sector in 2012, which increased to 25.8% in 2017. While the tonnages of paper and packaging recyclables collected by informal reclaimers appears to have decreased between 2012 and 2017, this may not have been immediately noticeable to reclaimers, due to the increase in prices paid by buy-back centres over the same period, supporting increased earnings. However, with the slowing in the local recycling economy in 2019, the impact of the COVID-19 pandemic in 2020 and the resultant drop in local prices, this 'price buffer' may be eroded, with significant implications for the livelihoods of informal waste reclaimers.
Conclusions
In conclusion, using two data sets, the tonnages of paper and packaging collected for recycling, and the prices of various sub-categories of paper and packaging paid at buy-back centres around the country, estimates were determined of the total amount of money paid to the informal waste sector in 2012 and 2017. The mean estimate of total money paid by the private sector to the informal waste sector, through the sale of recyclables at intermediaries such as buy-back centres and scrap dealers in South Africa, was ZAR625 million in 2012. This increased to ZAR872 million in 2017. These actions have resulted in the collection (formal and informal) of over 2 million tonnes of paper and packaging waste, and ultimately the diversion of this waste away from municipal landfills, and from the environment. This private sector expenditure, combined with the work of the informal waste sector, not only saves municipalities in landfill airspace (estimated at between ZAR309 million and ZAR749 million in 2014)11, but could also be considered an investment in municipal diversion strategies. However, if industry is to understand and harness the contribution of the informal and formal sectors to the South African recycling economy, and to better integrate informal reclaimers into the new mandatory EPR schemes, there is an urgent need for improved data collection.
Competing interests
I have no competing interests to declare.
References
1. South African Department of Environmental Affairs (DEA). National Waste Management Strategy [document on the Internet]. c2011 [cited 2019 Nov 14]. Available from: https://www.environment.gov.za/sites/default/files/docs/nationalwaste_management_strategy.pdf [ Links ]
2. Samson M. Whose frontier is it anyway? Reclaimer 'integration' and the battle over Johannesburg's waste-based commodity frontier. Capital Nat Social. 2020;31(4):60-75. https://doi.org/10.1080/10455752.2019.1700538 [ Links ]
3. South African Department of Environmental Affairs and Tourism (DEAT). National Waste Management Strategy Version D. Pretoria: DEAT; 1999. [ Links ]
4. South African Department of Environmental Affairs and Tourism (DEAT). White Paper on Integrated Pollution and Waste Management for South Africa. A policy on pollution prevention, waste minimisation, impact management and remediation. Government Gazette No. 20978, Notice No. 227; 2000. [cited 2021 Mar 22]. Available from: https://www.environment.gov.za/sites/default/files/legislations/integrated_pollutionand_wastemanagement_0.pdf [ Links ]
5. De Kock RE. Garbage picking as a strategy for survival: A case study of a subsector of the informal sector [master's dissertation]. Durban: University of Natal; 1986. https://ukzn-dspace.ukzn.ac.za/bitstream/handle/10413/6327/De%20Kock_Rachelle_1987.pdf?sequence=1&isAllowed=y [ Links ]
6. Naidoo JSG. A study of the garbage pickers within the Port Shepstone disposal site [honours dissertation]. Durban: University of Zululand; 1994. http://uzspace.unizulu.ac.za/handle/10530/676 [ Links ]
7. Schenck CJ, Blaauw PF, Swart EC, Viljoen JMM, Mudavanhu N. The management of South Africa's landfills and waste pickers on them: Impacting lives and livelihoods. Dev South Afr. 2019;36(1):80-98. https://doi.org/10.1080/0376835X.2018.1483822 [ Links ]
8. Viljoen JMM. Economic and social aspects of street waste pickers in South Africa [doctoral dissertation]. Johannesburg: University of Johannesburg; 2014. http://hdl.handle.net/10210/12273 [ Links ]
9. ECD. Working Party on Resource Productivity and Waste. In: Extended Producer Responsibility - Updated guidance ENV/EPOC/WPRPW(2015)16/ FINAL. Paris: OECD; 2016. [ Links ]
10. Godfrey L, Oelofse S. Historical review of waste management and recycling in South Africa. Resources. 2018;6(4):57. https://doi.org/10.3390/resources6040057 [ Links ]
11. Godfrey L, Strydom W, Phukubye R. Integrating the informal sector into the South African waste and recycling economy in the context of Extended Producer Responsibility. CSIR Briefing Note [document on the Internet]. c2016 [cited 2021 Mar 22]. Available from: https://wasteroadmap.co.za/wp-content/uploads/2020/03/informal_sector_2016.pdf [ Links ]
12. Nampak Limited. Annual report 2002 [webpage on the Internet]. c2002 [cited 2021 Mar 22]. Available from: http://www.nampak.com/Investors/Financial-Information [ Links ]
13. ArcelorMittal. A walk through history with Collect-a-Can [document on the Internet]. c2011 [cited 2021 Mar 22]. Available from: https://www.arcelormittalsa.com/Portals/0/A%20%20walk%20through%20history%20with%20Collect-a-Can.pdf [ Links ]
14. Noble RG. Solid waste research in South Africa. South African National Scientific Programmes report no. 4. Pretoria: Council for Scientific and Industrial Research; 1976. Available from: http://researchspace.csir.co.za/dspace/bitstream/handle/10204/2236/SANSP%20004%20.pdf?sequence=1&isAllowed=y [ Links ]
15. Matheson T. Disposal is not free: Fiscal instruments to internalize the environmental costs of solid waste. IMF Working Paper WP/19/283. Washington DC: International Monetary Fund; 2019. [ Links ]
16. Organisation for Economic Cooperation and Development (OECD). Extended Producer Responsibility: Updated guidance for efficient waste management. Paris: OECD Publishing; 2016. https://doi.org/10.1787/9789264256385-en [ Links ]
17. Pouikli K. Concretising the role of extended producer responsibility in European Union waste law and policy through the lens of the circular economy. ERA Forum. 2020;20:491-508. https://doi.org/10.1007/s12027-020-00596-9 [ Links ]
18. Nahman A. Extended producer responsibility for packaging waste in South Africa: Current approaches and lessons learned. Resour Conserv Recycl. 2010;54(3):155-162. https://doi.org/10.1016/j.resconrec.2009.07.006 [ Links ]
19. Packaging SA. Industry waste management plan: Federation of plans - Draft for public comment. Presented for: Packaging SA stakeholder engagement; 2018 July 20 - 2018 August 20. [ Links ]
20. Collect-a-Can. South Africa: Beverage can recovery rate 1993 to 2015 [webpage on the Internet]. No date [cited 2017 July 29]. Available from: http://www.collectacan.co.za/index.php/can-recycling/recovery-rate [ Links ]
21. PETCO. Future focus: A review of PETCO activities [webpage on the Internet]. c2016 [cited 2021 Mar 22]. Available from: https://petco.co.za/wp-content/uploads/2017/05/PETCO-2016-Annual-Review_web-version.pdf [ Links ]
22. Trialogue. The sustainable business handbook: Smart strategies for responsible companies. 4th ed. PETCO: Recycling PET plastic for a cleaner South Africa. Cape Town: Trialogue; 2007. [ Links ]
23. Kodisang E. Gauteng Waste to Wealth Seminar; 2019 June 07; Johannesburg, South Africa. [ Links ]
24. South African Department of Environment, Forestry and Fisheries (DEFF), Department of Science and Innovation (DSI). Waste picker integration guideline for South Africa. Pretoria: DEFF and DSI; 2020. Available from: https://wasteroadmap.co.za/wp-content/uploads/2021/02/Waste-Picker-Integration-Guidelines.pdf [ Links ]
25. Muller M. When necessity begets ingenuity: A study of informal waste recycling at Stellenbosch and Bellville, Cape Town [master's dissertation]. Cape Town: University of the Western Cape; 2015. Available from: http://etd.uwc.ac.za/xmlui/handle/11394/4945 [ Links ]
26. Mj D, Blaauw D, Schenck R. Waste pickers in informal self-employment: Over-worked and on the breadline. Dev South Afr. 2020;37(6):971-996. https://doi.org/10.1080/0376835X.2020.1770578 [ Links ]
27. Viljoen K, Blaauw D, Schenck R. Sometimes you don't make enough to buy food: An analysis of South African street waste pickers' income'. J Econ Financ Sci. 2018;11(1):a186. http://dx.doi.org/10.4102/jef.v11i1.186 [ Links ]
28. Godfrey L, Nahman A. Are developing countries ready for first world policy instruments? In: Proceedings of Sardinia Eleventh International Waste Management and Landfill Symposium; 2007 October 1-5; Cagliari, Italy. Available from: https://researchspace.csir.co.za/dspace/bitstream/handle/10204/846/Godfrey1_2007.pdf?sequence=3&isAllowed=y [ Links ]
29. UN Environment Programme. Global waste management outlook [webpage on the Internet]. c2015 [cited 2019 Dec 12]. Available from: https://www.unenvironment.org/resources/report/global-waste-management-outlook [ Links ]
30. BMi Research. Recycling assessment report 2012. Unpublished report 2013 [courtesy of Packaging SA]. [ Links ]
31. Packaging SA. Packaging market size and volumes collected, as compiled by BMI. Personal communication, Shabeer Jhetam, Packaging SA, May 2019. [ Links ]
32. Plastics SA. Plastics recycling survey 2012. Unpublished report 2013 [courtesy of Plastics SA]. [ Links ]
33. Plastics SA. National plastics recycling survey 2017. Unpublished report 2018 [courtesy of Plastics SA]. [ Links ]
34. Paper Recycling Association of South Africa (PRASA). South African paper recycling statistics for 2012 [document on the Internet]. c2013 [cited 2019 Dec 27]. Available from: https://recyclepaper.co.za/wp-content/uploads/2019/01/LB344-PRASA-Statistics-2012.pdf [ Links ]
35. Paper Recycling Association of South Africa (PRASA). Paper recycling in South Africa: Facts and statistics. Paper recycling statistics for 2017 [document on the Internet]. c2018 [cited 2019 Dec 27]. Available from: https://recyclepaper.co.za/wp-content/uploads/2019/01/Paper-recycling-statistics-2017-June-2018.pdf [ Links ]
36. Viljoen JMM. Economic and social aspects of street waste pickers in South Africa [doctoral dissertation]. Johannesburg: University of Johannesburg; 2014. [ Links ]
37. Viljoen J, Blaauw D, Schenck C. The opportunities and value-adding activities of buy-back centres in South Africa's recycling industry: A value chain analysis. Local Econ. 2019;34(3):294-315. [ Links ]
38. Schenck CJ, Barnes K, Viljoen JMM, Blaauw PF. Buy back research data sheet. Cape Town: University of the Western Cape; 2019. [ Links ]
39. BMi Research. Recycling assessment report 2014. Unpublished report 2015 [courtesy of Packaging SA]. [ Links ]
40. BMi Research. Packaging South Africa report 2015. Unpublished report 2016 [courtesy of Packaging SA]. [ Links ]
41. Plastics SA. Annual report 2012 [webpage on the Internet]. c2012 [cited 2019 Dec 23]. Available from: https://www.plasticsinfo.co.za/media-room/annual-reports/ [ Links ]
42. South African Department of Science and Technology (DST). South African Waste Sector - 2012. An analysis of the formal private and public waste sector in South Africa. A National Waste RDI Roadmap for South Africa: Phase 1 Status Quo Assessment. Pretoria: DST; 2013. [ Links ]
43. South African Department of Environmental Affairs (DEA). Report on the determination of the extent and role of waste picking in South Africa [document on the Internet]. c2016 [cited 2019 Dec 23]. Available from: http://sawic.environment.gov.za/documents/5413.pdf [ Links ]
44. Leedy PD, Ormrod JE. Practical research: Planning and design. 8th ed. Hoboken, NJ: Pearson Prentice Hall; 2005. [ Links ]
45. Blaauw D, Pretorius A, Schenck R. The economics of urban waste picking in Pretoria. Afr Rev Econ Financ. 2019;11(2):129-164. Available from: https://african-review.com/view-paper.php?serial=20200617191809-257880 [ Links ]
46. South African Department of Environmental Affairs (DEA). Report on the determination of the extent and role of waste picking in South Africa. Pretoria: DEA; 2016. Available from: http://sawic.environment.gov.za/documents/5413.pdf [ Links ]
47. National Minimum Wage Act, Act No. 9 of 2018, Republic of South Africa. Available from: https://www.gov.za/sites/default/files/gcis_document/201811/42060gon1303act9of2018.pdf [ Links ]
 Correspondence:
Linda Godfrey
Email: LGodfrey@csir.co.za
Received: 21 Sep. 2020
Revised: 13 Apr. 2021
Accepted: 13 Apr. 2021
Published: 29 Sep. 2021
Editor: Jenni Case
Funding: None

