


Servicios Personalizados
Articulo
 Inglés (pdf)
 Articulo en XML
 Referencias del artículo
Indicadores

Links relacionados
-
 Citado por Google
 -
 Similares en Google
Compartir

 Permalink
South African Journal of Science
versión On-line ISSN 1996-7489
versión impresa ISSN 0038-2353
S. Afr. j. sci. vol.117 no.9-10 Pretoria sep./oct. 2021
http://dx.doi.org/10.17159/sajs.2021/8035
RESEARCH ARTICLE
Estimating lightning NOx production over South Africa
Bathobile MasekoI; Gregor FeigII; Roelof BurgerIII
ISouth African Weather Service, Pretoria, South Africa
IISouth African Environmental Observation Network, Pretoria, South Africa
IIIUnit for Environmental Sciences and Management, North-West University, Potchefstroom, South Africa
ABSTRACT
Nitrogen oxides (NOx = NO + NO2) are toxic air pollutants and play a significant role in tropospheric chemistry. Global NOx hotspots are the industrialised regions of the USA, Europe, Middle East, East Asia and eastern parts of South Africa. Lightning is one of the many natural and anthropogenic sources of NOx to the troposphere. It plays a role in the formation of particulate matter and tropospheric ozone, which are both linked to harmful health and climate effects. The discourse on NOx over the southern African continent has mainly focused on anthropogenic sources. However, lightning is known to be a main source of tropospheric NOx globally. It is therefore important to understand its contribution to the national and global NOx budget. Data from the South African Lightning Detection Network were used to approximate the influence of lightning on the NOx load over the country, and to develop a gridded data set of lightning-produced NOx (LNOx) emissions for the period 2008-2015. The Network monitors cloud-to-ground lightning strikes; and theoretically has a detection efficiency of 90% and a location accuracy of 0.5 km. An emission factor of 11.5 kg NO2/flash was employed to calculate the LNOx budget of ~270 kt NO2/year. The calculated LNOx was 14% of the total NOx emission estimates published in the EDGAR v4.2 data set for the year 2008. The LNOx emission inventory will improve model performance and prediction, and enhance the understanding of the contribution of lightning to ambient NO2.
SIGNIFICANCE:
• The results show that both lightning and industrial NOx sources are essential in evaluating NOx and tropospheric O3 chemistry over South Africa. As a result they should both be considered in air quality modelling, to assist in air quality management planning.
• LNOx emissions are projected to increase with climate change, which may lead to an increase in tropospheric O3. Thus it is important to have an LNOx inventory, to be used as input into air quality modelling, as it will improve model performance and forecasting, and the understanding of the sensitivity of ambient pollution to changes in lightning emission.
• It will further inform chemical transport modelling so that the contribution of both natural and anthropogenic sources can be better understood.
Keywords: Lightning Detection Network, lightning flash density, nitrogen oxides, EDGAR, lightning NOx
Introduction
Poor air quality is a key environmental concern in South Africa, as it poses a serious threat to the well-being of the people of South Africa. Two of the key pollutants with adverse health and environmental impacts are nitrogen oxides (NOx= nitric oxide (NO) + nitrogen dioxide (NO2)) and particulate matter (PM). NOx have effects that are felt on humans and the environment, but they are also important reagents in tropospheric chemical processes that result in the creation of secondary atmospheric pollutants, like ozone (O3).
To alleviate the effects of air pollution, it is essential to have a comprehensive understanding of the sources of atmospheric pollutants to manage emissions. Management of air quality requires that the quantity of pollutants released into the atmosphere from sources be known, to determine how much of the emissions need to be reduced to achieve acceptable levels. Furthermore, the understanding of pollutant sources is essential for atmospheric chemical transport modelling, which is a valuable tool in comprehending the distribution of the pollutants and their potential impacts.1
Areas that are strongly affected by poor air quality in South Africa include the Mpumalanga Highveld, Vaal Triangle area, and the Waterberg Bojanala area. These areas have been affirmed as air quality priority areas in terms of Section 19 of the National Environmental Management: Air Quality Act.2The primary sources of pollution in these areas are coal-fired power plants, vehicles, domestic fuel burning, and metallurgical and petrochemical industries.3,4
Carbon monoxide (CO), ozone (O3), particulate matter (PM10 and PM25), nitrogen dioxide (NO2) and sulfur dioxide (SO2) are pollutants that are listed as being of particular concern in South Africa.5 These criteria pollutants are regulated by the National Ambient Air Quality Standards, as they have adverse health and environmental impacts.6 Nitrogen oxides are a focus of this study and are important in many ways:
• Long-term exposure to NO2 may reduce the functionality of the lungs.7
• NO2 increases the risk for children and the elderly of acquiring diseases such as bronchitis.8
• NOx is vital in climate and atmospheric chemistry; it reacts with volatile organic compounds in the presence of sunlight to form O3,9 which in the troposphere has adverse health impacts and is a greenhouse gas10.
• NOx is a precursor for the formation of secondary atmospheric aerosol, and it is involved in the formation of pollutants implicated in acid deposition.11
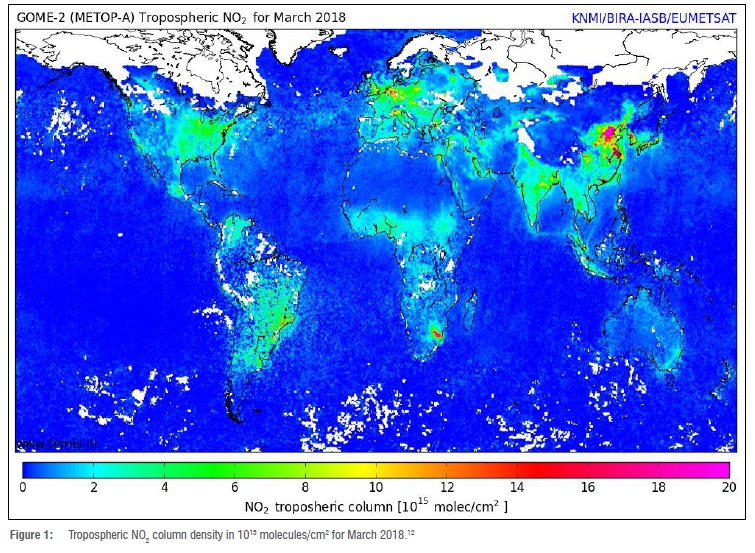
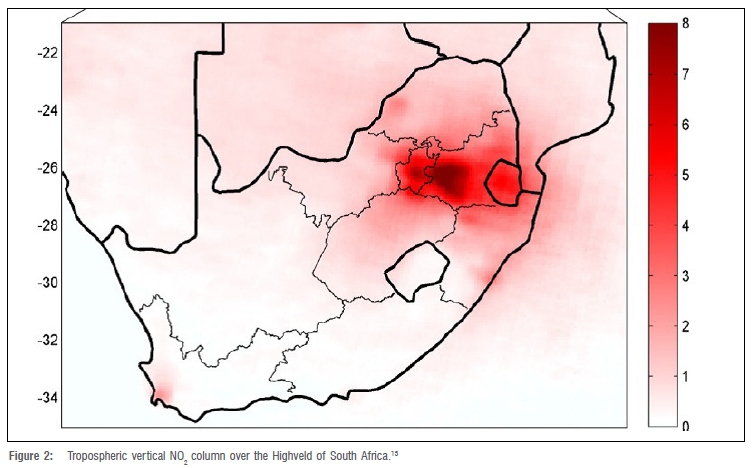
Satellite analysis of total NO2 vertical column density has identified some NOx hotspots over the industrialised areas of the USA, Europe, Middle East, East Asia and South Africa (Figure 1).12 South Africa's hotspot is over the northeastern parts of the country (the Highveld). This area contributes 90% of the industrial NOx emissions (Figure 2).13 The Mpumalanga Province of South Africa is one of the world's largest NO2 hotspots, with 12 coal-fired power plants situated in the area.14 Other sources of NOx in the Highveld region include petrochemical industries (particularly coal and gas to liquid facilities), metallurgical smelters, road transport, biomass burning, and human settlements.13 Approximately 8 million people in the Highveld priority area and neighbouring Gauteng conurbation are exposed to poor air quality.14
Nitrogen oxides are released into the atmosphere from anthropogenic and natural sources. Anthropogenic sources are industrial activities, fossil fuel combustion, transportation and power plants. Natural sources include lightning and soil.15 Globally, 60-70% of the total NOx budget is from anthropogenic sources rather than natural sources.16 Therefore, natural sources of NOx in general, and lightning in particular, have received less attention. This is mainly due to the high spatiotemporal variability associated with the detection of lightning.17 Whilst this remains the case, lightning-produced NOx (LNOx) comprises about 10-15% of the global NOx budget and is a leading source of NOx in the upper troposphere.18 Consideration of the dynamics of LNOx production is essential in understanding atmospheric chemical processes and the ambient concentrations of NOx and O3.19
Tropospheric O3 concentration depends on the imminent precursor emissions, together with the changes in meteorological variables, including temperature and atmospheric moisture.20 Various studies have suggested that future lightning activity is projected to intensify due to climate change. At the upper troposphere, LNOx is more efficient in producing tropospheric O3; thus, developing a regional LNOx emission inventory will assist in understanding the sensitivity of the increase in lightning activity, with climate change, to O3 in the troposphere.21-23
During a thunderstorm, LNOx is carried to the upper troposphere by convective updrafts, where it is more effective at generating O3 and has a longer lifespan than in the lower troposphere, where most of the anthropogenic NOx is released.24 Thus, to be able to provide a reliable tropospheric O3 budget, determination of an accurate LNOx load is vital.19 Estimation of LNOx is a challenge compared to that of anthropogenic emissions because the occurrence of lightning varies significantly in space and time.17 LNOx production estimates range within the [1-20] Tg (N) per year, and most estimates from different studies point toward the lower end of the production range of ~ 5 Tg (N)/year.25,26 Although the production points towards the lower end, the evidence is not enough to reject the upper end.19,27,28
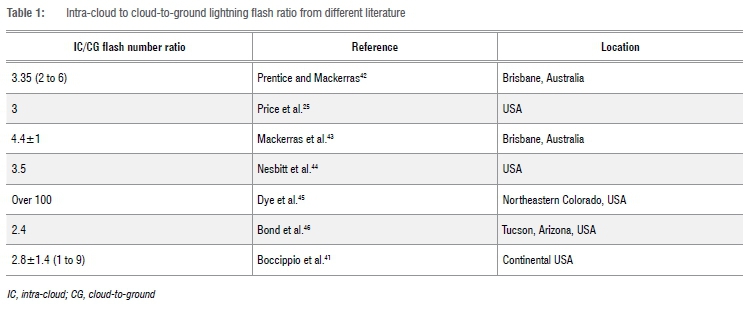
In estimating LNOx, a bottom-up approach is commonly used to measure (1) NOx production per energy unit, (2) energy discharged per flash and (3) flash frequency, and to estimate LNOx as the product of these quantities.17 Values cited in the literature range in magnitude, due to various assumptions and laboratory measurements. Another complication arises from the differences in cloud-to-ground (CG) and intra-cloud (IC) flashes. Previous studies suggested that IC flashes are more recurrent but less energetic than CG flashes (30% of total lightning), therefore less effective as NOx producers compared to CG flashes (IC produces 10% of the NOx produced by CG per flash).17,25,29
However, recent studies have proposed that IC flashes may dissipate similar energy to that of CG flashes, and thus IC flashes may produce the same amount of NOx as CG flashes.24,3033 This is contradictory to the common assumption that IC flashes produce less NOx than CG flashes, and highlights that, despite research efforts, there is still a great deal of uncertainty that remains regarding NOx production on a per flash basis, as well as the relative production by IC and CG flashes. Additionally, calculations for LNOx do not consider the effect that the water vapour has on the production of NOx. Peyrous and Lapeyre (1982) have shown that NOx production is strongly dependent on relative humidity.25
There is currently limited research regarding the role of the production of NOx by lightning in regional atmospheric chemistry. Of the studies that exist, most concentrate on the global LNOx production.23,34,35 The global studies of LNOx might not be applicable at the regional scale, because they may not capture the number of lightning strikes occurring within a region, the variability involving the production of NOx per flash, and the varying ratio of IC and CG flashes.
This study builds on the work that has been done by Ojelede et al.36 They conducted a study to estimate LNOx production over the Highveld of South Africa for the year 2002, utilising lightning data obtained from the Lightning Position and Tracking System (LPATS) network. The LPATS has a detection efficiency of 80% and consists of six sensors over the eastern half of the country. The study was done on a limited spatial extent, for a short study period.
In this study, we used lightning data from the South African Lightning Detection Network (SALDN) that is operated by the South African Weather Service. It has coverage over the whole country, with a 90% detection efficiency for CG lightning and location accuracy of 0.5 km, i.e. the SALDN can detect at least 90% of all CG flashes and position them within 0.5 km. Information from SALDN allows for the high-resolution identification of areas of intense lightning occurrence. It also provides an opportunity to investigate the spatiotemporal characteristics of LNOx production, which can then be used as an input into atmospheric chemical transport modelling and to improve air quality modelling. The data can also be used for validation of model simulations.
Data and methods
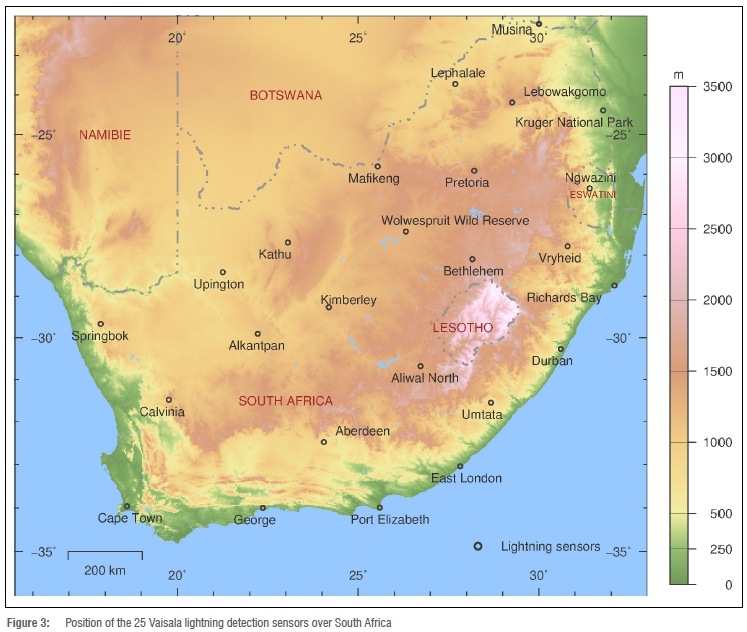
Lightning data from the SALDN were used in this research. The South African Weather Service installed the SALDN in 2005. Initially, it consisted of 19 sensors across South Africa but has since been expanded to 25 sensors including the one in eSwatini (Figure 3). The data are available from 2006 until the present; however, for this study, 8 years of data were used (2008-2015). The SALDN has a 90% detection efficiency of CG lightning and location accuracy of 0.5 km.37 There have been some changes since the sensors were operationalised in 2006. Sensors have been added, and others have been relocated to ensure optimal network performance and to overcome some environmental developments and noise sources near some of the sensors. The network expansion and relocation of some sensors in 2009/2010, 2011, as well as in 2015, have greatly enhanced the accuracy of the lightning detection network; the accuracy is based on the South African Weather Service in-house quality control software.
The South African Weather Service network uses Vaisala instruments including two types of sensors: LS7000 and LS7001 model sensors. The LS7000 sensors were installed prior to 2009, and the LS7001 sensors were installed from 2009 onwards. These sensors measure the electromagnetic signature of a lightning flash using a low-frequency bandwidth because the radiation from CG strokes is strongest within that band.38 As only a small percentage of IC flashes are measured at that bandwidth, the network sensors are primarily used to locate CG flashes.38
The methods used to determine the position of individual CG strokes are (1) magnetic direction finding (MDF) and (2) time of arrival (TOA).39 The combination of MDF and TOA techniques offers high detection efficiency and accurate location detection for CG lightning strokes from only two sensors. When the MDF and TOA methods are used individually, they require three or more sensors to detect lightning. It is impossible to get a 100% accurate position of lightning ground stroke even with combined MDF and TOA techniques. However, a degree of accuracy can be determined. For a thorough description of the method see Gill39.
The lightning data retrieved using the Fault Analysis and Lightning Location System, contain information such as date and time, latitude, longitude, and peak ampere. All CG lightning flash data were taken into consideration, regardless of polarity. Annual lightning ground flash density was calculated on 0.1° x 0.1° grid boxes over the country and is expressed in flashes/km2. The number of lightning flashes that were recorded by the SALDN over the 8 years (2008-2015) was counted for each individual grid box over the country. The sum of lightning flashes was divided by the area of the grid box to give the number of lightning flashes per square kilometre. To get the average annual lightning flash, the number of lightning flashes per square kilometre was divided by 8, as 8 years of data were considered. All grid boxes were considered, irrespective of the number of flashes. The Grid Analysis and Display System was used to display the lightning ground flash density map.
Information on total flash rate and production per flash is needed to quantify LNOx production. NOx emission factors from the literature and Cg lightning flash data from the SALDN were used. In South Africa, there have been no studies done to estimate the IC/CG ratio. Therefore, IC/CG ratio estimates from other countries were used for South Africa (Table 1). Lightning characteristics - the number of strokes per flash, channel length, and ratios of IC and CG flashes - can vary.34 Furthermore, the IC/CG flash ratio varies intensely during the life cycle of a thunderstorm. Therefore, it is assumed that such a ratio is a rough estimate as it is influenced by many factors, which include the severity and phase of a storm. Many studies have proposed a global annual mean IC/CG flash ratio of approximately 2 to 4.40 We used a IC/CG flash ratio of 3 - the most often used ratio for the mid-latitude to sub-tropic regions.25,41
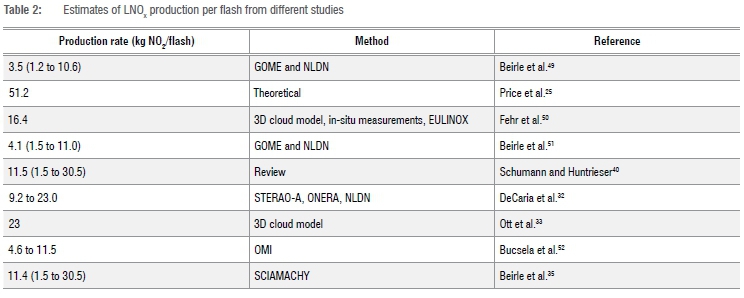
Various emission factors from different studies have been used (Table 2). We used the emission factor from Schumann and Huntrieser40 for this study. Beirle et al.35 referred to it as being the currently best-accepted emission factor. Using the emission factor from Schumann and Huntrieser40, one should bear in mind that global LNOx production might not be entirely applicable to regional LNOx production. Schumann and Huntrieser40 concluded that the most likely value of global LNOx production is 5 Tg N/year with an uncertainty of 2-8 Tg N/year. The global annual mean flash frequency is 44±5/second, and a mean production per flash is 250 moles No/flash (which is approximately 11.5 kg NO2/flash).
Based on previous studies24,32,33,47, we assumed that IC flashes generate the same amount of NOx as CG flashes.Total LNOx (kt NO2/year) to total flashes was calculated using Equation 1:

where
• P(NO2) is the production of NO2 = 11.5 kg NO2/flash
• IC = 3 x CG flashes
• CG = CG flashes
Annual LNOx maps were generated to be able to observe the distribution of LNOx over South Africa. Equation 1 was used to calculate the total LNOx on a 0.1° x 0.1° resolution over the country. The lightning flash information from the SALDN, the emission factor from Schumann and Huntrieser40, and the IC/CG ratio of 3 were used for calculations.
The total LNOx emission is expressed in kg NO2/km2/year. A box plot was created using the R-software lattice package to observe how LNOx production varies from month to month.48 The procedure for calculating LNOx is similar to the one described above, expressed in kt NO2/month. To produce the LNOx diurnal variation graph, we used hourly lightning flash data for the 8-year period. The calculations were made over the 24-h period, considering every hour, from 00 hour to 23 hour, e.g. lightning flash considered for 00 hour is the one greater or equal to 00 hour but less than 01 hour.
Results and discussions
Figure 4 indicates the annual ground flash density for the entire country, showing how the lightning flash density is distributed over South Africa. The results show that high flash densities occur over Mpumalanga, KwaZulu-Natal and Gauteng Provinces, with the highest flash density over the far northern parts of KwaZulu-Natal and the Mpumalanga escarpment. The flash density declines towards the west of the country, along the coast and towards the northeastern parts of the country. Over the mountainous region of Lesotho, flash densities of <5 flashes/km2 were observed. Gijben37 and Gill39 presented similar results.
Lightning is associated with convective storm development; hence portions of the country that experience many convective storms -the central, eastern and northern parts of the country - record high numbers of lightning flashes. The western and southwestern parts of the country are almost without thunderstorms, and therefore experience less lightning.39 This is due to the influence of topography in enhancing thunderstorm development, and therefore increasing lightning activity.53
Various studies internationally have shown a positive relationship between topography and lightning.54-56 The decrease in lightning over the elevated areas of Lesotho (Figure 4) can be attributed to the reduction in the occurrence of lightning at altitudes above 2000 m.37,53
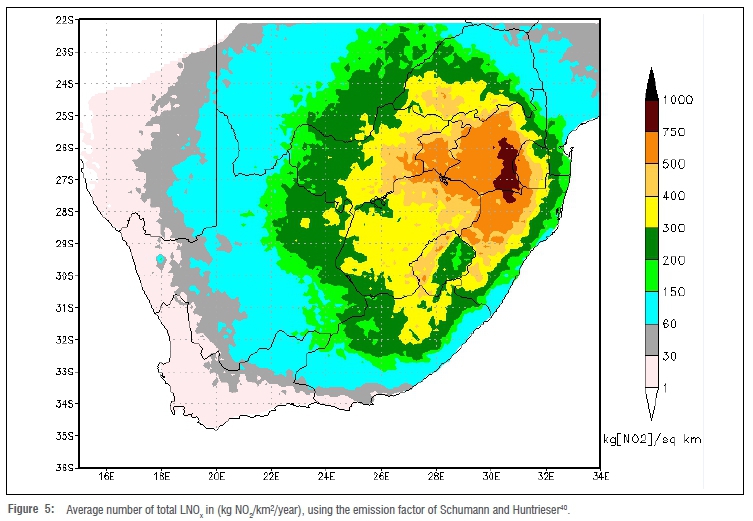
Figure 5 shows the spatial distribution of LNOx over South Africa for the 8-year period (2008-2015). Areas of high lightning flash density (Figure 4) are regions that incur high LNOx production. Highly elevated areas have a high production of NOx, particularly over the northeastern parts of the country, except over the elevated areas of Lesotho where lightning occurrence is reduced because of altitudes above 2000 m. The Highveld region of South Africa is one of the regions where lightning is frequent and therefore has a high LNOx production rate. This is also a region which is heavily industrialised and is the source of a large proportion of anthropogenic NOx production.57 In previous studies, in which LNOx was not considered, it was found that the leading producer of NOx in the Highveld Priority Area was industrial sources (power generation, petrochemicals and metallurgical industries) which are responsible for almost 96% of NOx emissions.58,59
Production of NOx by lightning differs seasonally, in accord with lightning distribution. High production of LNOx occurs in summer (NDJ) and autumn (FMA). This high LNOx production is associated with deep convective thunderstorms, which are accompanied by lightning. During spring, a moderate amount of lightning occurs, while in winter there is close to zero lightning occurrence as there is lack of moisture and the atmosphere is stable, hence production is at a minimum during winter (MJJ).
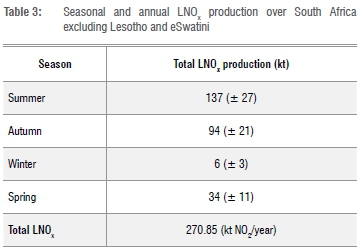
Table 3 shows the total LNOx generated, accompanied by the standard deviation of the interannual variability. The total lNOxproduced is estimated to be ~ 270.85 (±42.5) kt NO2/year, with summer contributing 51%, autumn 35%, spring 12%, and winter 2% of the annual budget. Figure 6 shows the variation of lightning production of NOx from month to month, with the box-and-whisker plot exhibiting the minimum and maximum LNOx production values, as well as the interquartile range and median. The lowest LNOx production is noticeable in winter months and the highest production in summer months. The median values depict that LNOx production is higher for December, followed by January and February. LnOxproduction further indicates relatively high values during spring and autumn as well, specifically in November, March and October.
The seasonal LNOx estimates presented depict a similar pattern to that of Ojelede et al.'s36 with summer contributing more to LNOx annual estimates, followed by autumn, spring, and then winter. The total annual LNOx production obtained by Ojelede et al.36 was 24% of that recorded in this study. The 65 kt NO2/year obtained is for when IC flashes are assumed to produce only 10% of NOx produced by CG flashes. Not assuming equal production of IC and CG flashes can lead to underestimation of LNOx.36
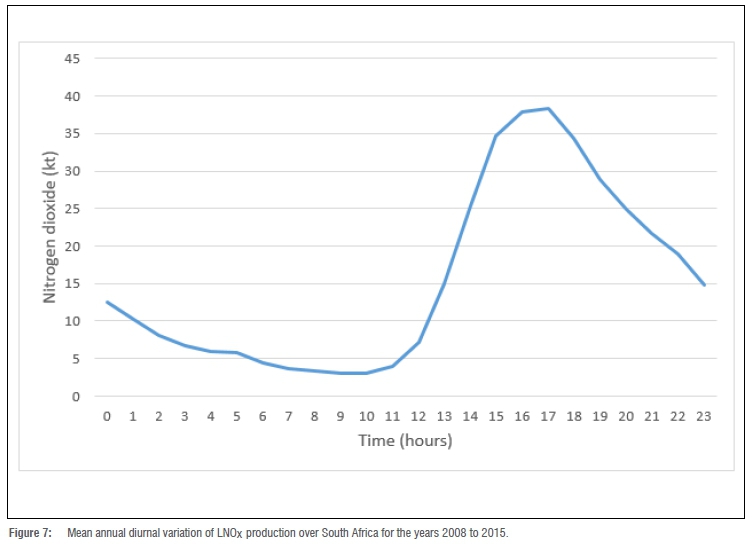
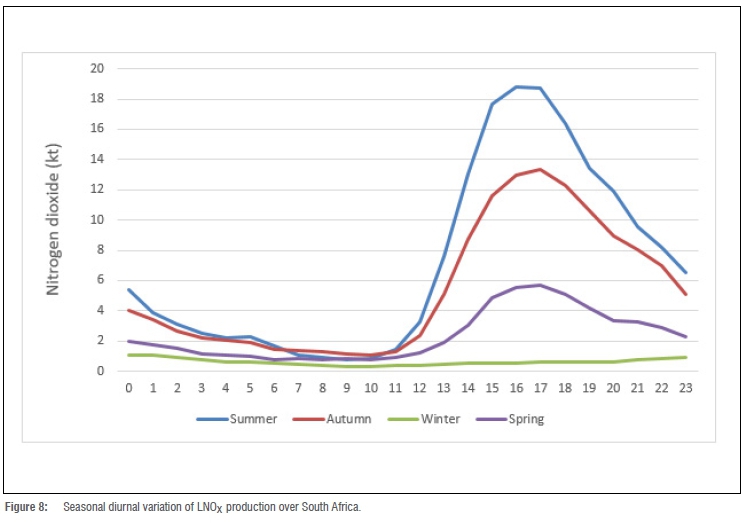
The diurnal variation of LNOx in Figure 7 shows low production of NO2 in the early morning, with peaks starting from ~0900 local time, reaching a maximum in the late afternoon around ~1500 local time before decreasing. The late afternoon peak in LNOx may be because of the surface being heated due to the incoming solar radiation during the day, which then induces convective activity locally. Collier et al.60 indicated the peak of annual lightning activity to be around 1700 local time in Pretoria, South Africa. Confirmation of these diurnal emission cycles improves the efforts to model LNOx emissions over the country. The diurnal variation of LNOx production is similar for summer, autumn and spring with LNOx reaching its peak in the late afternoon, except during winter (Figure 8). During winter (green), there is not much variation in LNOx production; it remains more or less the same throughout the day, and it is lower than during other seasons.
The calculation of the annual LNOx production allows us to compare this particular source of NOx to the South African atmosphere with the better known and understood industrial and vehicular sources, in order to determine the importance of LNOx in the South African NOx budget. Figure 9 shows NOx emission from lightning, together with NO2 emission obtained from the Emission Database for Global Atmospheric Research (EDGAR v4.2) for South Africa, which includes anthropogenic and biomass burning emissions.
The EDGAR v4.2 data used in the study provide estimates of the global biomass burning and anthropogenic emissions. The existing data are for all countries, with emissions given per main source category, on a spatial resolution of 0.1° x 0.1° grid over the globe. The database was obtained from the European Commission's Joint Research Centre data catalogue for the entire South Africa.61 According to EDGAR v4.2 data (Table 4), the largest anthropogenic source of nOx is the power generation sector (1A1a) which accounts for 1078.7 kt of NO2 per year.
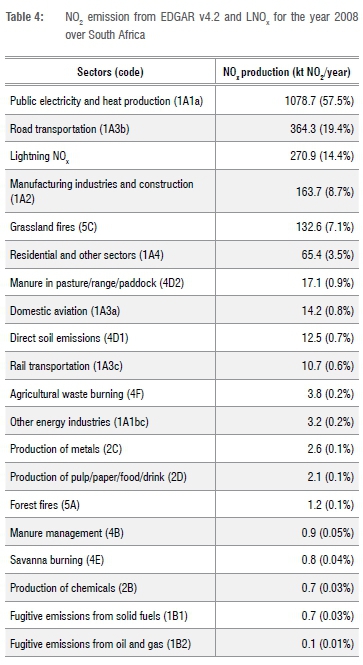
Road transportation (1A3b) is the second largest emitter of NOx, emitting 365.3 kt of NO2 over South Africa, accounting for 19.4% of the total NOx from EDGAR v4.2. Road travel dominates the transport sector, with the vehicle/ownership ratio in South Africa higher than the world average.62 This is due to the extensive travel distances between settlements and workplaces.62 Lightning NOx production is the third largest source of NOx to the atmosphere in South Africa and accounts for ~ 270 kt NO2/year, which is 14% of the total NOx emitted as estimated in EDGAR v4.2. This percentage indicates that lightning is a significant source of NOx in the atmosphere and cannot be ignored in air quality management planning; it also points to the importance of including lightning NOx in the NOx budget of the country.
The manufacturing industries and construction sector (1A2) is the fourth highest emitter of NOx at 163.7 kt/NO2/year and accounts for 8.7% of the total NOx. Grassland fires (5C) and residential and other sectors (1A4) account for 7% and 3.4%, respectively, of the total NOx emitted annually. The results indicate that industry is the main source of NOx and road transportation is the second highest emitter of NOx. Lightning NOx production is the third highest emitter of NOx. Delmas et al.63 deduced that, at a global scale, combustion of fossil fuels contributes ~50% and biomass burning ~20%, while lightning and microbial activity in soils contribute ~30% of total NOx emission. A recent study indicated that biogenic NOx production over the Highveld region amounted to 28.25 kt/year, which was 3.9% of the total for the region. In the Waterberg, biogenic emissions of NOx amounted to 3.72 kt/year, which is 2.28% of the total NOx budget in the area.64
Conclusions
We investigated the distribution of lightning over South Africa using 8 years of lightning data obtained from the SALDN. These emission factors gave an estimate of the total annual LNOx production of 270.85 (± 42.5) kt NO2/year. The LNOx estimation in this study builds on the work of Ojelede et al.36, who used 1 year of lightning data to estimate LNOx production over the Highveld of South Africa. In this study, LNOx production for the entire South African region was estimated over the 8 years. The Highveld region is the highest contributor to the total LNOx production in the country.
The summer season accounts for 51% of LNOx production, while the autumn season accounts for 35%. A sharp decline was experienced in winter, after which LNOx production steadily increased in spring when transitioning from winter to summer. The diurnal variation of LNOx shows that maximum production of NOx by lightning occurs in the late afternoons and early evenings, and is correlated with the peak occurrence of convective storms. Summer, autumn and spring all follow a similar pattern in which LNOx was highest in the late afternoon and decreased in the evening after 20:00 UTC. Winter was the only season during which there was no diurnal variation. The characterisation of both the seasonal and diurnal dynamics of LNOx production is essential for its use in atmospheric chemical transport modelling and provides suitable input information.
Lightning NOx production contributed 14% to the national NOx budget, making it the third highest source, followed by power generation (57.5%) and road transportation (19.4%). These results highlight the importance of including lightning NOx estimates in the NOx budget for South Africa in further air quality management planning.
Acknowledgement
We thank the South African Weather Service for providing the lightning data used in this study.
Competing interests
We have no competing interests to declare.
Authors' contributions
B.M. led the writing of the manuscript and calculated the lightning NOx production over South Africa. G.F. and R.B. supervised the study and made contributions that helped improve the original manuscript.
References
1. Monks PS, Archibald AT, Colette A, Cooper O, Coyle M, Derwent R, et al. Tropospheric ozone and its precursors from the urban to the global scale from air quality to short-lived climate forcer. Atmos Chem Phys. 2015;15(15):8889-8973. https://doi.org/10.5194/acp-15-8889-2015 [ Links ]
2. National environmental management: Air quality act, Act 39 of 2004, Republic of South Africa. [ Links ]
3. South African Department of Environmental Affairs (DEA). Highveld priority area air quality management plan. Pretoria: DEA; 2011. [ Links ]
4. Venter AD, Vakkari V, Beukes JP, Van Zyl P, Laakso H, Mabaso D, et al. An air quality assessment in the industrialised western Bushveld Igneous Complex, South Africa. S Afr J Sci. 2012;108(9/10), Art. #1059. https://doi.org/10.4102/sajs.v108i9/10.1059 [ Links ]
5. South African Department of Environmental Affairs (DEA). National framework for air quality management in the Republic of South Africa. Pretoria: Government Printers; 2013. [ Links ]
6. South African Department of Environmental Affairs (DEA). 2012 South Africa environment outlook: Chapter 5: Air quality. Pretoria: DEA; 2012. http://soer.deat.gov.za/dm_documents/Chapter_5_Air_Quality_4kp8X.pdf [ Links ]
7. World Health Organization (WHO). Health effects of particulate matter: Policy implications for countries in the eastern Europe, Caucasus and central Asia. J Korean Med Assoc. 2013;50(2):1-20. http://www.euro.who.int/__data/assets/pdf_file/0006/189051/Health-effects-of-particulate-matter-final-Eng.pdf [ Links ]
8. World Health Organization (WHO): Occupational and Environmental Health Team. WHO Air quality guidelines for particulate matter, ozone, nitrogen dioxide and sulfur dioxide: Global update 2005: Summary of risk assessment. Geneva: WHO Press; 2006. https://apps.who.int/iris/handle/10665/69477 [ Links ]
9. Chameides WL, Fehsenfeld F, Rodgers MO, Cardelino C, Martinez J, Parrish D, et al. Ozone precursor relationships in the ambient atmosphere. J Geophys Res Atmos. 1992;97(D5):6037-6055. https://doi.org/10.1029/91JD03014 [ Links ]
10. Intergovernmental Panel on Climate Change (IPCC). Climate change 2001: The scientific basis. New York: Cambridge University; 2001. https://www.ipcc.ch/report/ar3/wg1/ [ Links ]
11. Josipovic M. Acidic deposition emanating from the South African Highveld: A critical levels and critical loads assessment [PhD thesis]. Johannesburg: University of Johannesburg; 2009. [ Links ]
12. Georgoulias AK, Van der A RJ, Stammes, P Boersma, KF, Eskes HJ. Trends and trend reversal detection in 2 decades of tropospheric NO2 satellite observations. Atmos Chem Phys. 2019;19:6269-6294. https://doi.org/10.5194/acp-19-6269-2019 [ Links ]
13. Lourens A, Butler T, Beukes J, Van Zyl P Beirle S, Wagner T, et al. Reevaluating the NO2 hotspot over the South African Highveld. S Afr J Sci. 2012;108(11/12):1-6. https://doi.org/10.4102/sajs.v108i11/12.1146 [ Links ]
14. Health Effects Institute (HEI). State of global air 2018 [webpage on the Internet]. No date [cited 2018 Nov 15]. Available from: https://www.stateofglobalair.org/ [ Links ]
15. Lin J-T. Satellite constraint for emissions of nitrogen oxides from anthropogenic, lightning and soil sources over East China on a high-resolution grid. Atmos Chem Phys. 2012;12(6):2881-2898. https://doi.org/10.5194/acp-12-2881-2012 [ Links ]
16. Pickering K, Bucsela E, Allen D, Ring A, Holzworth RA, Krotkov N. Estimating of lightning NOx production based on OMI NO2 observations over the Gulf of Mexico. J Geophys Res Atmos. 2014;121:8668-8691. https://doi.org/10.1002/2015JD024179 [ Links ]
17. Beirle S, Platt U, Wagner TK. Potential of monitoring nitrogen oxides with satellite instruments. Proceedings of the 2006 EUMETSAT Meteorological Satellite Conference; 2006 June 12-16; Helsinki, Finland. Available from: https://www.eumetsat.int/website/home/News/ConferencesandEvents/PreviousEvents/DAT_2043223.html [ Links ]
18. Kang D, Pickering K. Lightning NOx emissions and the implications for surface air quality over the contiguous United States. J Air Waste Manag Assoc. 2018:1-6. [ Links ]
19. Labrador LJ, Kuhlmann R, Lawrence MG. The effects of lightning-produced NOx and its vertical distribution on atmospheric chemistry: Sensitivity simulations with MATCH-MPIC. Atmos Chem Phys. 2005;5(7):1815-1834. https://doi.org/10.5194/acp-5-1815-2005 [ Links ]
20. Steiner A, Tonse S, Cohen R, Goldstein A, Harley R. Influence of future climate and emissions on regional air quality in California. J Geophys Res. 2006;111(18):1-22. https://doi.org/10.1029/2005JD006935 [ Links ]
21. Tagaris E, Manomaiphiboon K, Liao K-J, Leung L, Woo J-H, He S, et al. Impacts of global climate change and emissions on regional ozone and fine particulate matter concentrations over the United States. J Geophys Res. 2007;112(14):1-11. https://doi.org/10.1029/2006JD008262 [ Links ]
22. Banerjee A, Archibald A, Maycock A, Telford P Abraham N, Yang X, et al. Lightning NOx a key chemistry-climate interaction: Impacts of future climate change and consequences for tropospheric oxidising capacity. Atmos Chem Phys. 2014;14(18):9871-9881. https://doi.org/10.5194/acp-14-9871-2014 [ Links ]
23. Finney DL, Doherty RM, Wild O, Young PJ, Butler A. Response of lightning NOx emissions and ozone production to climate change: Insights from the Atmospheric Chemistry and Climate Model Intercomparison Project. Geophys Res Lett. 2016;43(10):5492-5500. https://doi.org/10.1002/2016GL068825 [ Links ]
24. DeCaria AJ, Pickering KE, Stenchikov GL, Ott LE. Lightning-generated NOx and its impact on tropospheric ozone production: A three-dimensional modelling study of a Stratosphere-Troposphere Experiment: Radiation, Aerosols and Ozone (STERAO-A) thunderstorm. J Geophys Res. 2005;110(14):1-13. https://doi.org/10.1029/2004JD005556 [ Links ]
25. Price C, Penner J, Prather M. NOx from lightning: 1. Global distribution based on lightning physics. J Geophys Res. 1997;102(5):5929-5941. https://doi.org/10.1029/96JD03504 [ Links ]
26. Lawrence MG, Chameides WL, Kasibhatla PS, Levy II H, Moxim W. Lightning and atmospheric chemistry: The rate of atmospheric NO production. Boca Raton, FL: CRC Press; 1995. [ Links ]
27. Huntrieser H, Feigl C, Schlager H, Schroder F, Gerbig C, Van Velthoven P, et al. Airborne measurements of NOx, tracer species, and small particles during the European Lightning Nitrogen Oxide Experiment. J Geophys Res Atmos. 2002;107(D11):ACH5-1-ACH5-24. https://doi.org/10.1029/2000JD000209 [ Links ]
28. Wang Y, DeSilva AW, Goldenbaum GC, Dickerson RR. Nitric oxide production by simulated lightning: Dependence on current, energy, and pressure. J Geophys Res. 1998;103(D15):19149-19159. https://doi.org/10.1029/98JD01356 [ Links ]
29. Holmes C, Brook M, Krehbiel P, McRory R. On the power spectrum and mechanism of thunder. J Geophys Res. 1971;76:2106-2115. https://doi.org/10.1029/JC076i009p02106 [ Links ]
30. Gollardo L, Cooray V. Could cloud-to-cloud discharges be as effective as cloud-to-ground discharges in producing NOx? Tellus. 1996;48B:641-651. https://doi.org/10.1034/j.1600-0889.1996.t01-4-00003.x [ Links ]
31. Cooray GV. Energy dissipation in lightning flashes. J Geophys Res. 1997;102:21401-21410. https://doi.org/10.1029/96JD01917 [ Links ]
32. DeCaria AJ, Pickering KE, Stenchikov GL, Scala JR, Stith JL, Dye JE, et al. A cloud-scale model study of lightning-generated NOx in an individual thunderstorm during STERAO-A. J Geophys Res. 2000*105(D9):11601-11616. https://doi.org/10.1029/2000JD900033 [ Links ]
33. Ott LE, Pickering KE, Stenchikov GL, Allen DJ, DeCaria AJ, Ridley B, et al. Production of lightning NOx and its vertical distribution calculated from three-dimensional cloud-scale chemical transport model simulations. J Geophys Res. 2010;115(4):1-19. https://doi.org/10.1029/2009JD011880 [ Links ]
34. Biazar A, McNider R. Regional estimates of lightning production of nitrogen oxides. J Geophys Res. 1995;100(11):22861-22874. https://doi.org/10.1029/95JD01735 [ Links ]
35. Beirle S, Huntrieser H, Wagner T. Direct satellite observation of lightning-produced NOx. Atmos Chem Phys. 2010;10(22):10965-10986. https://doi.org/10.5194/acp-10-10965-2010 [ Links ]
36. Ojelede M, Annegarn H, Price C, Kneen M, Goyns P. Lightning-produced NOx budget over the Highveld region of South Africa. Atmos Environ. 2008;42(22):5706-5714. https://doi.org/10.1016/j.atmosenv.2007.12.072 [ Links ]
37. Gijben M. The lightning climatology of South Africa. S Afr J Sci. 2012;108(3/4), Art. #740. https://doi.org/10.4102/sajs.v108i3/4.740 [ Links ]
38. Vaisala. CP series CP7000 CP8000 user's guide. Helsinki: Vaisala Oyj; 2004. [ Links ]
39. Gill T. Initial steps in the development of a comprehensive lightning climatology of South Africa [MSc thesis]. Johannesburg: University of the Witwatersrand; 2008. [ Links ]
40. Schumann U, Huntrieser H. The global lightning-induced nitrogen oxides source. Atmos Chem Phys. 2007;7:3823-3907. https://doi.org/10.5194/acpd-7-2623-2007 [ Links ]
41. Boccippio D, Cummins K, Christian H, Goodman S. Combined satellite and surface-based estimation of the Intracloud-cloud-to-ground lightning ratio over the continental United States. Mon Weather Rev. 2001;129:108-122. https://doi.org/10.1175/1520-0493(2001)129%3C0108:CSASBE%3E2.0.CO;2 [ Links ]
42. Prentice SA, Mackerras D. The ratio of cloud to cloud-ground lightning flashes in thunderstorms. J Appl Meteorol Climatol. 1977;16(5):545-550. https://doi.org/10.1175/1520-0450(1977)016%3C0545:TROCTC%3E2.0.CO;2 [ Links ]
43. Mackerras D, Darveniza M, Orville RE, Williams ER, Goodman SJ. Global lightning: Total, cloud and ground flash estimates. J Geophys Res. 1998;103:19791-19809. [ Links ]
44. Nesbitt SW, Zhang R, Orville R. Seasonal and global NOx production by lightning estimated from the Optical Transient Detector (OTD). Tellus B: Chem Phys Meteorol. 2000;52(5):1206-1215. http://dx.doi.org/10.1034/j.1600-0889.2000.01121.x [ Links ]
45. Dye JE, Ridley BA, Skamarock W, Barth M, Venticinque M, Defer E, Blanchet P Thery C, Laroche P Baumann K, Hubler G, Parrish DD, Ryerson T, Trainer M, Frost G, Holloway JS, Matejka T, Bartels D, Fehsenfeld FC, Tuck A, Rutledge SA, Lang T, Stith J, Zerr R. An overview of the Stratospheric-Tropospheric Experiment: Radiation, Aerosols, and Ozone (STERAO)-Deep Convection experiment with results for the July 10, 1996 storm. J Geophys Res. 2000;105:10023-10045. https://doi.org/10.1029/1999JD901116 [ Links ]
46. Bond DW, Zhang R, Tie X, Brasseur G, Hufflnes G, Orville RE, Boccippio DJ. NOx production by lightning over the continental United States. J Geophys Res. 2001;106(D21): 27701-27710. https://doi.org/10.1029/2000JD000191 [ Links ]
47. Cummings KA, Huntemann TL, Pickering KE, Barth MC, Skamarock WC, Höller H, et al. Cloud-resolving chemistry simulation of a Hector thunderstorm. Atmos Chem Phys. 2013;13(5):2757-2777. https://doi.org/10.5194/acp-13-2757-2013 [ Links ]
48. Sarkar D. Lattice: Multivariate data visualization with R. New York: Springer; 2008. https://doi.org/10.1007/978-0-387-75969-2 [ Links ]
49. Beirle S, Spichtinger N, Stohl A, Cummins K, Turner T, Boccippio D, Cooper OR, Wenig M, Grzegorski M, Platt U, Wagner T. Estimating the NOx produced by lightning from GOME and NLDN data: A case study in the Gulf of Mexico. Atmos Chem Phys Discuss. 2005;5(6):11295-11329. https://hal.archives-ouvertes.fr/hal-00301908 [ Links ]
50. Fehr T, Holler H, Huntrieser H. Model study on production and transport of lightning-produced NOx in a EULINOX supercell storm. J Geophys Res. 2004;109:D09102. https://doi.org/10.1029/2003JD003935 [ Links ]
51. Beirle S, Spichtinger N, Stohl A, Cummins KL, Turner T, Boccippio D, Cooper OR, Wenig M, Grzegorski M, Platt U, Wagner T. Estimating the NOx produced by lightning from GOME and NLDN data: A case study in the Gulf of Mexico. Atmos Chem Phys. 2006;6(4):1075-1089. https://doi.org/10.5194/acp-6-1075-2006 [ Links ]
52. Bucsela EJ, Pickering KE, Huntemann TL, Cohen RC, Perring A, Gleason JF, Blakeslee RJ, Albrecht RI, Holzworth R, Cipriani JP Vargas-Navarro D, Mora-Segura I, Pacheco-Hrnandez A, Laporte-Molina S. Lightning-generated NOx seen by the Ozone Monitoring Instrument during NASA's Tropical Composition, Cloud and Climate Coupling Experiment (TC4). J Geophys Res. 2010;115:D00J10. https://doi.org/10.1029/2009JD013118 [ Links ]
53. Bhavika B. The influence of terrain elevation on lightning density in South Africa [MSc thesis]. Johannesburg: University of Johannesburg; 2007. [ Links ]
54. Kotroni V Lagouvardos K. Lightning occurrence in relation with elevation, terrain slope, and vegetation cover in the Mediterranean. J Geophys Res. 2008;113(21):1-7. https://doi.org/10.1029/2008JD010605 [ Links ]
55. Bourscheidt V Pinto O, Naccarato KP Pinto IRCA. The influence of topography on the cloud-to-ground lightning density in South Brazil. Atmos Res. 2009;91 (2-4):508-513. https://doi.org/10.1016/j.atmosres.2008.06.010 [ Links ]
56. Vogt BJ, Hodanish SJ. A high-resolution lightning map of the state of Colorado. Mon Weather Rev. 2014;142:2353-2360. https://doi.org/10.1175/MWR-D-13-00334.1 [ Links ]
57. Freiman MT, Piketh SJ. Air transport into and out of the industrial Highveld region of South Africa. J Appl Meteorol. 2003;42(7):994-1002. https://doi.org/10.1175/1520-0450(2003)042%3C0994:ATIAOO%3E2.0.CO;2 [ Links ]
58. South African Department of Environmental Affairs (DEA). The medium-term review of the 2011 Highveld Priority Area (HPA): Air quality management plan. Pretoria: DEA; 2015. https://lifeaftercoal.org.za/wp-content/uploads/2016/02/HPA-AQMP-Midterm-review-Draft-Report_February-2016.pdf [ Links ]
59. Center for Environmental Rights, Groundwork and Highveld Environmental Justice Network. Life after coal/Impilo ngaphandle kwamalahle. Broken promises: The failure of the Highveld Priority Area [ https://lifeaftercoal.org.za]. c2017 [2017 Nov 30]. Available from: https://lifeaftercoal.org.za/virtual-library/publications/broken-promises-the-failure-of-the-highveld-priority-area [ Links ]
60. Collier A, Hughes A, Lichtenberger J, Steinbach P Seasonal and diurnal variation of lightning activity over southern Africa and correlation with European whistler observations. Ann Geophys. 2006;24(2):529-542. https://doi.org/10.5194/angeo-24-529-2006 [ Links ]
61. Janssens-Maenhout G, Crippa M, Guizzardi D, Muntean M, Schaaf E. Emissions database for global atmospheric research version v4.2 (grid-maps). c2011 [cited 2017 Mar 12]. Available from: http://data.europa.eu/89h/jrc-edgar-jrc-edgarv42_gridmaps [ Links ]
62. South African Department of Environmental Affairs (DEA). GHG inventory for South Africa 2000 - 2010. Pretoria: DEA; 2014. https://unfccc.int/resource/docs/natc/zafnir1.pdf [ Links ]
63. Delmas R, Serça D, Jambert C. Global inventory of NOx sources. Nutr Cycling Agroecosyst. 1997;48(1-2):51-60. https://doi.org/10.1023/A:1009793806086 [ Links ]
64. Bruwer A, Kornelius G. Modelling the effects of biogenic NOx emissions on the South African Highveld and Waterberg regions. Water Air Soil Pollut. 2017;228(9), Art. #326. https://doi.org/10.1007/s11270-017-3526-y [ Links ]
 Correspondence:
Bathobile Maseko
Email: bathobile.maseko@weathersa.co.za
Received: 06 Mar. 2020
Revised: 12 Feb. 2021
Accepted: 29 Mar. 2021
Published: 29 Sep. 2021
Editor: Yali Woyessa
Funding: None

