


Servicios Personalizados
Articulo
 Inglés (pdf)
 Articulo en XML
 Referencias del artículo
Indicadores

Links relacionados
-
 Citado por Google
 -
 Similares en Google
Compartir

 Permalink
South African Journal of Science
versión On-line ISSN 1996-7489
versión impresa ISSN 0038-2353
S. Afr. j. sci. vol.117 no.9-10 Pretoria sep./oct. 2021
http://dx.doi.org/10.17159/sajs.2021/11020
RESEARCH ARTICLE
Dynamics of rice production among the food crops of Tanzania
Abel L. MtembejiI, II; Dharam R. SinghI
IDivision of Agricultural Economics, ICAR-Indian Agricultural Research Institute, New Delhi, India
IIDar es Salaam City Council, Dar es Salaam, Tanzania
ABSTRACT
Rice is an important crop in Tanzania which contributes significantly to the farmers, consumers, and the government. Recognising this importance, the government has made initiatives to attain rice self-sufficiency. These initiatives are crucial in contributing to regional self-sufficiency, enabling rice market leadership, and injecting productivity through significant improvements in the quality, quantity, and value of rice produced in Tanzania. We investigated the dynamics of rice area, production, and productivity and identified shifts in the land-use patterns in Tanzania. To analyse secondary data collected over a 33-year period from 1986/1987 to 2018/2019, we used compound annual growth rates, Cuddy-Della Valle Index and a first-order Markov chain approach. We found that the growth in the areas under rice cultivation, production and productivity were inconsistent as evidenced by the presence of instabilities. Rice remains the third most stable crop in the country in terms of area under production retention; however, this might decline in the next 2 years. Policies in future must enable strategies to increase productivity as well as promote high-yielding varieties, efficient input usage, and irrigation infrastructure development.
SIGNIFICANCE:
• We investigated the spatial and temporal trends in rice area, production, and productivity as well as identified shifts in the crop land-use patterns after a series of government interventions. To achieve sustainability, it is essential to revisit agricultural crop growth strategies regularly at macro- and micro-levels.
Keywords: rice production, compound annual growth rate, instability, Markov chain, Tanzania
Introduction
Agriculture is an important economic sector in Tanzania, contributing about 30% to the country's total GDP1 of uSD47.43 billion. It is the primary source of food and jobs (65.5%) in the country, besides supplying raw materials for industries (65%) and contributing to the foreign exchange earnings (30%). Agricultural production is a critical component of Tanzania's Poverty Reduction Strategy, as it contributes to the country's long-term economic development and food security.2 Nevertheless, it is affected by several factors, including crop management, climate, socio-economic factors, and the policies of the government. Production variability also results from variations in region, yield, and/or the interaction of area and yield. As a result, with time, it is crucial to understand the nature and patterns of the area, production, and productivity to identify policy interventions that can help close the yield gap and improve sustainability.
While the agriculture sector of Tanzania is growing at 5.2%, the crop sector grows at 5.8%. Cereals, pulses, roots and tubers, fruits and vegetables, and spices are among the major crops grown. Cereals account for 52% of the total dietary energy supply, with maize and rice accounting for 59% and 21%, respectively.3 In Africa, rice consumption has been growing at a faster rate than any other staple food, at around 5.5% per year, due to urbanisation and related changes in eating habits, as well as population growth.4 In Tanzania, it is the second most common cereal after maize, and it contributes to the country's food and household nutrition security. It is grown in 64 districts, affecting the livelihoods of over two million people.3,5 Like maize, it is a strategic crop for Tanzanian government agricultural investments, as it contributes to the value of agricultural production, national food security and export revenues.5
Tanzania has developed a range of agricultural development initiatives over the last 30 years, including the National Agriculture Policy6, which serves as a guideline for the overall development of the agriculture sector, with a focus on crop production optimisation for food security and economic development. Programmes, initiatives, policies, strategies, and projects carry out the policy implementation. In the medium and long term, the Agricultural Sector Development Strategy of 2003-2013 provided an encouraging and cooperative environment for improving agricultural productivity and profitability as the foundation for improved farm incomes and rural poverty reduction. Meanwhile, the Agricultural Sector Development Programme I of 2005-2015 served as the agriculture sector's overall mechanism for overseeing the sector's structural, expenditure, and investment development.7 The 20152025 Agricultural Sector Development Strategy II set a target of contributing to Tanzania's national economic growth and poverty reduction (Vision 2025/LTPP) by promoting inclusive and sustainable agricultural growth, reducing rural poverty by 2025/2026, and improving food and nutrition security (by reducing the per cent of rural households below the food poverty line by 2025/2026). Furthermore, the Agricultural Sector Development Programme II of 2017-2027 is a tool for strategy execution, to enhance smallholder farmers' productivity of target commodities within sustainable production systems and to forge sustainable market linkages for competitive surplus commercialisation and value chain development.8
Rice is the world's most commonly grown cereal grain, and it is a staple food for more than 60% of the world's population.9 China is the world's largest rice producer, accounting for nearly 30% of global output; other major producers include India, Indonesia, Bangladesh, Vietnam, Thailand, Burma, Philippines, and Brazil. Between 1961 and 2010, global rice production more than tripled, with an annual compound growth rate of 2.24% (2.21% in rice-producing Asia). Much of the rise in rice production is attributed to higher yields, which rose at an annual average rate of 1.74%, compared with an annual average growth rate of 0.49% for the area harvested. Paddy yields rose at an annual average rate of 51.1 kg/ha per year in absolute terms.10 The rice industry is contributing significantly to farmers, consumers, and the government of Tanzania. Several government-led initiatives were implemented for the development of the sector. For example, the implementation of the 10-year first phase of the National Rice Development Strategy of 2009 aimed to double rice production by 201811, and the National Rice Development Strategy II of 2019 was launched to support the government's rice development efforts over the next 12 years. The goal is to maintain rice self-sufficiency, contribute to regional self-sufficiency, enable rice market leadership, and inject productivity through significant improvements in the quality, quantity, and value of rice produced in Tanzania.5
Compound annual growth rate (CAGR) has become a common tool for analysing the growth in crop production. For example, CAGR was used to measure the change and growth rate in the area, production, and yield of wheat in Ethiopia from 1991/1992 to 2012/2013.12 In addition, an examination of the growth and trend in plantain area, production quantity, and yield in Nigeria between 1961 and 201713, as well as an analysis of the contributions of yield and area to the production of cassava in Nigeria14, used CAGR. Findings suggest that improved productivity is important, because expanding area under a specific crop might not be feasible without reducing the area share of other crops. Thus, it is crucial to deploy and implement suitable technologies.14 When CAGR is paired with instability indices, it is possible to obtain a deeper understanding of the degree of continuity in crop growth and to classify the winning variable if growth comes first then a decrease in volatility.15-17 Assessing improvements in cropping patterns in various regions is also important for obtaining a deeper understanding of the agricultural growth and development process. A first-order Markov chain analysis provides a base for study into the complexities of cropping trends and patterns by examining the area retention (stability of the area under various crops) and crop shifting from one set to another.18-20
Despite many studies on the area, production, and productivity for major food crops undertaken for Tanzania in the past, there have been very few nationwide studies on rice in recent years. Mkonda and He21 used the Mann-Kendall test to assess the development pattern of major food crops (five crops) and their efficacy on food security in Tanzania from 1980 to 2015. During the study period, they discovered that production had a positive trend while yield had a negative trend. The supply response, price and non-price factors determining output, and how receptive farmers were to these factors were examined through a panel survey in 2008/2009.2 Some core determinants of production were established and demonstrated that farmers are price responsive. In this study, we investigated the dynamics of rice crop area, production, and productivity in Tanzania over a 33-year period (1986/1987-2018/2019) in three phases, and we identified shifts in the land-use patterns of rice in relation to other major food crops (maize, sorghum, millets, wheat, pulses and others) as indicators of sustainability.
Methodology
To examine trends in rice area, production and productivity for a 33-year period (1986/1987 to 2018/2019), we used secondary data from the Ministry of Agriculture of Tanzania, the National Bureau of Statistics (Tanzania), and FAOSTAT. The study period was divided into three sub-periods (1986/1987-1998/1999, 1999/2000-2008/2009, and 2009/2010-2018/2019), totalling 33 years (1986/1987-2018/2019).
The sub-period wise analysis was done to assess the effect of the rice policy intervention (National Rice Development Strategy I) implemented between 2009 and 2018. This period was sufficient to gain insight into the production performance and establish plans for potential initiatives. The following methods were used for the analysis.
Trend growth
A variable's growth reflects how well it has performed in the past. The growth analysis determines the trend of a given variable over time.
The exponential growth function in the form of a CAGR was used to estimate the growth in the area, production, and productivity of the rice (paddy) crop in Tanzania as it was applied by Bezabeh et al.12; Adeoye et al.13; Ikuemonisan et al.14; Ayalew16; Bisht and Kumar17. CAGRs were calculated by exponentially regressing the time series data on area, production and productivity of rice against time using the following formula:

where Yt is the dependent variable for which growth rate was estimated (area, production and productivity); a is the intercept; b = (1+r); r is the annual growth rate; t is the year (time period) which takes values 1,2, 3, ...n; and u is the error term for the year t.
The equation was transformed into log-linear form and estimated using the ordinary least squares method. The CAGR (per cent) was then calculated from the relationship CAGR (%) = (antilog of ln b-1)*100. The estimation was done for all three phases (periods) - 1986/19871998/1999, 1999/2000-2008/2009, 2009/2010-2018/2019 - and the overall period of study, 1986/1987-2018/2019.
Instability
The Cuddy-Della Valle Index, which is a measure of variability in time series data, was used to identify instabilities in rice area, production and productivity.22 It is an improvement over the simple coefficient of variation, which is prone to overestimation. For a series with a time trend, the Cuddy-Della Valle Indexes for three periods (1986/1987-1998/1999, 1999/2000-2008/2009, 2009/2010-2018/2019) and for the overall period of study (1986/1987-2018/2019) were calculated as follows:

where CV is the coefficient of variation in per cent and R2 is the adjusted coefficient of determination from a time trend regression.
Markov chain analysis
Secondary data for the major food crops were obtained from the Ministry of Agriculture (Department of Food Security), United Republic of Tanzania, to investigate the dynamics of the shift in cropping patterns for the 10-year period (2009/2010-2018/2019). Analysis using these data aided in understanding the performance of the rice crop in relation to other food crops. The major food crops investigated were maize, sorghum, millets, rice, wheat, pulses and others (cassava, banana, Irish potatoes and sweet potatoes). External non-stationary factors such as rainfall, temperature, and agricultural input and output prices influence farmer crop selections. The majority of the rice produced in the country is under rainfed conditions.4 There is a stiff competition with other food crops in terms of area under production because all the selected food crops grow during the long rainy season (agricultural season). As a result, all the major food crops compete for land and inputs based on these factors' variations. We used a first-order Markov chain approach to evaluate the direction of shift in cropping pattern using LPSOLVE IDE software and Microsoft Excel.
The transitional probability matrix 'P', whose diagonal elements represent retention probability and off-diagonal elements represent switching-over probability, was examined using a first-order Markov chain analysis. The diagonal elements of the analysis show how much land a crop had maintained from previous years. The higher the value in the diagonal element (which tends to 1), the more stable the crop is, whereas lower values (which tend to 0) suggest instability. The crop's column elements represent the area gained from other crops, while the crop's row elements indicate the area lost to other crops.18-20 The average area shifted to a particular crop is a random variable that depends only on the previous crop's area, algebraically expressed as:

where Ejt is the area of the crop shifted towards the particular jth crop in the year t; Eit-1 is the area lost by the ith crop during the year f-1; p is the probability that the area lost will shift from ith crop to the jth crop; Ejt is the error term which is statistically independent of the Eit-1; and n is the number of crops.
The transitional probabilities pj, which can take a (c x r) matrix form, have the following properties:
1. 0 <PS < 1
2. ΣPij=1, for all i
The following formulae were used to project the areas for the seven crops for the next 2 years (2019/2020-2020/2021) based on the results of the Markov chain analysis:
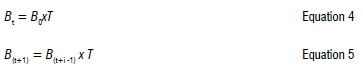
where B0 is the area under the crop in the base year; B(t+1) is the area under the crop in the next year (prediction); and T is the transitional probability matrix.
Results and discussion
Tanzania has a long tradition of rice production, and its rice agroecosystems are divided into three categories: irrigated lowland, rainfed lowland, and rainfed upland, with the rainfed lowland areas producing the majority of the rice.4,23 The potential area for irrigation is 29.4 million hectares, but the current paddy area under irrigation is 475 052 ha, which increased from a figure of 289 245 ha in the year 2007/2008.5,11 Domestically, fertiliser availability has also improved, from 302 000 tonnes in 2009/2010 to 418 355 tonnes in 2018/2019. Farmers in the country cultivate hundreds of local rice varieties, as well as a few improved varieties such as SUPA, NERICA, TXD 88, TXD 306 (SARO 5).4,5
Rice imports are projected to decrease because of the Tanzanian government's ban on rice imports in 2018 and a rise in domestic production to the point that the country can maintain rice self-sufficiency. Long-grain milled rice is currently imported from Pakistan, Thailand, and India. According to the Ministry of Agriculture, rice imports have fluctuated in recent years, from 8 tonnes in 2013, 9069 tonnes in 2014, 28 888 tonnes in 2015, 959 043 tonnes in 2016, to 942.5 tonnes in 2017.
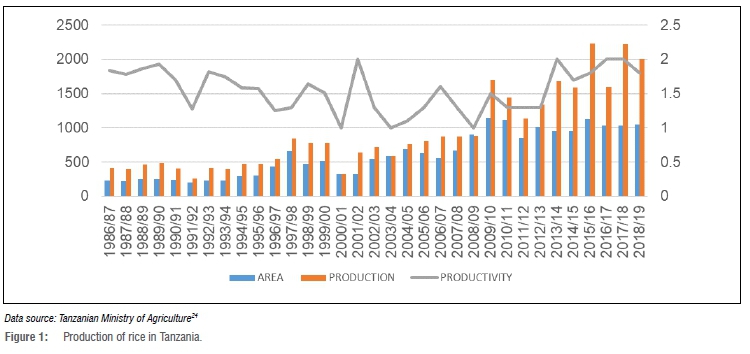
Tanzania has realised a rise in rice production and area under cultivation over the 33-year study period (1986/1987 to 2018/2019). Figure 1 shows that the highest level of production (2 229 071 tonnes) was in 2015/2016 and the lowest was in 1991/1992 (256 000 tonnes), with the lowest area under production (200 090 ha) in 1991/1992 and the highest in 2009/2010 (1 141 065 ha).
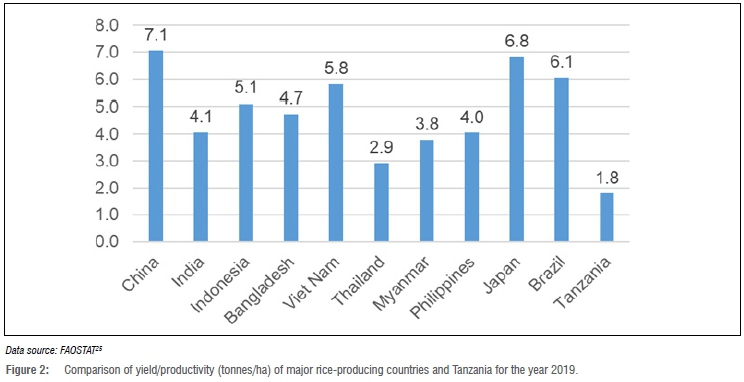
Rice productivity ranged considerably, with 1 tonne per hectare being the lowest and 2 tonnes per hectare being the highest. This productivity is far below that of the top ten producing countries in the world, with the top three producers, China, Japan, and Brazil, producing yields of 7.1, 6.8, and 6.1 tonnes per ha, respectively, as shown in Figure 2.
Mbeya, Morogoro, Mwanza, Tabora, Shinyanga, and Rukwa regions are the country's major rice producers and are thus the 'big six' of rice production. In 2018/2019, the six regions produced 62% of the country's total rice production (their individual contributions are reflected in Figure 3), accounting for 61% of the 1 052 547 ha under cultivation. Rice productivity was found to be higher than the national average (1.8 tonnes/ha) in two of the big six regions (Mbeya and Morogoro). Within the same year, Mbeya and Morogoro produced 3.0 tonnes/ha and 2.5 tonnes/ha, respectively. If sufficient efforts, including technological advancements, are maintained in the big six regions, it is possible to surpass the national average in productivity.
Compound annual growth rate
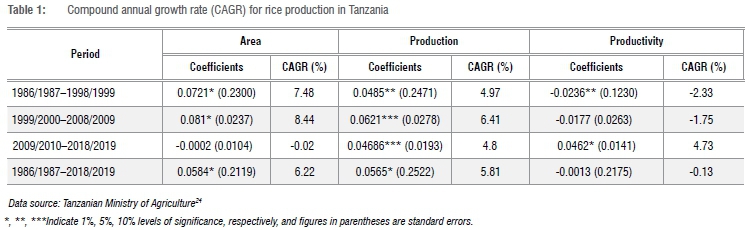
To understand the growth patterns of the area, production, and productivity of paddies, the CAGR was calculated for each variable in the three separate periods as well as overall for the 33-year period, as shown in Table 1. Over a 33-year period, the area under production grew at a significant rate of 7.48% in the first period and 8.44% in the second, and overall, the area under production grew at a rate of 6.22% annually. The annual growth of the area under production has shown a swing periodically for the past 33 years, increasing from 7.48% to 8.44%, and then growing insignificantly in the third period.
The CAGRs of production were found to be 4.97%, 6.41% and 4.8% in the first, second and third periods, respectively, indicating that the rate of production growth has recently slowed. Over the entire study period, production grew significantly at a rate of 5.81% per year. The productivity growth was significant for the first and third periods with CAGRs of -2.33% and 4.73%, respectively. The productivity grew positively and significantly at 4.73%, implying that Tanzania has only experienced significant productivity growth in the last 10 years (2009/20102018/2019). Over the entire study period (1986/1987-2018/2019), there was a substantial CAGR of 6.22% for the area and 5.81% for production, as also observed for trends of rice area and production in Andhra Pradesh of India26, suggesting the potential to target initiatives aimed at increasing productivity growth.
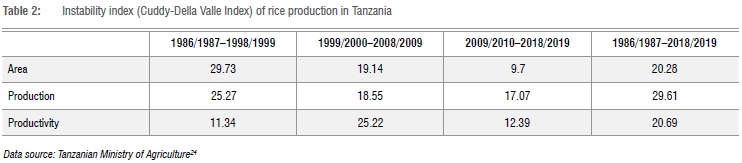
Instabilities of rice production
The Cuddy-Della Valle Index for the area, production, and productivity instability was calculated and the results are shown in Table 2 to better understand the consistency of growth performance. Throughout the study period, area instability decreased from 29.73%, 19.14% and 9.7% in the first, second, and third periods, respectively. The first two stages showed medium instability, while the third period showed low instability. This signifies that the variations of area under rice production decreased over time. The area overall had a medium instability index of 20.28% over the 33-year period (1986/1987-2018/2019).
Production instability has decreased significantly over time - 25.27%, 18.55% and 17.07% for the first, second, and third periods, respectively - but has remained at a medium level of instability. Production gained stability in the third period in comparison to the first and second periods, which indicates a decrease in production variations. Production instability was moderate over the entire 33-year period, at 29.61%. Instability in production intensifies price swings, making disadvantaged farmers more vulnerable to market forces. Productivity instability was low in the first period (11.34) and third period (12.39), whereas it was moderate in the second period (25.22). In general, a moderate instability was observed for productivity over the entire study period considered, at 20.69. Productivity instability was slightly higher than area instability, indicating that productivity variation was a major source of variation in rice production in Tanzania, as also found by Mkonda and He21 for the period 1980-2015.
Dynamics of the shift in cropping patterns of major food crops
Table 3 shows the transition probability matrix for major crops during the study period that indicates the proportion changes of area (ha) under production from year to year. The wheat crop was found to be the most stable in terms of area retention for the period 2009/2010-2018/2019 by retaining 56% of its previous area (ha), followed by other food crops (cassava, banana, Irish potatoes and sweet potatoes) which retained 49%. The rice crop was the third most stable crop with 39.2%, followed by maize with 39.1%. Millets were the only crop group that did not retain the previous area under cultivation, which signifies that millet farmers are shifting the area and looking to cultivate other crops.
Rice displayed properties of a dynamic crop in terms of area under cultivation as the findings show that it gained 17% area from maize and lost 15% and 45.5% to pulses and other crops, respectively. The stability of the area under production for rice is still low, which is the result of having multiple food crops in the country which encourage farmers to switch to different crops to attain better outputs.
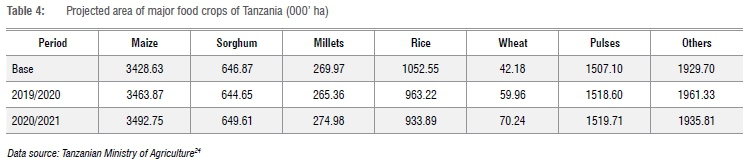
The area projections of the seven major food crops for the two periods based on the transitional probability matrix is shown in Table 4. The projected area under rice shows a decreasing trend, which is the same as for the others group of crops. The area under rice production is projected to decrease from 1 052 550 ha of the base in the period 2018/2019 to 963 220 ha for 2019/2020 and 933 890 ha for the period 2020/2021. Rice being a dynamic crop for area retention, the decrease is highly associated with cropping diversification, i.e. farmers have many choices for switching food crops. As the future likelihood depends on the current state, the decline in rice area under production could be a result of variations in non-stationary factors of production and other associated factors including land tenure management, rainfall (due to the risk posed by climate change), shortage of inputs, pests, diseases, access to agriculture extension, access to agricultural credits and marketing problems.27,28 In addition, the massive migration of labour from agriculture has an impact on labour-intensive crops like rice.29 Maize, sorghum, millets, wheat, and pulses are projected to grow slightly in area. Implementation of interventions aimed at enhancing productivity are important to increase rice production.
Conclusion
Rice in Tanzania experienced a growth in the area under production at a significant rate of 7.48% in the first period and 8.44% in the second period, while in general, the area under production grew at a rate of 6.22% annually over the 33-year period. The CAGRs of production were 4.97%, 6.41% and 4.8% in the first, second and third periods, respectively.
Over the 33-year period, production grew at a rate of 5.81% per annum. The CAGR of productivity was significant at -2.33% in the first period and 4.73% in the third period. Despite the observed growth in area under production, production and productivity, the growth is inconsistent, as indicated by the presence of instabilities.
Throughout the study period, area instability decreased from 29.73, 19.4, and 9.7 in the first, second, and third periods, respectively. Production instability varied over time, from 15.27, 18.55, and 17.07 for the first, second, and third periods, respectively. Productivity instability was low in the first period (11.34) and third period (12.39), whereas it was medium in the second period (25.22). In general, instabilities for the area, production and productivity of rice were 19.06, 27.13 and 21.11, respectively, in a 33-year duration. Productivity instability was slightly higher than area instability, indicating that productivity variation was a major source of variation in rice production in Tanzania.
Rice is the third most stable crop in the country in terms of area under production retention over the previous 10 years. It retained 39.2% from its previous year's area and lost 15.38% to pulses and 45.45% to other food crops, while it gained 16% from maize. The area under rice production is projected to decrease from 1 073 486 ha in the period 2019/2020 to 1 049 037 ha for the period 2020/2021 and 1 034 204 ha for the period 2021/2022, as a result of variations in non-stationary factors of productions like rainfall (drought), shortage of inputs, pests, diseases and marketing problems. Overall, Tanzanian rice production has been growing over the entire period of analysis, which is mostly a result of the expansion in the area under production. Because of the productivity increase over the last 10 years, the future looks bright. The productivity growth is a result of various initiatives, including the National Rice Development Strategy, that were put in place by the government and other stakeholders.
With the rice area under production projected to fall, the Tanzanian authorities must reconsider their policy measures to align with the growth in rice consumption. The policies, programmes and initiatives must focus on increasing productivity and reducing post-harvest losses so that the available quantity for consumption will increase. The development and promotion of the use of high-yielding varieties, optimum input use, and development of rice irrigation infrastructures might increase the productivity of rice and sustainable food self-sufficiency.
Acknowledgements
This work is based on the PhD research of A.L.M. in the division of Agricultural Economics of ICAR-Indian Agricultural Research Institute.
Competing interests
We have no competing interests to declare.
Authors' contributions
A.L.M.: Conceptualisation, methodology, data collection, data analysis, writing - initial draft. D.R.S.: Conceptualisation, methodology, validation, writing revisions, student supervision.
References
1. Bank of Tanzania (BOT). Annual report 2018/19 [webpage on the Internet]. c2019 [cited 2021 Feb 05]. Available from: https://www.bot.go.tz/Publications/Filter/34 [ Links ]
2. Leyaro V Boulay B, Morrissey O. Food crop production in Tanzania: Evidence from the 2008/09 National Panel Survey Research report to IGC Tanzania number F-40110-TZA-1. London: International Growth Center; 2014. [ Links ]
3. National Bureau of Statistics (NBS). Tanzania in figures, a 2018 government document. Dodoma: NBS; 2018. Available from: https://www.nbs.go.tz/index.php/en/tanzania-in-figures/422-tanzania-in-figures-2018 [ Links ]
4. Sekiya N, Oizumi N, Kessy TT, Fimbo KMJ, Tomitaka M. Importance of market-oriented research for rice production in Tanzania. A review. Agron Sustain Dev. 2020;40(1), Art. #7. https://doi.org/10.1007/s13593-020-0611-1 [ Links ]
5. United Republic of Tanzania (URT). National Rice Development Strategy Phase ii (NRDS II) 2019-2030. Dodoma: URT; 2019. [ Links ]
6. United Republic of Tanzania (URT). Agricultural and livestock policy 1997. Dar es Salaam: URT; 1997. [ Links ]
7. United Republic of Tanzania (URT). Agricultural sector development programme (ASDP) Support through Basket Fund. Dar es Salaam: URT; 2006. [ Links ]
8. United Republic of Tanzania (URT). Agricultural sector development programme Phase two (ASDP II). Dar es Salaam: URT; 2016. [ Links ]
9. Saito K, Dieng I, Toure AA, Somado EA, Wopereis MCS. Rice yield growth analysis for 24 African countries over 1960-2012. Glob Food Sec. 2015;5:62-69. http://dx.doi.org/10.1016/j.gfs.2014.10.006. [ Links ]
10. CGIAR Research Program on Rice. Rice productivity [webpage on the Internet]. c2021 [cited 2021 Mar 18]. Available from: http://ricepedia.org/rice-as-a-crop/rice-productivity [ Links ]
11. United Republic of Tanzania (URT). National rice development strategy (NRDS). Dar es Salaam: URT; 2009. [ Links ]
12. Bezabeh E, Haregewoin T, Haile GD, Daniel F, Belay B. Change and growth rate analysis in area, yield and production of wheat in Ethiopia. Int J Dev Res. 2014;4(10):1994-1995. [ Links ]
13. Adeoye IB, Olanrewaju O, Adegbite O, Balogun OL. Growth and trend analysis of area, production and yield of major fruits in Nigeria. In: Proceedings of 37th annual conference of the Horticultural Society of Nigeria (HORTSON) "OWO MADE 2019"; 2019 November 18-22; Lafia, Nigeria. Horticultural Society of Nigeria; 2019. p. iii-vii. [ Links ]
14. Ikuemonisan ES, Mafimisebi ET, Ajibefun K. Cassava production in Nigeria: Trends, instability and decomposition analysis (1970-2018). Heliyon. 2020;6(10), e05089. https://doi.org/10.1016/j.heliyon.2020.e05089 [ Links ]
15. Nisha Nain M, Aneja DR. Growth analysis of area, production and productivity of wheat crop in Haryana and India. J Exp Biol Agric Sci. 2019;7(3):266-272. [ Links ]
16. Ayalew B. Trends, growth and instability of finger millet production in Ethiopia. Res J Agric Environ Manag. 2015;4(2):78-81. [ Links ]
17. Bisht A, Kumar A. Growth and instability analysis of pulses production in India. Int J Agric Sci. 2018;10(14):6722-6724. [ Links ]
18. Ardeshna NJ, Shiynai RL. Dynamics of cropping pattern in Gujarat state: A Markov chain approach. Asian Acad Res J Soc Sci Humanit. 2013;1(9):56-66. [ Links ]
19. Devi DAR, Reddy RU, Madavi B, Ravi P Sadvi P Dynamics of cropping pattern in Karimnagar District of Telangana - A Markov chain approach. Asian J Agric Ext Econ Sociol. 2019;37(4):1-5. https://doi.org/10.9734/AJAEES/2019/v37i430281 [ Links ]
20. Jalikatti V, Poddar RS. An economic analysis of changing cropping pattern in Almatti Command Area of Karnataka, India. Int J Curr Microbiol Appl Sci. 2019;8(10):1052-1059. https://doi.org/10.20546/ijcmas.2019.810.123 [ Links ]
21. Mkonda MY, He X. Agricultural history nexus food security and policy framework in Tanzania. Agric Food Sec. 2018;7:75. https://doi.org/10.1186/s40066-018-0228-7 [ Links ]
22. Bezabeh E. Trends, growth and instability of teff production in Ethiopia. Int J Recent Res Life Sci. 2016;3(4):10-13. [ Links ]
23. Mkanthama J, Makombe G, Kihoro J, Ateka EM, Kanjere M. Technical efficiency of rainfed and irrigated rice production in Tanzania. Irrig Drain. 2018;67(2):233-241. https://doi.org/10.1002/ird.2185 [ Links ]
24. Tanzanian Ministry of Agriculture. Tanzania publications [webpage on the Internet]. c2021 [cited 2021 Mar 15]. Available from: https://www.kilimo.go.tz/index.php/en/resources/category/statistics [ Links ]
25. FAOSTAT. Food and agriculture data [webpage on the Internet]. c2021 [cited 2021 Feb 06]. Available from: http://www.fao.org/faostat/en/#data/ [ Links ]
26. Sunandini GP Paul KSR, Irugu SD. Analysis of trend growth and instability in rice production in Andhra Pradesh. Curr J Appl Sci Technol. 2020;39(42):40-46. https://doi.org/10.9734/cjast/2020/v39i4231129 [ Links ]
27. Nkwabi J, Sharma R, Dev K, Samriti and Sharma, S. Challenges for small scale rice farmers - A case study from Tanzania. Econ Aff. 2021;66(1):149-155. https://doi.org/10.46852/0424-2513.L2021.19 [ Links ]
28. Suleiman R. Local and regional variations in conditions for agriculture and food security in Tanzania: A review. AgriFoSe2030 report; 2018. [ Links ]
29. Wineman A, Jayne TS, Modamba EI, Kray H. The changing face of agriculture in Tanzania: Indicators of transformation. Dev Policy Rev. 2020;38(6):685-709. https://doi.org/10.1111/dpr.12491 [ Links ]
 Correspondence:
Abel Mtembeji
Email: abell82@yahoo.com
Received: 30 Apr. 2021
Revised: 23 June 2021
Accepted: 28 June 2021
Published: 29 Sep. 2021
Editors: Terresa Coutinho, Salmina Mokgehle
Funding: None

