


Servicios Personalizados
Articulo
 Inglés (pdf)
 Articulo en XML
 Referencias del artículo
Indicadores

Links relacionados
-
 Citado por Google
 -
 Similares en Google
Compartir

 Permalink
South African Journal of Science
versión On-line ISSN 1996-7489
versión impresa ISSN 0038-2353
S. Afr. j. sci. vol.117 no.9-10 Pretoria sep./oct. 2021
http://dx.doi.org/10.17159/sajs.2021/7477
RESEARCH ARTICLE
Analysis of extreme rainfall and drought events using statistical and fractal methods: A case study of Mauritius
Reena H. SeebocusI; Michel R. LollchundI; Miloud BessafiII
IDepartment of Physics, University of Mauritius, Réduit, Mauritius
IIEnergy, Electronic and Processes Laboratory, University of La Réunion, Saint-Denis, Réunion
ABSTRACT
Due to climate change, extreme rainfall and drought events are becoming more and more frequent in several regions of the globe. We investigated the suitability of employing statistical and fractal (or scaling) methods to characterise extreme precipitation and drought events. The case of the island of Mauritius was considered, for which monthly mean rainfall data for the period January 1950 to December 2016 were analysed. The generalised extreme value distribution was used to extract the 10- and 20-year return levels and the Standardised Precipitation Index (SPI) was used to identify anomalous wet and dry events. A log-term correlation analysis was also performed to characterise the relationship between maximum rainfall and its duration. The results indicate that the 10-year return level is approximately between 500 mm and 850 mm and the 20-year return level is between 600 mm and 1000 mm. Results also show that the extreme maximum rainfall events occur mostly during austral summer (November to April) and could be related to the effects of tropical cyclones and La Niña events, while anomalous dry events were found to be significantly persistent with very long periods of drought. Moreover, there was a strong correlation between maximum rainfall and its duration. The methodology used in this work could be very useful in similar studies for other Small Island Developing States.
SIGNIFICANCE:
• We show the usefulness of both statistical and fractal methods to understand occurrences of extreme precipitation events.
• We identify anomalous wet and dry events in rainfall time-series data using the Standardised Precipitation Index.
Keywords: extreme events, climate change, generalised extreme value distribution, Standardised Precipitation Index, fractal method
Introduction
Recent events occurring worldwide, such as the global heat record in 2016, major flood events in different parts of the world, the rapid melting of glaciers and sea level rise, among others, are reminders that the climate is changing more rapidly than in preceding centuries. The warming of our atmosphere and its effects on our natural and ecological systems are unavoidable and already palpable. Among the various natural disasters which affect humankind, heavy rainfall and long periods of drought have been reported to be detrimental to the environment, with disastrous consequences on the ecosystem, agriculture, and infrastructure as well as on the people facing such extremes.1 For instance, in 2012, people in the central and western USA had to live in abnormally dry conditions due to persistent heat waves. This calamity put the health and safety of these people at risk and caused more than USD30 billion in damages.2 Heavy rainfall can contribute to flash floods, resulting in water accumulation in flood prone areas, which is very dangerous. The year 2018 marked the occurrence of several deadly flash floods such as those in India, France and Vietnam, which caused several casualties.3,4
Heavy rainfall and severe droughts are global phenomena that affect major parts of the world, and are even seen to impact regions like Small Island Developing States.5,6 Small Island Developing States are found mostly within the tropical belt and are very vulnerable to these calamities which are becoming increasingly frequent.7 Moreover, with the growing populations on these islands and the increasing demand for a higher standard of living, it is important that decision-makers and urban planners have knowledge of extreme weather occurrences for better water resources management. To our knowledge, no rigorous study has been undertaken to quantify the statistical distributions of these calamities for Small Island Developing States. Results of statistical analyses of extreme events are necessary to help develop methods and strategies for flood disaster mitigation. We, therefore, aimed to reduce this void by employing statistical and fractal (or scaling) methods to characterise extreme precipitation and drought events. Our focus was on the island of Mauritius, and this study can serve as an example for similar islands.
Mauritius is a small island of volcanic origin and has a highly complex topography with an elevated central plateau. The geographical positioning of the island in the South West Indian Ocean region makes it vulnerable to diverse meteorological phenomena. Its prevailing weather is, however, mainly dominated by the monsoon regime and trade winds. The island is also subjected to the recurrent formation of tropical cyclones, thunderstorms and lightning as well as heavy rainfall in the summer seasons.8-11 Mauritius' history is marked by unprecedented flash flood events which occurred in March 2008, February and March 2013, January 2015, February 2016, January 2018, December 2018 and, more recently, in January and February 2019. Some of these torrential rainfall events unfortunately caused the loss of human life and major property damage. The Mauritius Meteorological Services (MMS) characterise torrential rain conditions over the island as 'a prevailing weather which generates 100 mm of widespread rainfall in less than 12 hours and when such rainy conditions are likely to persist for several hours'12.
Another hazard in the aftermath of heavy rainfall is landslides, which can occur on hill or mountain slopes which are considered high-risk areas. The MMS has pointed out that, during recent years, heat waves are lasting longer and the intensification trends of cyclones are steeper.12 Hence, the impacts of climate variability in the form of extreme drought and rainfall events have become an issue of great concern due to the increasing dependence on rain-fed agricultural activities and the problem of water accumulation in some regions. Dhurmea et al.13 presented a multi-temporal drought climatology for Mauritius for the period 1953-2007 using the Standard Precipitation Index (SPI). They produced high-resolution maps showing regions more prone to drought occurrence as well as regions with a rainfall surplus. Seebocus et al.11 studied the statistical distribution of the rainfall data for Mauritius for the period 1950-2016 as well as the trend in the data using the Ensemble Empirical Mode Decomposition method. Their results indicate that three distributions - the log-normal, inverse Gaussian and the generalised extreme value (GEV) distribution - can be used to study the rainfall trend for Mauritius. The Ensemble Empirical Mode Decomposition analysis revealed that rainfall is strongly correlated to different meteorological phenomena such as tropical cyclones, quasi-biennial oscillations and the El-Niño Southern Oscillation (ENSO).
Raja and Aydin10 analysed the rainfall variation of Mauritius by using data from 53 meteorological stations over a period of 30 years. The non-parametric Mann-Kendall and Spearman's rho statistical tests were used in the study to characterise the variation in annual precipitation. The results indicated both increasing and decreasing trends in the precipitation pattern across the island. It was noted that the majority of regions experienced a decrease in rainfall in the time interval 1996 to 2000, which was attributed to the 1998-2000 drought event contributed by the influence of a moderate La Niña event. Overall, an increase in the precipitation pattern was observed throughout the island. Raja and Aydin14 extended their work to determine the regional rainfall trend of Mauritius using data collected at 52 meteorological stations for the period 1981 to 2010. Principal cluster analysis, cluster analysis and Kriging techniques were used to characterise the rainfall trend over the island. Their results indicated a decrease in rainfall between the southeast and northwest, which was attributed to the southeast trade winds and the altitudinal difference between the coastal areas and the central plateau.
Understanding the characteristics of heavy rainfall and drought at both temporal and spatial scales and estimating the return period associated with their occurrence is crucial in flood monitoring processes as well as in preparedness for severe drought events. It is also important to know the inter-relationship between these events and large-scale ocean-atmospheric processes.
Methodology
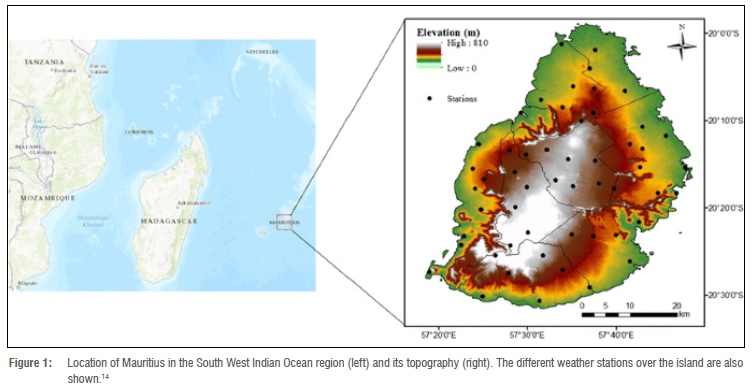
The study area and its climatic conditions
The island of Mauritius (Figure 1) is situated at latitude -20.2 and longitude 57.3. The island is influenced by tropical weather with two seasons, namely austral summer (November to late April) and austral winter (June to September), with May and October being transition months. The wet season extends from November to April (austral summer) with a farthest south position of Inter-Tropical Convergence Zone (ITCZ) resulting in strong convective rainfall activity. Conversely, from June to September (austral winter), active trade winds occur over Mauritius with more stable atmospheric air and less rainfall.12,15 In addition, the precipitation is modulated on an inter-annual time scale (greater than one year) in relationship with the influence of large-scale circulation patterns such as the El-Niño Southern Oscillation, Indian Ocean Dipole and tropical cyclones.
According to the MMS, studies have confirmed an increasing trend in the occurrence of extreme weather and climate events in the South West Indian Ocean region.16 The increase in temperature has impacted the hydrological cycle over the island. Long-term time series of rainfall amounts over the past century show a decreasing trend in annual rainfall over Mauritius; however, over the last two decades, there has been a significant increase in the frequency of severe weather events such as extreme precipitation causing flash floods due to water accumulation in flood prone areas and the formation of more intense tropical cyclones.12
Material and methods
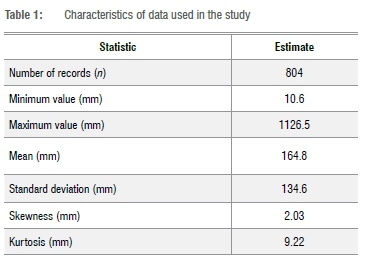
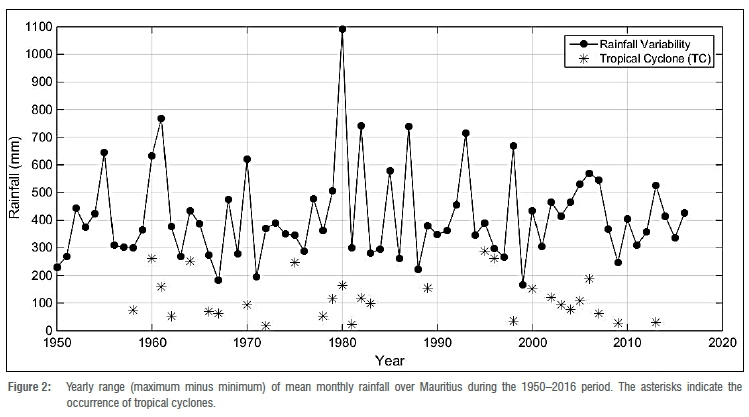
Monthly mean rainfall data (CRU TS 4.01 data sets) for the period 19502016 obtained from the Centre for Environmental Data Analysis17 were used for the analysis. This data set is a gridded satellite data product, on high-resolution (0.5x0.5 degree) grids, which is publicly available, and covers the period 1901-2016. The data includes climatic variables such as cloud cover, diurnal temperature range, frost day frequency, precipitation, daily mean temperature, monthly average daily maximum temperature, water vapour and wet day frequency. The data were checked for homogeneity using the Pettit test18 and it was found that all data values before 1950 were redundant and were therefore omitted. Figure 2 shows the yearly rainfall pattern over Mauritius during the 1950-2016 period. It indicates the quasi-periodic behaviour of the rainfall distribution over the island. Figure 2 also includes occurrence of tropical cyclones during the period of study and the amount of precipitation received under the influence of the tropical cyclones. Table 1 highlights some characteristics of the data used for the study.
Extreme value analysis
Extreme value theory is the study of extreme and rare events based on the Fisher-Tipett theorem, which can be regrouped into two categories: the block maxima and the peaks over threshold. The block maxima method consists of distributing the data set into equal non-overlapping periods and determining the maximum that occurs in each period, thus restricting the analysis to only maximum values. The peaks-over-threshold method defines a threshold value and deals with all values that exceed the threshold.19,20 As explained in the work of Ferreira and De Haan20, the block maxima method is more efficient than the peaks-over-threshold method as it produces the least associated mean square error and smallest difference between the extreme value index and the quantile estimator. Seebocus et al.11 showed that the frequency distribution of rainfall data for Mauritius (see Figure 3) can be represented using the GEV distribution. In this study, the block maxima method is used with the GEV distribution, where the cumulative distribution function is formulated as21:
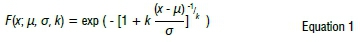
where u is the mean, a is the standard deviation and k is the shape parameter. The aim of fitting the GEV distribution to the extreme rainfall data is to determine the return level of extreme events for specific return periods. The return level provides an estimate of the maximum rainfall that might occur at a specific time.21
The calculation procedure of the block maxima method and the return level estimation using the GEV distribution are summarised as follows22:
Assume the data series X1, X2........Xn) is independent and identically distributed.
The maximum data point Mnobtained from the data series is assumed to be the data corresponding to the extreme event, and it is represented as

Using the block maxima method, the cumulative distribution function can thus be written as indicated by Equation 3, where F(x) represents the GEV cumulative distribution function.

The GEV distribution is fitted to the maximum data set Mnobtained and the GEV parameters (u, σ, k) and the confidence intervals are estimated using the maximum likelihood estimation technique. The maximum likelihood estimation method is preferred as it is relatively simple to use compared to the Bayesian technique and it can be used to estimate the parameters of large data sets and their associated confidence intervals with little uncertainty.23
The return level occurring at a specific period can be estimated through interpolation of the results obtained.
Drought and flood analysis
Drought is a natural process, which occurs due to the lack of moisture in the atmosphere, which in turn results in a deficiency in precipitation for a prolonged time and this evolves slowly with time.24 The effect of drought is worsened by other external factors such as high temperature, high wind speed and low moisture content. The impacts and duration of drought events are expected to increase due to the exacerbating effect of climate change.25
As identified by Wilhite and Glantz26, drought events can be categorised into six types: meteorological, climatological, atmospheric, agricultural, hydrologic and water management. Drought behaviour is not the same for different water resources and keeps varying at different timescales, which make its analysis difficult.
The SPI was proposed by McKee et al.24 as the best drought monitoring index as it can be used to monitor all stages of a drought event from its onset to its completion for different water resources at different timescales. The SPI is a relatively simple tool which requires only precipitation data for a period of at least 30 years as the input parameter.
The SPI is calculated as follows24,27:
Fit the rainfall data to the Gamma probability distribution function which is given as:
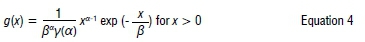
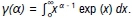
where a is the shape parameter, ß is the scale parameter, x is the precipitation amount and y(a) is the Gamma function defined by
Determine the timescale of i periods, where (/ = 1,2,3.......72 months) which depicts the number of months for which the drought will be investigated.
Estimate the corresponding parameters of the Gamma probability distribution function using the maximum likelihood estimation method.
Transform the result obtained to the standardised normal distribution to estimate the Z-distribution. This normalisation process is done as rainfall follows a skewed distribution as shown in Figure 3.
A drought event, as explained by McKee et al.24, occurs when the SPI is continuously negative. A value less than -2 indicates extremely dry conditions. When the SPI becomes positive it indicates the end of dry conditions, and when it becomes greater than 1, wet conditions begin. Therefore, as the SPI is standardised, it can be used to monitor both dry as well as wet events at any timescales and locations and it is unaffected by topology.25,28
Scale and log-term correlation analysis
Rainfall data exhibit both spatial and temporal variations, which can be studied using fractal (or scaling) theory. The fractal patterns of rainfall data vary differently in both cases; at spatial resolution, the pattern is affected by geography of the study areas, while at temporal resolution the pattern is affected mainly by climatic conditions.29 Jennings30 was the first to propose a scaling law between the global maximum of rainfall and duration. The exponent of the power law discovered by Jennings was 0.5 for rainfall durations between 1 min and 1 year.
Rescaled range analysis (R/S), originally introduced by Hurst31 is useful to measure the persistence and autocorrelation in time series. Such analysis assesses the Hurst exponent (H) of the power relationship between R/S parameter and duration. The Hurst exponent (H) is used as a measure of long-range dependence in time series.32 As stated by Ceballos and Largo32, there are different ways to determine the Hurst exponent, namely: adjusted rescale range analysis, detrended fluctuation analysis, and variance time plot analysis.
Discussions about these methods are beyond the scope of this work. The interested reader is referred to Ceballos and Largo32. These three methods have been tested and the results obtained confirmed that the adjusted rescale range analysis returned the lowest mean square error for all the estimated parameters. Hence it was employed in this work.
The Hurst exponent (H) is a statistical method commonly used to classify time series.33 It has been used in diverse application areas such as biomedical signal processing, the financial sector, and climate change.34 The Hurst exponent ranges between 0 and 1 and is classified into three categories as defined by Qian and Rasheed33 and Valle et al.29:
0 < H < 0.5 (Indicates an anti-persistent time series)
0.5 < H < 1 (Indicates a persistent time series)
H = 0.5 (Indicates a random time series)
The first two categories represent the fractal Brownian movement while the third one represents the white noise or classic Brownian movement. A Hurst exponent of 0.5 indicates that there is no dependence between past and future values of the rainfall data under analysis and these types of data series are classified as unpredictable. It should be noted that the larger the value of H, the stronger will be the trend of the time series which increases as H approaches the value of 1.0.29 The estimation of the Hurst exponent (H) is based on the work of Weron35, whereby two different maximum likelihood estimation methods based on the peaks over threshold and the Block Maxima were used.32
Results and discussion
Return level estimation using the GEV distribution
As mentioned in the methodology section, the GEV distribution was used to determine the 10- and 20-year return levels and the block maxima method was used to extract the maximum rainfall data for each year during the period January 1950 to December 2016.
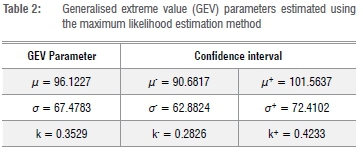
The maximum likelihood estimation equations used to estimate the parameters of the GEV distribution are given by Equations 5-811,36:
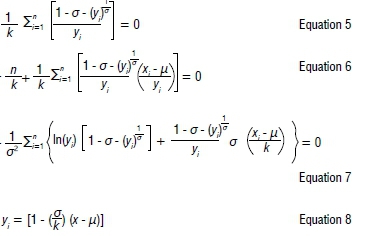
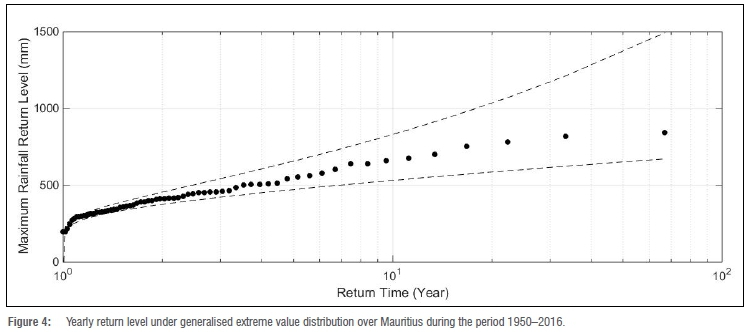
Table 2 summarises the result of the GEV parameters and the lower and upper bounds of the confidence intervals estimated using the maximum likelihood estimation method. The graph of return period against return level is shown in Figure 4. The 10- and 20-year return levels were interpolated from Figure 4; the 10-year return level was approximated to be between 500 mm and 850 mm and the 20-year return level was approximated to be between 600 mm and 1000 mm.
The temporal variation in monthly rainfall and the 10- and 20-year return levels are depicted in Figure 5. The occurrence of extreme wet events was mainly due to the influence on the local weather of tropical cyclones - Alix (January 1960), Beryl (December 1961), Louise (March 1970), Yacinthe (January 1980), Gabrielle (February 1982), Anacelle (February 1998), Hennie (March 2005) and Diwa (March 2006) and three strong El Niño events in the years 1982/1983, 1987/1988 and 1997/1998. The results show that the extreme maximum rainfall events are more prone to occur during austral summer seasons (November-April) as it is during this season that there are more cyclonic activities in the South West Indian Ocean region.
Drought analysis using the SPI
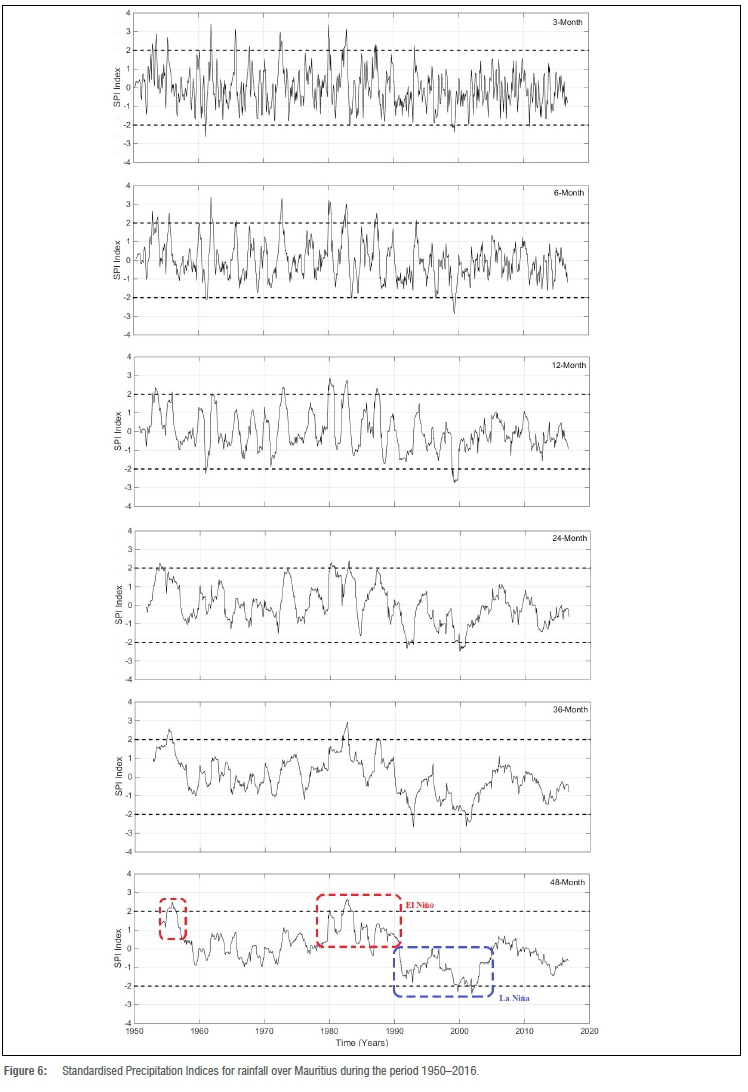
The SPI was estimated at several timescales (3, 6, 12, 24, 36 and 48 months) as shown in Figure 6. Drought events are characterised by negative values on the graphs; as soon as the line goes below zero, it marks the start of a drought event and the end of the drought is marked as soon as the line goes above zero again.24,37 The results indicate that the 1995-1999 period was the longest period of drought for Mauritius (SPI< -2.0). Such an extremely dry event is noticeable on the overall timescale and could be considered as a significantly persistent event. The dry conditions could be related to the 1994/1995 and 1997/1998 La Niña events. For shorter timescales (3 and 6 months), extremely wet events could be related to cyclonic activities and El Niño events. The results obtained indicate that for the 36- and 48-month time scales, the frequencies of the dry events and wet events are almost the same, but the occurrence of dry events is higher than the occurrence of wet events, as indicated by the SPI graphs.
As explained in the work of Bordi et al.38, the occurrence of dry conditions could be explained as a result of the influence of parameters such as orographic effect, land coverage, marine influence and altitude on the rainfall variability over the island.
Scale and log-term correlation
The scaling phenomena for the rainfall data is displayed in Figure 7. Superimposed over Figure 7 is the plot of the world record rainfall measurements of Zhang39. The best-fit lines indicate the relationship between maximum rainfall and duration. For the case of Mauritius, within a range of 1 month to 1 year, the maximum precipitation duration law exponent is 0.44 as compared to 0.9 (which indicates a random process with persistence) or the long-time range duration (>1 year).
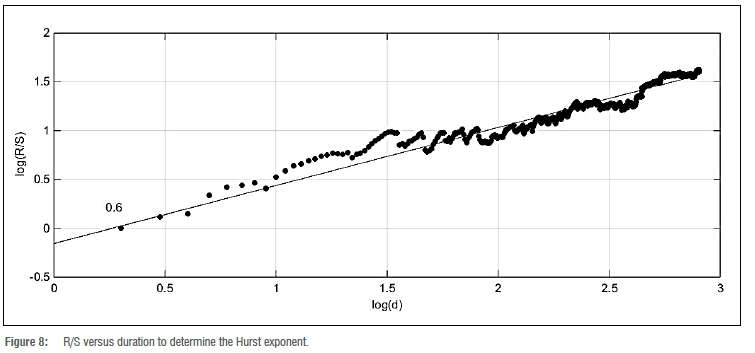
Figure 8 displays the power law relationship between the R/S parameter and duration (log(R/S) versus log(d)). The Hurst exponent (H=0.6) derived from the graph indicates that the time series was found in the persistent regime range, as H was found in the range 0.5 < H < 1. As stated in the literature, time series having larger H values can be predicted more accurately than those having an H value close to 0.5. The result obtained confirms that the Hurst exponent provides a good measure of predictability.
Conclusion
We have presented the analysis of return levels in extreme rainfall events occurring in Mauritius during the period 1950-2016. The GEV distribution was used to determine the 10- and 20-year return levels of extreme events. The GEV distribution was selected as the statistical tool for the estimation of the return level following the work of Seebocus et al.11 who demonstrated that the GEV distribution best fitted the rainfall data for Mauritius, and could thus be used for statistical analysis.
The SPI was also employed to identify anomalous wet or dry events and to characterise the relationship between maximum rainfall and its duration. It was found that extreme maximum rainfall events occurred mostly during austral summer (November to April) and could be related to tropical cyclones and associated with dry conditions in the study region. The results identified the severe drought events which occurred from 1998 to 1990 due to the influence of the La Niña event. The SPI trends demonstrated that drier conditions occur more frequently than wet events over Mauritius. In addition, anomalous dry events were found to be significantly persistent with very long periods of drought and there was a strong correlation between maximum rainfall and its duration. Our findings demonstrate the usefulness of using both statistical and fractal methods to understand occurrences of extreme precipitation events.
Competing interests
We have no competing interests to declare.
Authors' contributions
R.H.S.: Data collection, sample analysis, data analysis, data curation, writing - the initial draft, writing - revisions. M.R.L.: Conceptualisation, writing - the initial draft, student supervision, project leadership, project management. M.B.: Methodology, student supervision, project leadership.
References
1. Climate News Network. Flash floods increase as mercury climbs. Flood List. 2018 Nov 13. Available from: http://floodlist.com/flood-risk/flash-floods-increase-as-mercury-climbs [ Links ]
2. Yin J, Gentine P Zhou S, Sullivan SC, Wang R, Zhang Y, et al. Large increase in global storm runoff extremes driven by climate and anthropogenic changes. Nat Commun. 2018;9(1):4389. https://doi.org/10.1038/s41467-018-06765-2 [ Links ]
3. Heavy storms cause deadly floods in south-western France. The Guardian. 2018 Oct 15. Available from: https://www.theguardian.com/world/2018/oct/15/heavy-storms-cause-deadly-floods-in-south-western-france [ Links ]
4. Taylor A. Devastating monsoon floods in Kerala, India. The Atlantic. 2018 Aug 22. Available from: https://www.theatlantic.com/photo/2018/08/devastating-monsoon-floods-in-kerala-india/568171/ [ Links ]
5. Allam Z, Jones D. Towards a circular economy: A case study of waste conversion into housing units in Cotonou, Benin. Urban Sci. 2018;2(4):118. https://doi.org/10.3390/urbansci2040118 [ Links ]
6. Allam Z. A theoretical application of the Extended Metabolism Model in Port Louis in a bid to promote urban sustainability. Paper presented at: 2nd International Conference on Energy, Environment and Climate Change; 2017 July 5-7; Mauritius. [ Links ]
7. Khoi DN, Trang HT. Analysis of changes in precipitation and extremes events in Ho Chi Minh City, Vietnam. Procedia Eng. 2016;142:229-235. https://doi.org/10.1016/j.proeng.2016.02.036 [ Links ]
8. Senapathi D, Underwood F, Black E, Nicoll MA, Norris K. Evidence for long-term regional changes in precipitation on the East Coast Mountains in Mauritius. Int J Climatol. 2010;30(8):1164-1177. https://doi.org/10.1002/joc.1953 [ Links ]
9. Staub CG, Stevens FR, Waylen PR. The geography of rainfall in Mauritius: Modelling the relationship between annual and monthly rainfall and landscape characteristics on a small volcanic island. Appl Geogr. 2014;54:222-234. https://doi.org/10.1016/j.apgeog.2014.08.008 [ Links ]
10. Raja NB, Aydin O. Trend analysis of annual precipitation of Mauritius for the period 1981-2010. Meteorol Atmos Phys. 2019;131(4):789-805. https://doi.org/10.1007/s00703-018-0604-7 [ Links ]
11. Seebocus RH, Lollchund MR, Bessafi M. Statistical and trend analyses of long-term rainfall data: A case study for Mauritius. Int J Hydrol Sci Technol. 2020;10(5). https://doi.org/10.1504/IJHST.2020.109945 [ Links ]
12. Mauritius Meteorological Services. Climate Services: Climate change [webpage on the Internet]. No date [cited 2019 Feb 19]. Available from: http://metservice.intnet.mu/climate-services/climate-change.php [ Links ]
13. Dhurmea K, Boojhawon R, Rughooputh S. A drought climatology for Mauritius using the standardized precipitation index. Hydrolog Sci J. 2019;64(2):227-240. https://doi.org/10.1080/02626667.2019.1570209 [ Links ]
14. Raja NB, Aydin O. Regionalization of precipitation in Mauritius: A statistical approach. Meteorol Appl. 2019;26:711-719. https://doi.org/10.1002/met.1798 [ Links ]
15. McSweeney C, New M, Lizcano G, Lu X. The UNDP climate change country profiles: Improving the accessibility of observed and projected climate information for studies of climate change in developing countries. Bull Am Meteorol Soc. 2010;91(2):157-166. https://doi.org/10.1175/2009BAMS2826.1 [ Links ]
16. Mauritius Meteorological Services. Climate Services: Seasonal climate forecast [webpage on the Internet]. No date [cited 2019 Feb 19]. Available from: http://metservice.intnet.mu/climate-services/seasonal-climate-forecast.php [ Links ]
17. Centre for Environmental Data Analysis. The CEDA Archive [webpage on the Internet]. c2018 [cited 2019 Mar 12]. Available from: https://archive.ceda.ac.uk [ Links ]
18. Javari M. Trend and homogeneity analysis of precipitation in Iran. Climate. 2016;4(3):44. https://doi.org/10.3390/cli4030044 [ Links ]
19. Dombry C. Existence and consistency of the maximum likelihood estimators for the extreme value index within the block maxima framework. Bernoulli. 2015;21(1):420-436. https://doi.org/10.3150/13-BEJ573 [ Links ]
20. Ferreira A, De Haan L. On the block maxima method in extreme value theory: PWM estimators. Ann Stat. 2015;43(1):276-298. https://doi.org/10.1214/14-AOS1280 [ Links ]
21. Boudrissa N, Cheraitia H, Halimi L. Modelling maximum daily yearly rainfall in northern Algeria using generalized extreme value distributions from 1936 to 2009. Meteorol Appl. 2017;24(1):114-119. https://doi.org/10.1002/met.1610 [ Links ]
22. Shukla RK, Trivedi M, Kumar M. On the proficient use of GEV distribution: A case study of subtropical monsoon region in India. Ann Comput Sci Ser. 2010;8(1):81-93. [ Links ]
23. Coles S, Pericchi LR, Sisson S. A fully probabilistic approach to extreme rainfall modeling. J Hydrol. 2003;273(1-4):35-50. https://doi.org/10.1016/S0022-1694(02)00353-0 [ Links ]
24. McKee TB, Doesken NJ, Kleist J, editors. The relationship of drought frequency and duration to time scales. In: Proceedings of the 8th Conference on Applied Climatology; 1993 January 17-22; Anaheim, CA, USA. Boston, MA: American Meteorological Society; 1993. [ Links ]
25. Baran T, Bacanli UG, Dikbas F. Drought analysis with SPI index and entropy. Eur Water. 2017;60:263-270. [ Links ]
26. Wilhite DA, Glantz MH. Understanding: the drought phenomenon: The role of definitions. Water Int. 1985;10(3):111-120. https://doi.org/10.1080/02508068508686328 [ Links ]
27. Lloyd-Hughes B, Saunders MA. A drought climatology for Europe. Int J Climatol. 2002;22(13):1571-1592. https://doi.org/10.1002/joc.846 [ Links ]
28. Portela M, Zeleñáková M, Santos J, Purcz P Silva A, Hlavatá H. A comprehensive drought analysis in Slovakia using SPI. Eur Water. 2015;51:15-31. [ Links ]
29. Valle MV García GM, Cohen IS, Klaudia Oleschko L, Ruiz Corral J, Korvin G. Spatial variability of the Hurst exponent for the daily scale rainfall series in the state of Zacatecas, Mexico. J Appl Meteorol Clim. 2013;52(12):2771-2780. https://doi.org/10.1175/JAMC-D-13-0136.1 [ Links ]
30. Jennings AH. World's greatest observed point rainfalls. Mon Weather Rev. 1950;78(1):4-5. https://doi.org/10.1175/1520-0493(1950)078<0004:WGOPR>2.0.CO;2 [ Links ]
31. Hurst HE. Long-term storage capacity of reservoirs. Trans Am Soc Civil Eng. 1951;116:770-799. https://doi.org/10.1061/TACEAT.0006518 [ Links ]
32. Ceballos RF, Largo FF. On the estimation of the Hurst exponent using adjusted rescaled range analysis, detrended fluctuation analysis and variance time plot: A case of exponential distribution [preprint]. arXiv. 2018. arXiv:180508931. Available from: https://arxiv.org/abs/1805.08931 [ Links ]
33. Qian B, Rasheed K. Hurst exponent and financial market predictability. Proceedings of IASTED Conference on Financial Engineering and Applications. 2004:203-209. [ Links ]
34. Kulish V Horák V. Forecasting the behavior of fractal time series: Hurst exponent as a measure of predictability. Review of the Air Force Academy. 2016(2):61. https://doi.org/10.19062/1842-9238.2016.14.2.8 [ Links ]
35. Weron R. DFA: MATLAB function to compute the Hurst exponent using Detrended Fluctuation Analysis (DFA). HSC Software M11002. Wroclaw: Hugo Steinhaus Center, Wroclaw University of Technology; 2011. [ Links ]
36. Martins ES, Stedinger JR. Generalized maximum-likelihood generalized extreme-value quantile estimators for hydrologic data. Water Resour Res. 2000;36(3):737-744. https://doi.org/10.1029/1999WR900330 [ Links ]
37. Hayes MJ, Svoboda MD, Wiihite DA, Vanyarkho OV. Monitoring the 1996 drought using the standardized precipitation index. Bull Am Meteorol Soc. 1999;80(3):429-438. https://doi.org/10.1175/1520-0477(1999)080<0429:MTDUTS>2.0.CO;2 [ Links ]
38. Bordi I, Frigio S, Parenti P Speranza A, Sutera A. The analysis of the Standardized Precipitation Index in the Mediterranean area: Large-scale patterns. Ann Geophys. 2001;44(5-6):965-978. https://doi.org/10.4401/ag-3549 [ Links ]
39. Zhang H. Extreme rainfall events in simulations, theory and related large-scale dynamic processes [dissertation]. Hamburg: University of Hamburg; 2014. [ Links ]
 Correspondence:
Michel Lollchund
Email: r.lollchund@uom.ac.mu
Received: 12 Oct. 2019
Revised: 07 Jan. 2021
Accepted: 19 Feb. 2021
Published: 29 Sep. 2021
Editor: Yali Woyessa
Funding: None

