


Servicios Personalizados
Articulo
 Inglés (pdf)
 Articulo en XML
 Referencias del artículo
Indicadores

Links relacionados
-
 Citado por Google
 -
 Similares en Google
Compartir

 Permalink
South African Journal of Science
versión On-line ISSN 1996-7489
versión impresa ISSN 0038-2353
S. Afr. j. sci. vol.117 no.9-10 Pretoria sep./oct. 2021
http://dx.doi.org/10.17159/sajs.2021/9304
RESEARCH ARTICLE
Cold water temperature anomalies on the Sodwana reefs and their driving mechanisms
Calvin Wells; Justin Pringle; Derek Stretch
Environmental Fluid Mechanics Lab, University of KwaZulu-Natal, Durban, South Africa
ABSTRACT
The Sodwana reef system experiences short-term temperature fluctuations that may provide relief from bleaching and be crucial in the future survival of the system. These temperature fluctuations are best described as cold water temperature anomaly events that occur over a period of days and cause a drop in temperature of a few degrees on the reef. We explored the statistical link between the temperature anomalies and the regional hydrodynamics to elucidate the driving mechanisms of the temperature anomalies around Sodwana. Temperature measurements taken between 1994 and 2015 on Nine-Mile Reef at Sodwana show that temperature anomalies occur on average three times per year at Sodwana and predominantly during the summer months. A conditional average of altimetry data at the peak of the temperature anomalies showed the emergence of a negative sea surface height (SSH) anomaly pattern and associated cyclonic eddy just offshore of the Sodwana region. The cyclonic eddies associated with the temperature anomalies originate on the southwestern edge of Madagascar and migrate westwards until they interact with the African coastline at Sodwana. Instantaneous altimetry SSH fields over the 21-year period were cross-correlated to the conditionally averaged SSH field within a 2° region around Sodwana. It was found that 33% of the temperature anomalies at Sodwana were not associated with the presence of cyclonic eddy systems. This finding suggests that an offshore cyclonic eddy interacting with the shelf is not the sole driving mechanism of the temperature anomalies.
SIGNIFICANCE:
• Cold water temperature anomalies that occur at Sodwana are believed to play an important role in the sustainability of the coral reefs; however, their driving mechanisms are not yet well understood. We identified the annual frequency and seasonal occurrence of the temperature anomalies at Sodwana. Conditionally averaged sea surface heights delineated regional hydrodynamic patterns associated with the temperature anomalies. These hydrodynamic patterns could be a possible driving mechanism to be explored in future research. Previous research associated these temperature anomalies with a single regional hydrodynamic pattern around Sodwana; however, additional hydrodynamic patterns associated with the temperature anomalies have been found based on the length of the data sets used in this study.
Keywords: coral reefs, Sodwana reefs, hydrodynamics, temperature anomalies, coral bleaching
Introduction
Coral reefs play a strong role in sustaining complex nearshore ecosystems. However, these coral reef systems are acutely sensitive to their surrounding ambient conditions. For example, temperature is vital to the sustainability and health of the coral reef system.1 Coral reefs are commonly located in tropical environments and thrive in warm water that ranges between 18 °C and 30 °C.2 However, corals become stressed when exposed to elevated temperatures for extended periods.3,4 During these periods, the corals expel their symbiotic dinoflagellate algae, which is known as coral bleaching.4,5 Severe bleaching may result in permanent reef damage and coral mortality from which the reef may not recover.4,6
Coral bleaching events at a global scale have been increasing in recent decades.7,8 It is likely that these events will increase in frequency due to global climate change.9,10 However, coral reefs located in certain high-latitude regions have a high bleaching refuge potential and are more suited to survive the projected rise in global ocean temperatures.11 This is because these coral reefs are located in regions where there is strong ocean mixing.11 An example is the Sodwana coral reef system located on the northern KwaZulu-Natal coast, South Africa. Sodwana is situated near the origin of the Agulhas Current in an area associated with complex hydrodynamic interactions with the continental shelf.12 Sodwana experiences short-term temperature fluctuations that may provide relief from bleaching and be crucial in the future survival of the system.13,14 These temperature fluctuations are best described as cold water temperature anomaly events that occur over a period of days and cause a drop in temperature of a few degrees on the reef. Roberts et al.15 and Morris et al.16 investigated one specific temperature anomaly event and suggested that the driving mechanism was associated with mesoscale cyclonic eddies interacting with the African coastline and shelf. For example, the presence of a cyclonic eddy near the shelf has been observed to be associated with an offshore deflection of the Agulhas Current that pulls inshore water away from the coast resulting in upwelling on the shelf.15,16 It is still unclear if the time sequence of the temperature anomalies is always the same and whether all temperature anomalies observed at Sodwana are associated with cyclonic eddy upwelling. It is possible that there is a more complex combination of hydrodynamic factors driving the temperature anomalies. Understanding these temperature anomalies and their driving mechanisms is important as it provides a basis for predicting the coral reef health and survival along the Sodwana coastline. Furthermore, if these cold water temperature anomalies are driven by upwelling, as previous research suggests, it means that these events could also provide an influx of nutrients onto the reef.17
In this study, we aimed to elucidate the driving mechanisms of the cold water temperature anomalies around Sodwana, considering all temperature anomalies identified between 1994 and 2015.
Method
Case study site
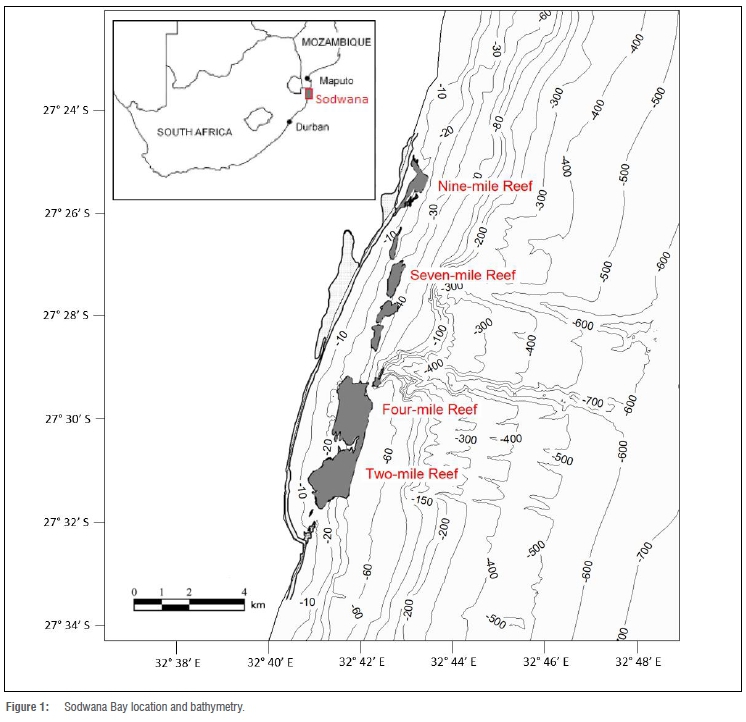
The Sodwana reef system is one of the most southerly coral reefs in the world and comprises several marginal coral reef patches in the Delagoa Bioregion of South Africa.18 The reefs are non-accretive and are rich in coral biodiversity and cover.11,19 These reefs are world renowned and have become an important diving destination internationally. Figure 1 shows the location and bathymetry of the Sodwana region and reef system. The continental shelf in this region is narrow and is characterised by steep gradients and submarine canyons on the continental slope.18 Sodwana is situated near the origin of the warm Agulhas Current, which raises the ocean temperatures in the region into the range that is conducive for coral growth.18 The region also experiences high mesoscale eddy kinetic energy, and these eddies can interact with the complex shelf topography.12
Many coral reef systems located at higher latitudes have already begun to experience the effects of warming events associated with climate change.11 Sodwana has shown resilience to these warming and bleaching events, which has been attributed to strong ocean mixing and short-term cold water anomalies.13 This makes Sodwana an ideal case study site to investigate the complex hydrodynamic features that drive these temperature anomalies and how they influence the sustainability of higher latitude coral reefs.
Data
Measured temperature data
Hourly temperature data measured at Sodwana between 1994 and 2015 were used to investigate the short-term temperature trends on the reefs. The temperature measurements were obtained using an individual (self-contained) Star-Oddi mini underwater temperature recorder with an accuracy of ±0.05 °C, deployed at a depth of 18 m on Nine-Mile Reef (as per Figure 1).15
Satellite data
Satellite altimetry data were used to link regional hydrodynamic patterns to the temperature anomalies observed at Sodwana. Satellite altimetry data are available from the Copernicus Marine Environment Monitoring Service which provides gridded sea surface height (SSH) data and derived geostrophic currents. The data are available globally with a horizontal resolution of 0.25° on a daily time step between 1993 and 2019.
Global eddy trajectory data
Global mesoscale eddy trajectory data were used to investigate the origins and temporal effects of the cyclonic eddies associated with the temperature anomalies at Sodwana. Global mesoscale eddy trajectory data were derived using an autonomous eddy identification and tracking procedure on the SSH satellite altimetry data.20,21 The procedure is a modified version of the method presented by Williams et al.22 The global eddy trajectory data are available from: http://cioss.coas.oregonstate.edu/eddies/.
Temperature analysis
The temperature on the Sodwana reefs fluctuates over a range of time scales.12 The scales range from short hourly scales influenced by the tides to longer scales influenced by regional hydrodynamics and seasonal climatology. The temperature data were filtered to delineate the different time scales based on their frequency.23 Internal waves have been observed to break on continental shelf slopes at a tidal frequency and have been identified as one possible mechanism for pushing colder water onto the shelf.24,25 This becomes an important mechanism for regulating the reef temperature on a diurnal time scale. The temperature data were band pass filtered for periods between 10 h and 14 h to investigate temperature variability at the dominant local tidal frequency. The cold water temperature anomalies observed at Sodwana occur over a longer duration and regulate the reef temperature on a time scale of days.15,16 Therefore, seasonal temperature variations were removed using a high pass filter for periods longer than a month. The remaining temperature signal was then used to identify the cold water temperature anomalies with time scales longer than the tidal periods but much shorter than seasonal variations. The temperature anomalies were identified using a local minimum threshold of -2 °C, which delineated temperature anomalies significantly different from the seasonal mean.
Conditional averaging
The satellite altimetry data were statistically analysed to link regional hydrodynamic features to the observed temperature anomalies. The SSH and geostrophic current fields at the peak of the temperature anomalies were conditionally averaged. Conditional averaging is a technique used when investigating statistically significant patterns in turbulent flow structures.26,27 The conditional average was used to identify regional hydrodynamic patterns during the temperature anomalies that are significantly different from the unconditional mean. The conditional averaging of the SSH is defined as:

where H is the conditional ensemble averaged SSH field, H is the instantaneous SSH field, x is the position vector, tf represents the time at the peak of an individual temperature anomaly, t is the time lag around the peak, 0 is the level of conditional threshold used for identifying temperature anomalies and n0presents the number of temperature anomalies identified with the threshold 0. The U and V geostrophic velocity components were also conditionally averaged and used to calculate the conditionally averaged geostrophic current velocity fields. Time lags were considered from 15 days before until 10 days after the peak of the temperature anomalies.
The Kolmogorov-Smirnov statistic28 was calculated for peak anomaly values within each conditional SSH data set for the various temperature thresholds. This was done to access if the conditional averaged SSH
data sets for various thresholds were significantly different from the unconditional SSH data set at a significance level of 5%.
Cross-correlation
The instantaneous SSH fields over the 21 years were cross-correlated with the conditionally averaged SSH field to assess the fit of the individual anomalies to the conditional average.29 The cross-correlation at each SSH timestep can be calculated with
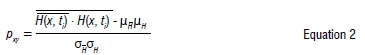
where H .H is the ensemble average of the dot product between the conditionally averaged ensemble SSH field and the instantaneous SSH field at a point in time t,, x is the position vector, μHand μHare the means of the conditionally averaged SSH field and instantaneous SSH field, respectively, and σHand σHare their standard deviations. The cross-correlation coefficients of the individual temperature anomalies were also used to identify any anomalies that do not exhibit the hydrodynamic patterns associated with the conditional average.
Cyclonic eddy tracking
The global cyclonic eddy trajectories were filtered to identify and track the mesoscale cyclonic eddies.20 The identified cyclonic eddy trajectories were used to investigate the origin and temporal evolution of the eddies, and to link them to the observed mesoscale eddies linked to temperature anomalies.
Results
Temperature analysis
Cold water temperature anomalies occur throughout the temperature records on Nine-Mile Reef. Roberts et al.15 identified notable temperature anomalies during the year 2004. Figure 2 presents a time series of the measured temperatures at Nine-Mile Reef during the year 2004 as an example to highlight the temperature anomalies in the data.
Five temperature anomalies can be clearly identified over the duration of the year: two occurring in February, one in April and two in December. Seasonal temperature variations can also be observed with higher temperatures in summer and lower temperatures in winter. Minimum temperatures observed during the summer anomalies were generally lower than the minimum temperatures recorded during winter.
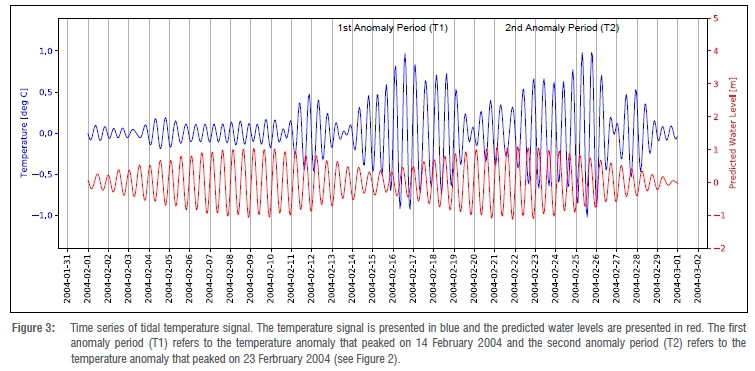
Figure 3 shows an example of the temperature signal filtered at the tidal frequency for the month of February in 2004. This month was selected as an example period as it covers a spring-neap tidal cycle and two temperature anomalies which peaked on 14 February (T1) and 23 February (T2). The predicted water levels near Sodwana have been overlaid onto the time series plot.
The temperature signal filtered at a tidal frequency decreases with the incoming tide and increases with the outgoing tide. The tidal temperature fluctuations vary in amplitude between 0.1 °C and 1 °C. The increase in the temperature signal amplitude seems to amplify over the duration of the temperature anomaly. The variability in amplitude does not appear to coincide with the spring-neap tide cycle.
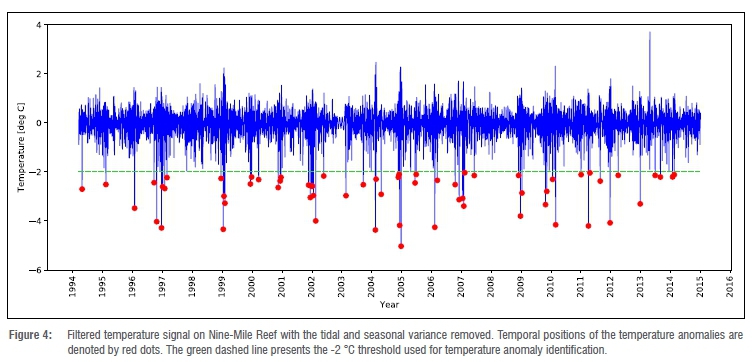
Figure 4 presents a time series of the measured temperature signal at Nine-Mile Reef with the tidal and seasonal temperature variance removed. Figure 4 also shows the temporal positions of the temperature anomalies exceeding the -2 °C threshold. These data were used to identify 63 temperature anomalies over the 21 years' of measured temperature data.
The temperature anomalies last on average for 6 days from start to finish with the longest event (peak of anomaly occurred on 25 December 2012) lasting 10 days and the shortest (peak of anomaly occurred on 6 January 2002) lasting only 3 days. The data indicate a lack of temperature anomalies between 1997 and 1999 and between 2007 and 2009.
Of the 63 temperature anomalies identified, 60% of the events occurred during summer (1 December - 28 February), 17% occurred during spring (1 September - 30 November), 13% in autumn (1 March -31 May) and only 10% of the temperature anomalies events occurred during winter (1 June - 31 August).
Conditionally averaged altimetry data
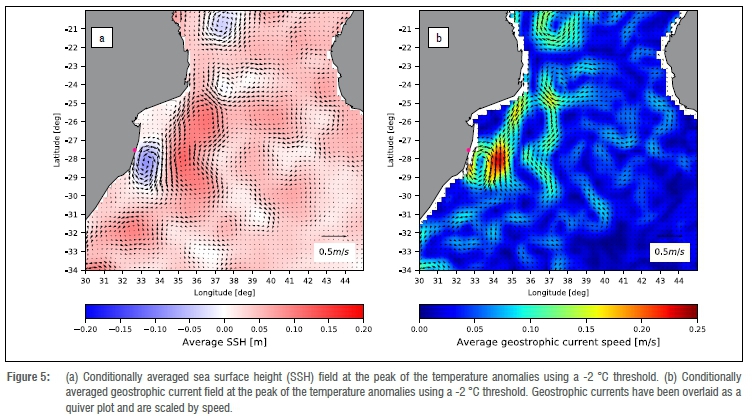
Figure 5 presents the conditionally averaged SSH field and the conditionally averaged geostrophic current speeds at the peak of the 63 temperature anomalies. Both plots have been overlaid with the conditionally averaged geostrophic currents.
A negative SSH anomaly and corresponding cyclonic eddy can be identified just offshore of the Sodwana region. The cyclonic eddy is constrained by the African coastline to the west and a larger anti-cyclonic eddy structure to the east. The negative SSH anomaly has an amplitude of 0.15 m and a cross shore diameter of approximately 200 km.
Temperature anomaly thresholds of -1 °C, -2 °C and -3 °C were investigated to explore their effect on the conditionally averaged SSH fields. SSHs and geostrophic currents at the peak of the identified temperature anomalies for each threshold were conditionally averaged. There were 211 temperature anomalies identified using a threshold of -1 °C, 63 temperature anomalies identified using a threshold of -2 °C, and 20 temperature anomalies identified using a threshold of -3 °C. The Kolmogorov-Smirnov statistic for the -1 °C threshold was 0.085 - lower than the critical value of 0.095. Therefore, the conditional SSH data set for the -1 °C threshold was not significantly different from the unconditional SSH data set. However, the Kolmogorov-Smirnov statistic for the -2 °C threshold was 0.319 - higher than the critical value of 0.172, meaning that the -2 °C conditional SSH data set was significantly different from the unconditional SSH data set. The SSH data set using a threshold of -3 °C was also significantly different from the unconditional SSH data set with a Kolmogorov-Smirnov statistic of 0.434 and a critical value of 0.304.
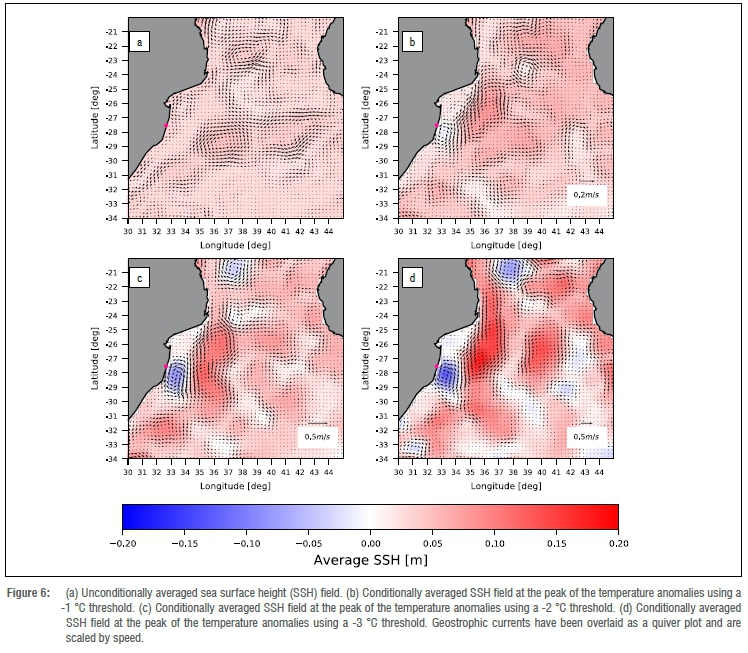
Figure 6 presents the unconditionally averaged SSH field along with the conditionally averaged SSH fields using various thresholds for identification of the temperature anomaly ranging from -1 °C to -3 °C.
In Figure 6, no distinct SSH patterns can be identified from the unconditionally averaged SSH. A negative SSH anomaly with a small amplitude near the Sodwana region emerges from the conditional average when using a threshold of -1 °C; however, this anomaly is not significantly different from the unconditional average. A clear negative SSH anomaly emerges from the conditional average when using a threshold of -2 °C, which is significantly different from the unconditional average. This implies that temperature anomalies associated with a drop of temperature greater than -2 °C can be linked to hydrodynamic patterns that are statistically significantly different from the mean hydrodynamics around Sodwana. The conditional average using a threshold of -3 °C shows the same negative SSH anomaly and cyclonic eddy pattern identified using a threshold of -2 °C. For thresholds lower than -2 °C, the conditional average pattern does not change.
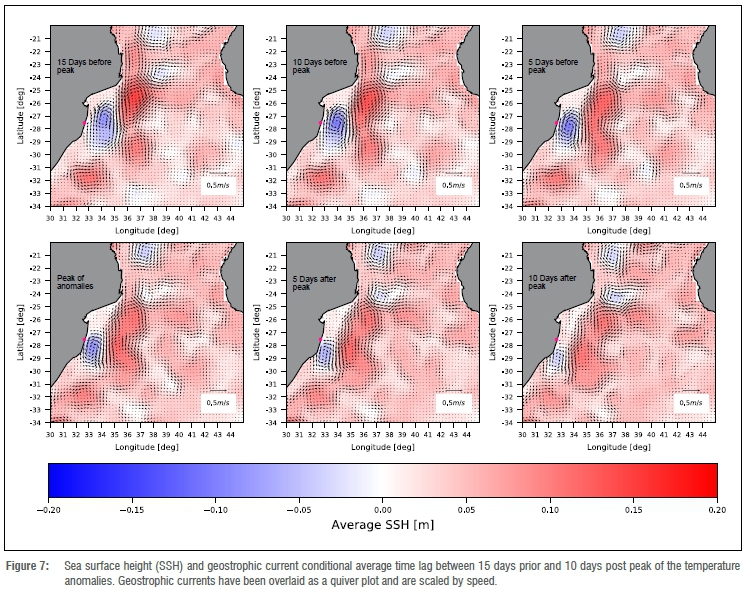
The time lag of the conditional averaging of the SSH and geostrophic currents was varied around the peak of the temperature anomalies to investigate the temporal evolution of the conditionally averaged hydrodynamic patterns. Figure 7 presents the conditionally averaged SSH and corresponding geostrophic current vectors with various time lags. The conditional averages have been presented in 5-day intervals.
The conditional average 15 days prior to the peak of the temperature anomaly shows a well-defined anti-cyclonic eddy just south of the Delagoa Bight peninsula. A cyclonic eddy pattern can be observed to the northeast of Sodwana near the Delagoa Bight. The amplitude of the negative SSH anomaly is below 0.05 m and the cyclonic eddy structure is not yet well defined. The conditional averages from 10 to 5 days before the peak show that the anti-cyclonic and cyclonic eddy both propagate southward parallel to the African coastline. The amplitude of the negative SSH anomaly increases during this period. At the peak of the anomalies, the cyclonic eddy has propagated in a southwesterly direction and the centre of the eddy has moved past the Sodwana region. The southward propagation of the cyclonic eddy results in a net northward geostrophic current direction at Sodwana with a slight offshore component. At 10 days after the anomaly peak, both the anti-cyclonic and cyclonic eddies have propagated further south. The negative SSH anomaly has moved past the Sodwana region and has reduced in amplitude.
Altimetry data cross-correlation
Instantaneous altimetry SSH fields over the 21-year period were cross-correlated to the conditionally averaged SSH field within a 2° region around Sodwana. Figure 8 presents a time series of the cross-correlation coefficients over the 21 years. Also presented in Figure 8 are the temporal positions of the temperature anomalies denoted by red dots. This was done to show the correlation of the SSH of each individual temperature anomaly to the conditional averaged SSH. Figure 8 also presents a histogram of the temperature anomalies correlation coefficient values.
The correlation coefficients of the individual temperature anomalies range from -0.48 to 0.80. A negative SSH anomaly and cyclonic eddy offshore of the Sodwana region was observed for temperature anomalies with a positive correlation coefficient, which accounts for 67% of events identified. This means that 33% of the temperature anomalies were observed without the presence of a cyclonic eddy offshore of Sodwana. There are also many instances in which cyclonic eddies passed the Sodwana region resulting in a high correlation coefficient; however no short-term temperature anomalies were evident. Only 15% of cyclonic eddies that passed the Sodwana region were associated with short-term temperature anomalies.
The temperature anomalies associated with the presence of a cyclonic eddy occur primarily in summer and account for 66% of the positively correlated temperature anomalies. Autumn accounts for 16% of the positively correlated temperature anomalies, winter accounts for 11% and spring accounts for only 7% of temperature anomalies associated with offshore cyclonic eddies. The temperature anomalies that were observed without the presence of an offshore cyclonic eddy occurred predominantly in summer and spring, with a 48% occurrence in summer and a 42% occurrence in spring. Winter and autumn account for only 5% of the temperature anomalies that were observed without the presence of a cyclonic eddy structure offshore of Sodwana.
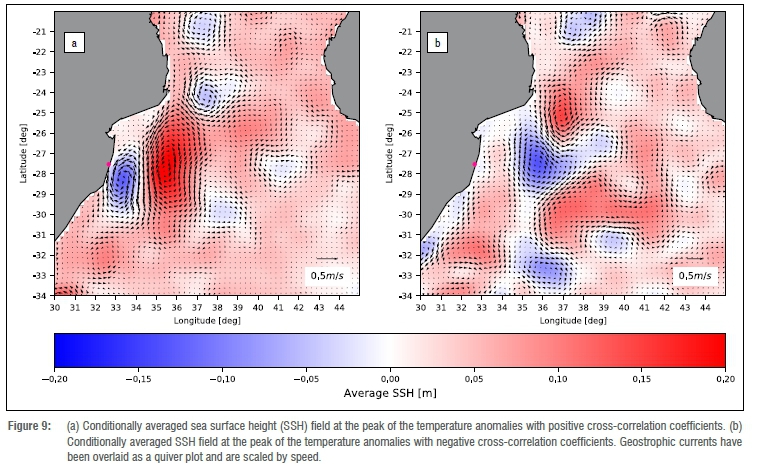
The SSH and geostrophic currents at the peak of the temperature anomalies with positive and negative cross-correlation coefficients were then conditionally averaged separately. Figure 9 presents the separate conditional averages of the sSh at the peak of the temperature anomalies, with positive and negative cross-correlation coefficients.
The conditional average of the temperature anomalies with positive cross-correlation coefficients shows a similar pattern to the original SSH conditional average (see Figure 5); however, the anti-cyclonic eddy structure is stronger and more defined than in the original SSH conditional average. The conditional average of the temperature anomalies with negative cross-correlation coefficients shows a cyclonic and anticyclonic eddy pair situated approximately 200 km offshore of the Sodwana region. The cyclonic eddy structure would not have had any interaction with the Sodwana shelf due to its significant distance offshore of Sodwana. In the Sodwana region there is no negative or positive SSH anomaly pattern.
Cyclonic eddy tracking
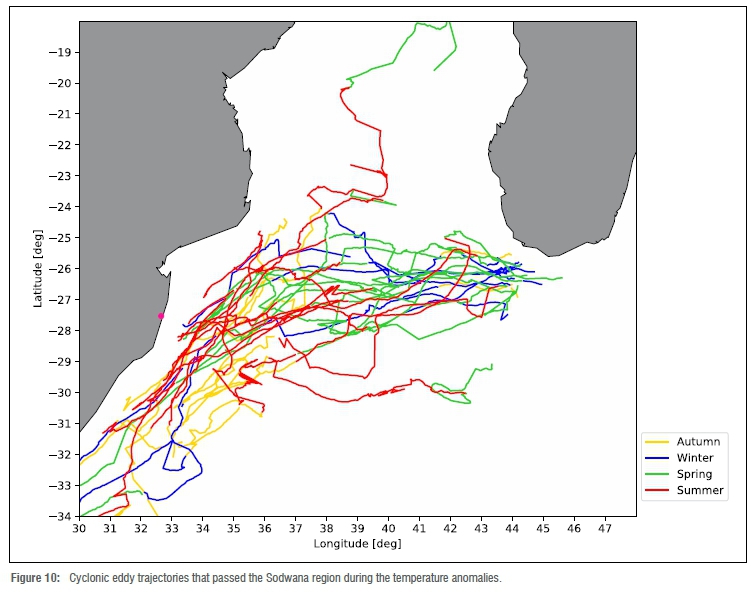
The global eddy trajectory data20 were used to identify the cyclonic eddies offshore of the Sodwana region during the temperature anomaly events. The purpose was to investigate the origin and evolution of the cyclonic eddies associated with the temperature anomalies at Sodwana. Figure 10 presents the 26 eddy trajectories that were identified passing Sodwana at the peak of the temperature anomalies. The seasonal temporal evolution of the cyclonic eddy trajectories has been included in the plot.
The trajectories indicate that the cyclonic eddies originate on the southwestern edge of Madagascar. The eddies then migrate westwards until they interact with the African coastline and subsequently migrate southward parallel to the African coastline. Occasionally the cyclonic eddy structures form in the Mozambique Channel and propagate southwards until they interact with the shelf south of the Delagoa Bight.
Discussion
The temperature measurements on Nine-Mile Reef, with the tidal and seasonal variance removed, show that temperature anomalies occur on average three times per year at Sodwana, and mainly in summer. This finding suggests that the frequency of anomalies provide potential relief from bleaching during the summer months. The temperature anomalies appear to regulate the temperature during the extended periods of elevated temperatures in summer and potentially improve the coral's resilience to bleaching.14 Celliers and Schleyer13 observed bleaching of the Sodwana reefs during the summer months of 1998 and 2000 when temperatures ranged between 27.5 °C and 28.4 °C. The temperature bleaching threshold of 27.5 °C was exceeded 18% of the time during the summer months over the 21 years. However, the bleaching observed by Celliers and Schleyer13 coincided with a period during which no temperature anomalies were observed in the measured data (see Figure 4). This suggests that these anomalies could be important in mitigating bleaching at Sodwana, as noted by Riegl and Piller11.
The conditional average of the altimetry data at the peak of the temperature anomalies indicates the presence of a negative SSH anomaly and corresponding cyclonic eddy offshore of the Sodwana region. The time-lagged conditional averages suggest the cyclonic eddy is present near the Sodwana region for a significant time during the anomaly period (see Figure 6). At the beginning of the time lag, the eddy is situated to the north of the Sodwana region and migrates southward at a rate of approximately 15 km per day. The cyclonic eddy structure also migrates shoreward towards the shelf over the duration of the anomaly period. After the peak of the anomaly, the cyclonic eddy continues to migrate southward and begins to dissipate.
Roberts et al.15 and Morris et al.16 suggest that the presence of this eddy structure is associated with upwelling at the shelf edge and results in the temperature anomalies observed at Sodwana. They suggest that the interaction between the cyclonic eddy and the leading edge of corresponding anti-cyclonic eddy pull water off the shelf, which is replaced with cold water from deeper regions. This observation was based on a small subset of temperature anomalies that were investigated using altimetry data; however, the details of this mechanism remain unclear.
Another possible driving mechanism might be the reversal of the mean current along the shelf as the cyclonic eddies migrate past Sodwana. It is possible that this flow reversal interacts with the complex shelf bathymetry, advecting colder water up the canyons and onto the shelf. The interaction between the regional hydrodynamics and the Sodwana shelf and canyons has yet to be investigated and requires further research to explain this interaction and the resulting effects on temperature on the reef.
The cyclonic eddy trajectory results show that the cyclonic eddies associated with the negative temperature anomalies form in the lee of the southern tip of Madagascar. Quartly and Srokosz30 observed that the majority of cyclonic eddies that interact with the South African coastline form in this region. Halo et al.31 suggest that the formation of these eddies is driven by barotropic and baroclinic instabilities of the southeast Madagascar Current as it passes the southern tip of Madagascar. As these eddies migrate across the Mozambican channel, upwelling occurs in the core of the mesoscale cyclonic eddies bringing cooler deep water to the subsurface layers.31 It is possible that when these eddies interact with the shelf near the Sodwana region, the cooler upwelled core may influence the temperature on the shelf.
The cross-correlation (see Figure 8) showed that the SSH and geostrophic currents at the peak of the anomalies are positively correlated with the conditional average for 67% of the temperature anomalies. This suggests that the SSH and geostrophic current patterns associated with 33% of the temperature anomalies at Sodwana differ significantly from the conditional average of all the temperature anomalies. A conditional average of the temperature anomalies with negative cross-correlation coefficients shows there is still a cyclonic and anti-cyclonic eddy pair at the peak of these anomalies. However, the cyclonic and anti-cyclonic eddy pair is situated approximately 200 km offshore of Sodwana near the Delagoa Bight region and does not interact with the shelf near Sodwana. The anti-cyclonic eddy structure is also situated further north of the cyclonic eddy as opposed to east of the cyclonic eddy as seen in the original conditional average. This suggests that a mechanism different from the eddy-shelf interaction is driving the temperature anomalies at Sodwana for these negatively correlated temperature anomalies. The cross-correlation results also show that there are many instances in which cyclonic eddies pass the Sodwana region, resulting in a high positive correlation coefficient; however, no short-term temperature anomalies were evident. This suggests that an offshore cyclonic eddy interacting with the shelf is not the sole driving mechanism of the temperature anomalies. Investigating these alternative mechanisms in detail requires further research.
Wind driven upwelling could be an alternative potential driver of the temperature anomalies in the absence of a cyclonic eddy offshore of Sodwana. Roberts et al.12 suggests that northerly winds could induce upwelling at Sodwana resulting in the cold water temperature anomalies. It was also suggested that wind driven upwelling could occur simultaneously with cyclonic eddy temperature anomalies leading to more intense cold water events.12 Wind driven upwelling has not yet been investigated in detail and requires further research.
The results show that the temperature signal at a tidal frequency is well correlated to the tidal water levels. The temperature decreases with the incoming tide and increases with the outgoing tide. The results indicate that this temperature fluctuation is amplified over the duration of the temperature anomalies. It is possible that Sodwana experiences upwelling due to internal wave breaking on the shelf at the tidal frequency. This could drive cross-shelf transport of nutrients and cold water from deeper areas.24,25 Masunaga et al.25 suggests that the breaking of internal waves is dependent on the shelf slope and internal wave steepness. The complex shelf slope bathymetry around Sodwana may influence internal wave breaking and resultant upwelling in the Sodwana region; however, it has yet to be investigated in any detail. This driving mechanism of cold water onto the shelf is not directly linked to the presence of an offshore cyclonic eddy and may explain the temperature anomalies that occur without the presence of a cyclonic eddy.
Conclusion
We delineated hydrodynamic features associated with the occurrence of the cold water temperature anomalies around Sodwana. These temperature anomalies occur at Sodwana on average three times per year and predominantly during the summer months. The temperature anomalies can be associated with a negative SSH anomaly pattern and cyclonic eddy just offshore of the Sodwana region. The negative SSH anomaly and cyclonic eddy migrates southward past Sodwana at a rate of approximately 15 km per day and begins to dissipate after the peak of the temperature anomaly. It was also found that 33% of the temperature anomalies were observed without the presence of a cyclonic eddy offshore of Sodwana. This suggests that the presence of a cyclonic eddy offshore of Sodwana is not the sole driving mechanism of the temperature anomalies.
The regional hydrodynamic patterns associated with negative SSH anomalies and cyclonic eddies present possible driving mechanisms of cold water temperature fluctuations. However, we did not investigate the physics of each driving mechanism and the extent to which they drive the cold water temperature anomalies at Sodwana. Future research can use the results of this study to explore potential alternative drivers of temperature anomalies, for example, wind driven upwelling or upwelling due to internal waves breaking on the shelf at the tidal frequency.
It is recommended that additional in-situ data collection is required to improve future research on the driving mechanisms of the cold water temperature anomalies. The recommended in-situ data should include long-term current velocity and temperature measurements around the Sodwana reef system and submarine canyons. It is also recommended that numerical modelling of the flows around Sodwana shelf and reef is required to fully explain the driving mechanisms of the cold water temperature anomalies.
Acknowledgements
We thank the Oceanographic Research Institute and SAAMBR for access to the Nine Mile Reef temperature data. C.W. thanks the eThekwini Chair in Civil Engineering at UKZN for funding the research and PhD scholarship. D.S. is grateful to the eThekwini Municipality for sponsoring a Chair in Civil Engineering at UKZN. J.P is supported by the South African National Research Foundation (UID: 127361).
Competing interests
We have no competing interests to declare.
Authors' contributions
C.W.: Conceptualisation, methodology, data collection and analysis, data interpretation, data curation, writing - initial draft, writing -revisions. J.P.: Conceptualisation, methodology, data interpretation, internal writing review, student supervision, project management. D.S.: Conceptualisation, methodology, data interpretation, internal writing review, student supervision, project leadership, project management, funding acquisition.
References
1. Souter DW, Linden O. The health and future of coral reef systems. Ocean Coast Manag. 2000;43(8):657-688. https://doi.org/10.1016/S0964-5691(00)00053-3 [ Links ]
2. Veron JEN. Corals of Australia and the Indo-Pacific. North Ryde, NSW: Angus & Robertson; 1986. https://doi.org/10.5860/choice.31-2102 [ Links ]
3. Glynn PW. Coral reef bleaching: Ecological perspectives. Coral Reefs. 1993;12(1):1-17. https://doi.org/10.1007/bf00303779 [ Links ]
4. Hughes T, Kerry J, Alvarez-Noriega M, Álvarez-Romero J, Anderson K, Baird A, et al. Global warming and recurrent mass bleaching of corals. Nature. 2017;543:373-377. https://doi.org/10.1038/nature21707 [ Links ]
5. Brown BE. Coral bleaching: Causes and consequences. Coral Reefs. 1997;16(1):129-138. https://doi.org/10.1007/s003380050249 [ Links ]
6. Dunn SR, Thomason JC, Le Tissier MDA, Bythell JC. Heat stress induces different forms of cell death in sea anemones and their endosymbiotic algae depending on temperature and duration. Cell Death Differ. 2004;11(11):1213-1222. https://doi.org/10.1038/sj.cdd.4401484 [ Links ]
7. Glynn P. Coral reef bleaching: Facts, hypotheses and implications. Glob Change Biol. 2006;2:495-509. https://doi.org/10.1111/j.1365-2486.1996.tb00063.x [ Links ]
8. Wilkinson C. Status of coral reefs of the world: 2000. Glob Coral Reef Monit. 2001:18. [ Links ]
9. Lough J. 1997-98: Unprecedented thermal stress to coral reefs? Geophys Res Lett. 2000;27(23):3901-3904. https://doi.org/10.1029/2000GL011715 [ Links ]
10. Buddemeier R. Is it time to give up? Bull Mar Sci. 2001;69:317-326. [ Links ]
11. Riegl B, Piller WE. Possible refugia for reefs in times of environmental stress. Int J Earth Sci. 2003;92(4):520-531. https://doi.org/10.1007/s00531-003-0328-9 [ Links ]
12. Roberts M, Ternon J-F, Morris T. Interaction of dipole eddies with the western continental slope of the Mozambique Channel. Deep Sea Res Part II Top Stud Oceanogr. 2014;100:54-67. https://doi.org/10.1016/j.dsr2.2013.10.016 [ Links ]
13. Celliers L, Schleyer M. Coral bleaching on high-latitude marginal reefs at Sodwana Bay, South Africa. Mar Pollut Bull. 2002;44:1380-1387. https://doi.org/10.1016/S0025-326X(02)00302-8 [ Links ]
14. Safaie A, Silbiger N, Mcclanahan T, Pawlak G, Barshis D, Hench J, et al. High frequency temperature variability reduces the risk of coral bleaching. Nat Commun. 2018;9, Art. #1671. https://doi.org/10.1038/s41467-018-04074-2 [ Links ]
15. Roberts M, Ribbink AJ, Morris T, Berg MA, Engelbrecht DC, Harding RT. Oceanographic environment of the Sodwana Bay coelacanths (Latimeria chalumnae), South Africa. S Afr J Sci. 2006;102(9):435-443. [ Links ]
16. Morris T, Lamont T, Roberts M. Effects of deep-sea eddies on the northern KwaZulu-Natal shelf, South Africa. Afr J Mar Sci. 2013;35:343-350. https://doi.org/10.2989/1814232X.2013.827991 [ Links ]
17. Gruber N, Lachkar Z, Frenzel H, Marchesiello P Münnich M, Mcwilliams J, et al. Eddy-induced reduction of biological production in eastern boundary upwelling systems. Nat Geosci. 2011;4:787-792. https://doi.org/10.1038/ngeo1273 [ Links ]
18. Ramsay P. Marine geology of the Sodwana Bay shelf, southeast Africa. Mar Geol. 1994;120:225-247. https://doi.org/10.1016/0025-3227(94)90060-4 [ Links ]
19. Schleyer M, Celliers L. Biodiversity on the marginal coral reefs of South Africa: What does the future hold? Zool Verh. 2003;345:387-400. [ Links ]
20. Faghmous JH, Frenger I, Yao Y Warmka R, Lindell A, Kumar V. A daily global mesoscale ocean eddy dataset from satellite altimetry. Sci Data. 2015;2(1):150028. https://doi.org/10.1038/sdata.2015.28 [ Links ]
21. Schlax M, Chelton D. The "growing method" of eddy identification and tracking in two and three dimensions. Corvallis, OR: College of Earth, Ocean and Atmospheric Sciences, Oregon State University; 2016. [ Links ]
22. Williams S, Petersen M, Bremer P-T, Hecht M, Pascucci V Ahrens J, et al. Adaptive extraction and quantification of geophysical vortices. IEEE Trans Vis Comput Graph. 2011;17:2088-2095. https://doi.org/10.1109/TVCG.2011.162 [ Links ]
23. Popiñski W. Insight into the Fourier transform band pass filtering technique. Artif Satell. 2008;43:129-141. https://doi.org/10.2478/v10018-009-0012-9 [ Links ]
24. Leichter J, Stewart H, Miller S. Episodic nutrient transport to Florida coral reefs. Limnol Oceanogr. 2003;48:1394-1407. https://doi.org/10.4319/lo.2003.48.4.1394 [ Links ]
25. Masunaga E, Fringer O, Yamazaki H, Amakasu K. Strong turbulent mixing induced by internal bores interacting with internal tide-driven vertically sheared flow. Geophys Res Lett. 2016;43(5):2094-2101. https://doi.org/10.1002/2016GL067812 [ Links ]
26. Adrian R. On the role of conditional averages in turbulence theory. In: Turbulence in liquids: Volume 1. Princeton, NJ: Princeton Science Press; 1977. p. 323-332. [ Links ]
27. Stretch D. Automated pattern eduction from turbulent flow diagnostics. Center for Turbulence Research, Stanford University: Annual Research Briefs. 1990:145-157. [ Links ]
28. Press W, Teukolsky P. Kolmogorov-Smirnov test for two-dimensional data. Comput Phys. 1988;2(4):74. https://doi.org/10.1063/L4822753 [ Links ]
29. Duda R, Hart P Pattern classification and scene analysis. Libr Q. 1974;44(3):258-259. https://doi.org/10.1086/620282 [ Links ]
30. Quartly G, Srokosz M. Eddies in the southern Mozambique Channel. Deep Sea Res Part II Top Stud Oceanogr. 2004;51:69-83. https://doi.org/10.1016/j.dsr2.2003.03.001 [ Links ]
31. Halo I, Penven IP Backeberg B, Ansorge I, Shillington F, Roman R. Mesoscale eddy variability in the southern extension of the East Madagascar Current: Seasonal cycle, energy conversion terms, and eddy mean properties. J Geophys Res Ocean. 2014;119(10):7324-7356. https://doi.org/10.1002/2014JC009820 [ Links ]
 Correspondence:
Justin Pringle
Email: pringlej@ukzn.ac.za
Received: 11 Dec. 2020
Revised: 07 Apr. 2021
Accepted: 22 Apr. 2021
Published: 29 Sep. 2021
Editors: Yali Woyessa Jennifer Fitchett
Funding: eThekwini Chair in Civil Engineering (UKZN and eThekwini Municipality), South African National Research Foundation (UID: 127361)

