


Serviços Personalizados
Artigo
 Inglês (pdf)
 Artigo em XML
 Referências do artigo
Indicadores

Links relacionados
-
 Citado por Google
 -
 Similares em Google
Compartilhar

 Permalink
South African Journal of Science
versão On-line ISSN 1996-7489
versão impressa ISSN 0038-2353
S. Afr. j. sci. vol.117 no.9-10 Pretoria Set./Out. 2021
http://dx.doi.org/10.17159/sajs.2021/10726
SCIENTIFIC CORRESPONDENCE
Analysis of citation inequality in Finland and Nigeria using the Lorenz curve
Remare Ettarh
Health Systems Evaluation and Evidence, Alberta Health Services, Edmonton, Canada
Keywords: Citation Inequality, Lorenz Curve, Gini Index, Finland, Nigeria
Scientometric assessments have become an essential component of research evaluation, and central to these is the use of citation indicators. Citations are used in the performance measurement of research departments and institutions1, assessment of research funding applications2, and promotion and hiring of research scientists3. Although there have been strong arguments for and against the use of citations for these purposes due to concerns about their reliability and validity as performance indicators, most research institutions across the world continue to make decisions partly based on citation data.4 Citation counts are still widely used to judge scientific impact and quality, but the significant field-related and temporal variations that exist within the data make comparisons based on absolute counts inappropriate unless done with normalisation.4
In the last couple of decades, advances in computational technology have enabled data mining involving citations of millions of scientific papers, resulting in improved understanding of the global citation patterns within and across fields and countries. One emerging pattern of concern is citation inequality, which suggests underlying disparities in research funding, collaboration and the peer-review publication process globally.5 Non-academic factors such as economic strength, geopolitics, or linguistic and cultural differences, contribute to a global divide in scientific productivity and reward: the wealthier countries which have the top journals and determine which articles get published in them, and the less developed countries with fewer journals and where authors face barriers disseminating their research in the top journals.6,7 This divide reflects the publishing and citation biases that influence citation inequality within and between countries, regions, and continents. Citation inequality is now evident with respect to individual researchers. A recent study showed that the top 1% most-cited authors accounted for about 20% of citations between 2000 and 2015.8 It is unclear how patterns of citation inequality differ between specific developed countries and those in Africa. How the distribution of citation shares for individual articles differs between countries is examined here using inequality curves.
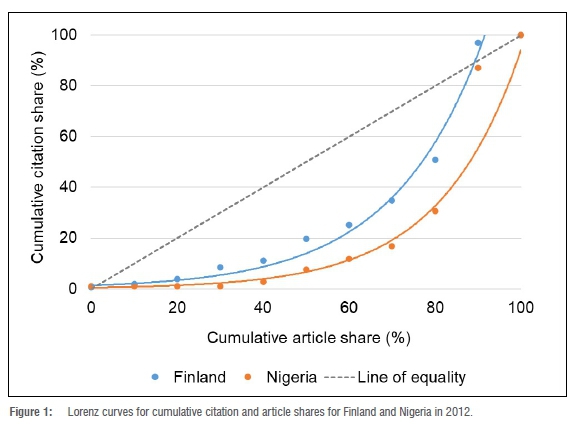
Citation data were extracted from Web of Science for all peer-reviewed articles published in all disciplines in 2012 and that had author affiliations in Finland or Nigeria. Lorenz curves were plotted using the cumulative citation shares for all articles from each country. The Gini index, which represents the extent of inequality of article contribution to the citation share based on the Lorenz curve, was calculated for each country. The choice of the countries was partly random, but with a consideration that they were not the top ranked countries on their continents in relation to publications and citations.
The analysis included 11 315 articles from Finland and 2728 articles from Nigeria published between 1 January to 31 December 2012. The choice of year was guided by the greater stability of citations of the articles given the time that has elapsed since then. Finland had a total of 141 627 citations, and Nigeria had a total of 12 600 citations, for the included publications at date of extraction. The Lorenz curves for both countries are shown in Figure 1. The curve for Nigeria shows greater citation inequality (Gini index = 0.59) compared to that for Finland (Gini index = 0.39).
There are some possible explanations for the difference in the extent of citation inequality between the two countries. Firstly, Nigerian researchers involved in international collaborations and listed as authors of the resulting highly cited papers, such as those from the Global Burden of Disease Study 20109, accounted for a large proportion of the citations from the country10. Secondly, a significant number of papers was produced from universities in Nigeria but had very few or no citations. This could be attributed in part to the 'Matthew effect', where renowned researchers receive disproportionately greater citations than their lesser-known colleagues for comparable publications5, in view of the low global visibility of Nigeria-based researchers. This is consistent with a previous observation that Nigerian research communities are largely isolated from partners in other countries inside and outside Africa.11 Interestingly, international research collaborations have been increasing over the past century across various disciplines.12 In addition, the results reflect a more equitable spread of the bibliometric impact of research articles from Finland.
The significance of this analysis is in the demonstration of the use of the Lorenz curve and Gini index to compare citation inequality between countries, and the possibilities it creates to examine these patterns across other African countries and periods of time. This approach reveals the extent of the influence of highly cited papers on the citation inequality observed in each country, and the weight of scientific knowledge that is largely ignored or unused as seen in the long tail of the curve. This type of analysis could provide the relevant government departments in these countries with a snapshot of the performance of the domestic research community, and help in assessing the impact of strategies to improve international collaboration and enhance the use of the knowledge produced by in-country researchers.
References
1. Aroeira RI, Castanho MARB. Can citation metrics predict the true impact of scientific papers? FEBS J. 2020;287(12):2440-2448. https://doi.org/10.1111/febs.15255 [ Links ]
2. Yan E, Wu C, Song M. The funding factor: A cross-disciplinary examination of the association between research funding and citation impact. Scientometrics. 2018;115:369-384. https://doi.org/10.1007/s11192-017-2583-8 [ Links ]
3. Moher D, Naudet F, Cristea IA, Miedema F, loannidis JPA, Goodman SN. Assessing scientists for hiring, promotion, and tenure. PLoS Biol. 2018;16(3), e2004089. https://doi.org/10.1371/journal.pbio.2004089 [ Links ]
4. Aksnes DW, Langfeldt L, Wouters P. Citations, citation indicators, and research quality: An overview of basic concepts and theories. SAGE Open. 2019;9(1):1-17. https://doi.org/10.1177/2158244019829575 [ Links ]
5. Xie Y "Undemocracy": Inequalities in science. Science. 2014;344(6186):809-810. https://doi.org/10.1126/science.1252743 [ Links ]
6. Demeter M. The winner takes it all: International inequality in communication and media studies today. J Mass Commun Q. 2019;96(1):37-59. https://doi.org/10.1177/1077699018792270 [ Links ]
7. Zanotto SR, Haeffner C, Guimaraes JA. Unbalanced international collaboration affects adversely the usefulness of countries' scientific output as well as their technological and social impact. Scientometrics. 2016;109:1789-1814. https://doi.org/10.1007/s11192-016-2126-8 [ Links ]
8. Nielsen MW, Andersen JP. Global citation inequality is on the rise. Proc Natl Acad Sci USA. 2021;118, e2012208118. https://doi.org/10.1073/pnas.2012208118 [ Links ]
9. Lim SS, Vos T, Flaxman AD, Danaei G, Shibuya K, Adair-Rohani H, et al. A comparative risk assessment of burden of disease and injury attributable to 67 risk factors and risk factor clusters in 21 regions, 1990-2010: A systematic analysis for the Global Burden of Disease Study 2010. Lancet. 2012;380(9859):2224-2260. https://doi.org/10.1016/S0140-6736(12)61766-8 [ Links ]
10. Hsiehchen D, Espinoza M, Hsieh A. Multinational teams and diseconomies of scale in collaborative research. Sci Adv. 2015;1(8), e1500211. https://doi.org/10.1126/sciadv.1500211 [ Links ]
11. Ettarh R. Patterns of international collaboration in cardiovascular research in sub-Saharan Africa. Cardiovasc J Afr. 2016;27(3):194-200. https://doi.org/10.5830/CVJA-2015-082 [ Links ]
12. Larivière V Gingras Y Sugimoto CR, Tsou A. Team size matters: Collaboration and scientific impact since 1900. J Assoc Inf Sci Technol. 2015;66:1323-1332. https://doi.org/10.1002/asi.23266 [ Links ]
 Correspondence:
Remare Ettarh
Email: Remare.ettarh@albertahealthservices.ca
Published: 29 September 2021

