


Services on Demand
Article
 English (pdf)
 Article in xml format
 Article references
Indicators

Related links
-
 Cited by Google
 -
 Similars in Google
Share

 Permalink
South African Journal of Science
On-line version ISSN 1996-7489
Print version ISSN 0038-2353
S. Afr. j. sci. vol.117 n.7-8 Pretoria Jul./Aug. 2021
http://dx.doi.org/10.17159/sajs.2021/7900
RESEARCH ARTICLE
Diverse trends in observed pan evaporation in South Africa suggest multiple interacting drivers
R. Arthur ChapmanI; Guy F. MidgleyI; Kathleen SmartII
IGlobal Change Biology, Department of Botany and Zoology, Stellenbosch University, Stellenbosch, South Africa
IIInstitute for Water Research, and Rhodes Restoration Research Group, Rhodes University, Makhanda, South Africa
ABSTRACT
Planning for future water resource management in a warming climate is confounded when an expectation of increasing evaporation from open water surfaces with global warming is contradicted by observations of secular declines of pan evaporation. Decreasing pan evaporation has been observed globally - a trend which has been attributed variously to declines in wind run ('global stilling'), declines in radiation ('global dimming') and increases in ambient humidity. This contrast between expectation and observation is known as the 'evaporation paradox'. We evaluated trends in Symons pan evaporation from 154 pans across South Africa. Whilst 59 pans (38% of the 154) showed a statistically significant decrease in observed evaporation rates (p<0.05), 30 (20%) showed an increase, and 65 (42%) showed no change. These results do not support simple attributions of trends to a common global cause. There is no spatially coherent pattern to trends across South Africa, suggesting that shifts in local drivers of evaporation confound expectations of secular trends due to global drivers. Changes in fetch conditions of the Symons pan installations may be implicated, whereby increasing tree density (through afforestation, alien plant invasion and woody thickening) increases surface friction, reducing wind run, and/or irrigation nearby, increasing local humidity. Correct attribution of the evaporation paradox to reduced wind run in South Africa must consider changing local conditions. Increased tree cover has been observed near a third of the South African Symons pans. Observed evaporation increases for one fifth of pans may implicate expected global drivers for pans where local fetch conditions have remained relatively constant.
SIGNIFICANCE:
• Observed trends in Symons pan evaporation data for stations across South Africa comprise significant decreases (38% of stations), no change (42%) and significant increases (20%), with no clear geographic bias or coherency in the distribution of these trends.
• The observed diversity in trends appears to reflect local and global drivers, with land-cover changes emerging as a likely dominant local driver via friction-induced reductions in wind-run, possibly resolving the 'evaporation paradox'.
• Observed trends in pan evaporation data may only be of value in testing for the impact of global drivers, such as global warming or global stilling, if local effects are accounted for. Caution is urged when using pan evaporation data for water resource planning.
• Attribution of observed trends requires a case-by-case assessment of local to regional land-cover and land-use changes, in addition to global influences.
Keywords: pan evaporation trends, evaporation paradox, global stilling, fetch conditions
Introduction
Routine estimation of atmospheric water demand and rates of evaporation from natural and agricultural land surfaces have been made for decades through the use of evaporating pans.1 Despite their known limitations, evaporating pans continue to be used for estimating water use by land uses that include crop, plantation, pasture, natural vegetation2,3, and open water and wetland surfaces4-6. Ease of use and simplicity in construction and maintenance favour their retention for these purposes1, and the stationarity benefits conferred by a consistent methodology are advantageous for long-term trend analysis.
Many reports based on such long-term trends demonstrate declining pan evaporation around the world.7-10 Extensive reviews of these changes are given by McVicar et al.11 and Roderick et al.12 who attribute them mainly to regional or global meteorological changes. In South Africa, Hoffman et al.13 found consistent declines in an analysis of records from 20 selected meteorological monitoring stations in the Western Cape Province of South Africa, attributing these to the same regional changes.
Such declines are unexpected in the light of rising air temperatures due to global warming, which should result in increasing evaporation via increasing air vapour pressure deficit. This violation of expectation is known as the 'evaporation paradox'.14 The decline in pan evaporation has widely been associated with 'global stilling', which is the purported global slowing of surface winds12, and 'global dimming', which is a global decline in solar radiation at the earth's surface12. Other reasons for the evaporation paradox include increased cloudiness15, or a complementary relationship between actual and potential evaporation, where increasing actual evapotranspiration from surrounding areas suppresses pan evaporation16,17, and changes in ambient humidity14.
However, questions remain about the attribution of the observed declines of pan evaporation.11 This is particularly because declines are not observed universally. Several regions have been reported to show increases in pan evaporation, including parts of conterminous USA17,18, Israel18 and Australia19.
We explore here trends in surface evaporation in South Africa, using data from Symons pan evaporation observations that span a longer monitoring period, over a larger region, and using more stations than provided in the analysis by Hoffman et al.13 The Symons pan is the standard evaporation recording instrument at all major South African reservoirs and pans were installed widely around the country, from as early as the 1920s when the first major efforts in constructing large reservoirs began. As a result of mostly continuous observations, this valuable data set provides the basis for a trend analysis undertaken for a longer term than has been done before in South Africa, with a view to assessing potential drivers over a period of accelerating anthropogenic climate change.
Three alternative explanations could be advanced to account for evaporation trends and changes. Rising temperatures due to anthropogenic climate change, already identified in South Africa20, should result in generally increasing evaporation rates in a spatially coherent pattern because of the established relationship between air temperature on evapotranspiration2. Alternatively, the impact of possible global dimming and/or global stilling would be to reduce evaporative demand in a regionally coherent pattern. However, a spatially incoherent mix of upward, downward and non-significant trends would indicate a likely role for local surface conditions controlling the planetary boundary conditions and energy partitioning, which may override or exacerbate the impacts of global drivers. In this study, we tested for the predominant trends in evaporation and their spatial coherence that are conditioned upon the prevalence of global vs local drivers of evaporation. We also tested the potential value of Symons pan data for attributing the impacts of these drivers.
Methods
Monthly Symons pan evaporation data were obtained from the open-access South African Department of Water and Sanitation's (DWS) hydrological database. The Symons pan is a square container measuring 1.83 m on each side, is 0.61 m deep and is set into the ground so that it has a rim of 0.076 m above ground level; the inside is painted black. This instrument is used commonly across southern Africa and is the standard evaporating pan used by the DWS, particularly at its large dams. The instrument has also been installed at irrigation scheme offices and at some wastewater treatment plants. Evaporation readings are collected daily and communicated to the central office of the DWS, where the data is curated on their Hydrological Information System. The records span a range of durations, with some beginning as early as the 1920s, some ending in 2018/2019, and others terminating earlier.
We selected appropriate recording stations to use in this analysis as follows. The evaporation records were initially scanned to determine the quality of the data. Generally, the station firstly needed to have 30+ years of record, assuming a period that gives sufficient time for any trends to develop in the data set. Those with a substantial quantity of missing data, or data considered unreliable (according to notes on the database), were discarded. All data are recorded with quality codes prepared by the DWS office responsible for maintaining the Hydrological Information System, ranging from good observed values through good monthly estimates to unreliable and lastly to missing data for some months. Some records are estimated, others are recorded as missing, or unaudited.
The remaining station records were then edited for continuity. Where a month of data was missing in a run of reliable records, missing values were interpolated based on the expected value for that month of the year based on adjacent values. We estimated that the error introduced into the data set in this way was no more than ±2% in each individual year.
Where several consecutive months were missing, the record was filled with a missing data flag (NA values). The data were not adjusted for homogeneity, which would possibly destroy signals of change and because cyclicity across numbers of instruments was detected in preanalyses. The monthly records were then aggregated to annual values and a linear regression model fitted to the time series, with the slope of the regression determining the trend in the data. Years with missing data were dropped from the regression by specifying a high minimum threshold value for the data set before inclusion in the calculation. This threshold value varied according to the station and was set by observation in each case, and also by inspecting the raw data to check that those annual values excluded did indeed contain missing monthly data and were not merely unusually low values. The beginning and end years of each record were also excluded if they were incomplete.
We tested for normality of the residuals of the regressions. Two methods were used in conjunction: Q-Q plots gave a visual view of the closeness of the residuals to normality and the Shapiro-Wilk test was used as a robust statistical test, with a chosen alpha value of 0.05 (p<0.05). Most of the records indicated near normality from the Q-Q plot. The Shapiro- Wilk test was more discerning and indicated a substantial number of regressions had non-normal residuals. Close inspection of the outputs revealed that the most likely reason for non-normality was the cyclic behaviour of evaporation quantities over the time series for each station. Because the cycles likely had definable external causes but did not affect the larger trends in the data, it was decided that linear regression was an appropriate and robust method for conducting the main trend analysis.
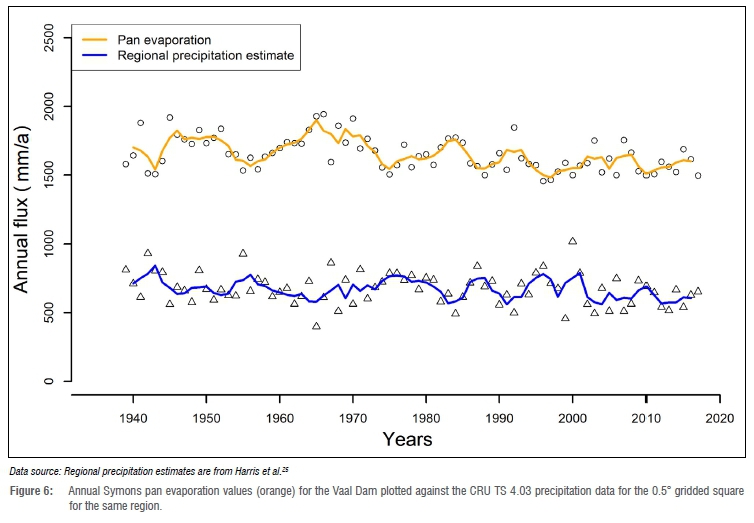
The results of the trend analysis were tested against the Standardised Precipitation Evapotranspiration Index (SPEI), which is discussed in detail by Beguería et al.21 and Vicente-Serrano et al.22 The SPEI can be considered an independent estimation of water demand by the atmosphere based on a climatic water balance which comprises both precipitation and evaporation. The conceptual justification for using the SPEI is that its variables are found to cluster according to the potential evapotranspiration radiation term and that the mass transfer term which integrates wind and humidity has little or no effect on the SPEI, according to Stagge et al.23 Further support for this idea is obtained from Hobbins et al.24 who discuss a complementary relationship between actual (Ea) and potential (Ep) evaporation, in which the amount of water in the environment is the controlling factor. As precipitation increases, the evaporative process becomes less water limited and more energy limited, and Ea and Ep converge. Indeed, supporting evidence for this approach is given in this paper, where a relationship between precipitation and pan evaporation is observed and reported as an explanation of cyclicity in pan evaporation. The precipitation values used in this comparison were obtained from the CRU TS 4.03 data25 for 0.5° geographic grid intervals, representing regionalised monthly data, which were aggregated to annual values for the 0.5° grid interval in which the Vaal Dam is located and compared against the Symons pan located there.
The modelled SPEI would reflect a potential response to mainly the radiation term, and thus provide a test for the impact of global or regional dimming. Poor agreement between the pan data and the modelled SPEI trends would therefore indicate that factors other than dimming are driving trends in pan evaporation rates.
The SPEI 0.5° gridded data layers were obtained from Open Database in netCDF and calculated from monthly CRU TS 4.03 data using R code developed by Beguería et al.26 The CRU TS variables include temperature, precipitation, diurnal temperature range and vapour. The estimates of the evapotranspiration component of the SPEI were calculated from these climatic variables using the FAO-56 Penman-Monteith equation of Allen et al.2 at a sub-regional scale (quarter degree square) based on these interpolated climate variables21.
A linear trend analysis was applied to the SPEI estimates, followed by a correlation analysis that measured the strength of association between the slopes of pan evaporation regression trends and the slopes of SPEI regression trends.
Results
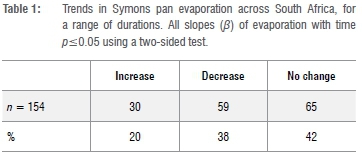
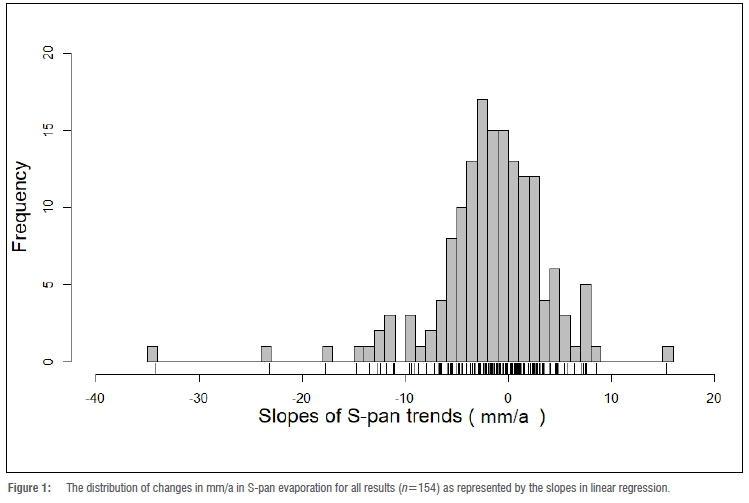
Results indicate that 20% of pans showed positive slopes ß) of evaporation with time, 42% of pans showed no change (ß = 0), and 38% showed declines, all at the p<0.05 significance level with a two-sided test (Table 1).
Thus, a minority of stations showed increasing observed pan trends, with the balance split about equally between no changes and decreasing trends. The statistical distribution of the trends (slope term of the regression) is illustrated in the histogram in Figure 1, representing the changes in mm/annum. The steepest negative trends for three stations showed a slope or reduction in evaporation of -34 mm/a (Q3E001 at Halesvlakte/Halesowen, an agricultural training school near Craddock), -23 mm/a for B7E004 at Phalaborwa and -17 mm/a for H2E002 at RoodeElsberg Dam near the Hex River valley in the Western Cape mountains. In the instances of increases in pan evaporation, the largest are 15 mm/a for G2E015 at Simon's Town, 8 mm/a for C1E007 at Groootdraai Dam and 8 mm/a for A2E003 at Hatfield, the agricultural research unit of the University of Pretoria, in Pretoria.
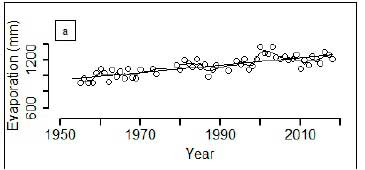
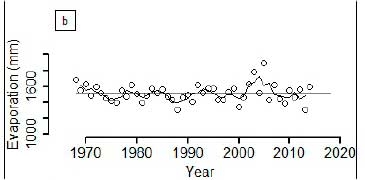
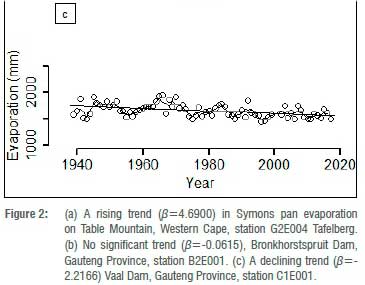
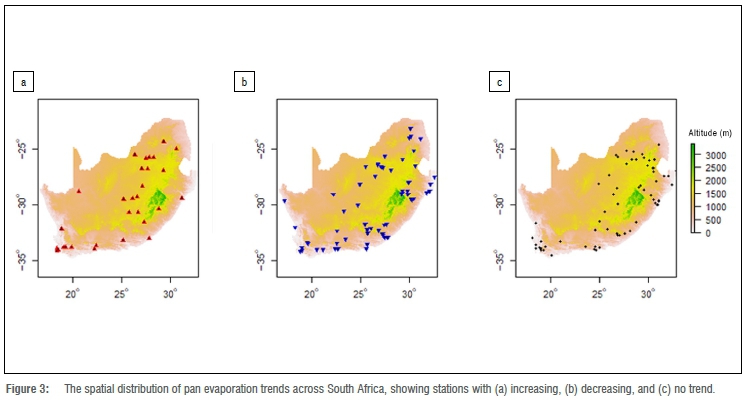
The diversity of trend responses is shown in Figure 2a, 2b and 2c, which respectively illustrate examples of Symons pan trends of rising, no change and declining evaporation, at different locations around South Africa, at the p<0.05 significance level. Finally, plotting trend directions spatially to test visually for coherence (Figure 3) showed that each trend category was about equally and randomly distributed across South Africa. These apparently random patterns imply that there are no regional or sub-regional controls on pan evaporation trends.
Statistics of correlation
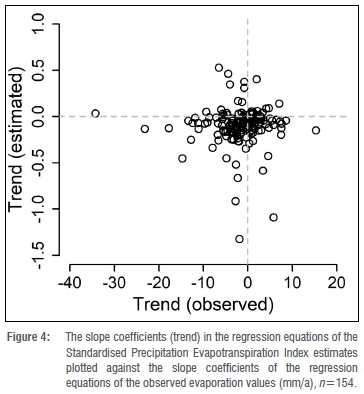
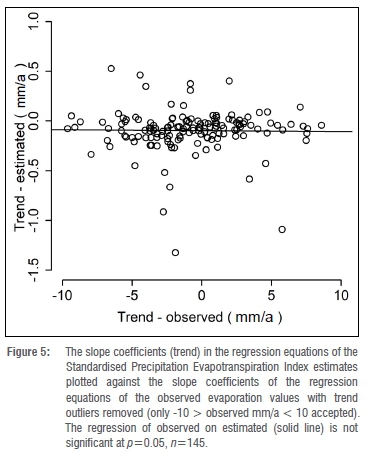
A Pearson correlation coefficient was calculated as a measure of the strength of association between all observed Symons pan evaporation and the P-M estimates of evaporation used in the SPEl, as described in the Methods above. This gives an rxyof -0.00517, indicating no appreciable correlation between the two data sets (Figure 4). Focusing on a narrower data set, by removing potential outliers (accepting only -10>trend<10), confirms that a linear regression of the estimated values on observed values is also not significant at p=0.05, indicating that the observed values are not a response to regional climatic factors, in that neighbouring pans can show different trends and there are no spatially uniform effects such as decreasing wind speeds or increasing humidity at the larger scales (see Figure 3), or at most that such regional influences are obscured by stronger influences of local conditions (Figure 5).
A Pearson chi-square test of independence of categorical variables was performed to determine whether the observed pan trends are linked to the P-M estimates of regional drivers of evapotranspiration. There are three categories for trends in both observed and estimated data based on the significance determinations of the regression analyses for each station (p=0.05): (1) increase, (2) no change and (3) decrease. A cross-tabulation of these categorical variables is given in Table 2.
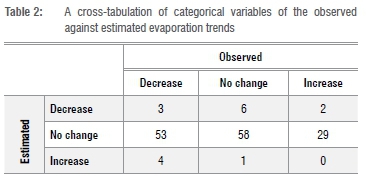
Our null hypothesis H0 is that the trends are independent and the alternative hypothesis H1 is that the trends are related. The Pearson chi-square then gives X2 = 4.3769, df = 4 and p-value = 0.3221. With the p>0.05 significance level, H1 is rejected, further supporting the conclusion that the observed and estimated values of evaporation trends are not related, and likely driven by a variety of local drivers, that possibly interact with weaker global drivers.
Pan evaporation values show some cyclicity for many of the instrument records (see Figure 2a,b,c, for example). There is a moderate inverse relationship of pan evaporation with annual rainfall (Figure 6).
Discussion
The wide range of trends derived from the observed data do not accord with the hypothesis of a single dominant factor, such as global stilling or global dimming (or other large-scale influences) as the sole driver of evaporation. Our assessment is that trends in pan evaporation reflect the net result of multiple drivers which are a likely combination of local and regional to global phenomena.
We conclude from the results of the tests of correlation (Pearson coefficient, chi-square) that the observed longer-term trends of pan evaporation are unrelated to the regional atmospheric drivers of evaporation, assuming the P-M trend estimates are largely correct. At sub-decadal time scales, pan evaporation does correspond somewhat to annual variations in precipitation (Figure 6). During relatively wet years, pan evaporation declines and during relatively dry years, pan evaporation increases. This is likely a result of increased cloudiness and water in the environment supressing evaporation during the wet years. During the dry years, more energy is available in the environment and pan evaporation increases. This relationship supports the use of the SPEI as an independent test of the regional drivers of pan evaporation, and supports the hypothesis of a complementary relationship between Ea and Ep.24
Changes in local near-field conditions (fetch) that affect wind runs and humidity have a greater impact on advected energy that controls pan evaporation, while the two dominant global drivers of change (increasing temperature and decreasing wind speeds, if true), would tend to be counterbalancing. Global dimming is not accepted as cause for declining trends in evaporation because the observed direction of changes in surface solar radiation has generally been one of dimming in the 1950s to 1980s, brightening from the 1980s to 2000 with India still dimming, and after 2000, largely brightening but dimming in China/Mongolia and India.27 The causes of these secular trends are the initial dimming with increased global production of aerosols, including sulfates, that came with industrialisation in the earlier parts of the 20th century, and then brightening as industrial processes reduced aerosol emissions.27 We also do not accept local dimming because there is no evidence to suggest there are highly localised dimming causes.
The trends in the observed data in our results compare well to the range of trends found by others. Rayner19 observed trends of -19 to 29 mm/a at different sites in Australia and related these to changes in wind run.
The causes of change in wind run could not be determined, but Rayner19 noted that afforestation processes near Mt Gambier in South Australia could be a cause for wind run declines there. McVicar et al.11, in their global assessment, reported a range of evaporation trends from -25.27 mm/a to 16.08 mm/a from a comprehensive list of studies and gave a number of possible reasons for declines in wind run, including the increase in surface roughness caused by increasing vegetation cover at local scales.
We propose that changes in fetch over the duration of observations are most likely drivers of change in pan evaporation rates and responsible for differences between the regional estimates and local pan evaporation. An inspection of selected evaporation monitoring sites showing the greatest decreasing and increasing trends, using Google Earth, supports this conjecture. For sites which could be visually located in the images, those showing steep or even moderate declines (see Figure 1) are usually associated with irrigation farming practices, have trees that have been planted as windbreaks or have grown unmanaged in the vicinity along fence lines and road edges, or have irrigated grass nearby (lawns surrounding buildings near where the instrument is positioned), or are located adjacent to unpaved roads (usually within 20-30 m) which possibly allows dust formation that coats the water surface of the nearby instrument. Those sites showing the strongest negative trends usually have a combination of these local environments, usually within 20-30 m of the instrument. This distance is much closer than the minimum fetch requirement of >150 m of short ground cover specified by Allen et al.2 The static fetch requirements for using evaporating pans are not set, but various authors imply the need for minimum fetch distances from 100 m to 1000 m.2,28,29 A changing surface within those ranges implies impacts on pan evaporation rates.
For those sites showing the strongest increases, the causes may be related to an increasing heat island effect, or are unknown at this stage. A full analysis of local land-cover changes at all stations is beyond the scope of this study and could be unfeasible for all stations. Further interrogation of this aspect using a more sophisticated approach for simulating trends in response to both local and global changes would be of great value for correct attribution of the diverse trends observed.
Global stilling as a phenomenon is not well supported by South African wind data. Kruger et al.30 present data showing increases in gust strength at four sites in South Africa. Wright and Grab31, analysing 20 years of wind data, note that of observed wind speed trends in the Western Cape with statistical significance (out of 14 recording sites), three showed declines and one an increase. These authors also note that 20 years is insufficient to establish conclusively the pattern of change in wind speeds. Jung et al.32, in an analysis of global and national wind energy potential, specifically note South Africa as having a statistically significant increasing wind energy generation potential, implying that, at national scales, wind speeds are increasing.
The observation of declining wind speeds over terrestrial surfaces at specific locations13 (local stilling) is difficult to reconcile with observed increasing trends in wind speeds over the ocean. Young et al.33 and Young and Ribal34 show increasing velocities over the Southern Ocean - trends which at least have effects on wind speeds along and near the coastal regions of South Africa. One explanation for locally declining wind speeds is the increasing density of trees in South African landscapes.35-37 Woody encroachment - the spread of invasive alien trees across biomes and planted trees - likely causes lower surface wind speeds and is very likely a cause of changes in fetch conditions, possibly also accounting for attributions of global stilling for the evaporation declines postulated by others.
At more localised scales, we note that while all data sets used in the study by Hoffman et al.13 showed declining pan evaporation in the fynbos region of the Western Cape, this study shows eight pans in the same region with statistically significant increases in evaporation over various time durations. Local influences on monitoring sites may be responsible for this discrepancy, and we urge care in over-interpreting observed trends without such consideration.
We concur with McVicar et al.11 that the problem of apparent declining evaporation rates has important implications for hydrological evaluations in those regions which are energy limited, but not those which are water limited. We point out that southern Africa, and especially the southwestern region of South Africa, are strongly water limited with respect to controls of water availability to meet evaporative demand (Figure 6).
Additional factors should also be considered. Within the terrestrial mid-latitudes in particular, the suppression of cloud formation (therefore leading to brightening) has been attributed to changes in land-atmosphere coupling triggered by atmospheric carbon dioxide (CO2) enrichment.38 Higher CO2 concentrations reduce stomatal conductance, increasing energy partitioning into sensible heat and favouring higher free water evaporation, which is limited in availability.
Through our use of the Symons pan data, we have observed that the DWS evaporation database shows a marked decline in data quality, mostly from around the years 2004-2005 when substantial quantities of data are simply missing, or dispersion in the data increases, implying a loss of accuracy, which appears to occur from about 2000 onwards. In a number of cases, much of the evaporation record is unusable and had to be discarded from this analysis.
Conclusions
Our findings suggest there is no spatially or directionally coherent signal of declining pan evaporation over South Africa, as previous investigators have suggested based on smaller data sets.13 There is sufficient evidence, as presented here, that pan evaporation not only has no statistically discernible trends in the majority of cases, but increases at some sites, including in the Western Cape Province where Hoffman et al.13 showed decreases. We concur with authors who argue that changes in local conditions affect pan evaporation, and we reject the hypothesis that evaporation trends can be directly attributed to global influences alone.
Our analysis suggests that any signals from global drivers are overwhelmed by changes in local conditions. Changes in the fetch conditions around the evaporating pans, which include, by observation, increases in the number of trees and buildings which create resistance to air flows, irrigation practices leading to more humid air, and possibly dust from nearby unpaved roads, are likely responsible for most of the observed decreases in evaporation. Authors of global studies in which decreases in wind speed are observed, need to carefully consider changes over time in the fetch conditions upwind of the observing instrument. Increases in pan evaporation are likely to be attributable to increased wind runs at some sites - these changes could be caused by changing global circulation patterns or even the removal of objects which could have previously reduced the wind speeds near instruments. Thus, we conclude that the evaporation paradox is explained by a changing local environment that alters the wind run around evaporating pans.
Future research could usefully undertake further studies into the changing nature of the landscape with particular regard to fetch conditions around meteorological instruments. It would be useful to understand how conditions have changed around all of the pans, not only those which have showed decreasing trends in evaporation but also those which show increases. The evaporating pan remains an instrument of choice for its simplicity of operation; however, the findings here indicate the need for abundant caution when pan data are used for determining water budgets of reservoirs as well as water resource studies. Pan evaporation records in a large proportion of those examined prove not to be stationary. We conclude that attribution of observed trends likely requires case-by-case assessment of local to regional land-cover and land-use changes in addition to global influences. We also point to the obvious declines in data quality increasingly present in the evaporation component of the DWS's Hydrological Information System and suggest that attention urgently be given to rectify the situation to preserve the value of these long-term records.
Competing interests
We have no competing interests to declare.
Authors' contributions
R.A.C. described the fundamental problem, conceptualised part of the approach, collected the evaporation data, wrote the codes, performed the data analysis, and wrote substantial parts of the draft. G.F.M. conceptualised some of the methodological approaches, and undertook some of the writing, particularly the revisions of the draft. K.S. extracted the data for the independent test and undertook this, prepared the maps and contributed text to the draft.
References
1. Stanhill G. Is the Class A evaporation pan still the most practical and accurate meteorological method for determining irrigation water requirements? Agric For Meteorol. 2002;112:233-236. https://doi.org/10.1016/S0168-1923(02)00132-6 [ Links ]
2. Allen R, Pereira L, Raes D, Smith M. Crop evapotranspiration - Guidelines for computing crop water requirements. FAO Irrigation and Drainage Paper 56. Rome: United Nations Food and Agricultural Organization; 1998. [ Links ]
3. Warburton ML, Schulze RE, Jewitt GPW. Confirmation of ACRU model results for applications in land use and climate change studies. Hydrol Earth Syst Sci. 2010;14:2399-2414. https://doi.org/10.5194/hess-14-2399-2010 [ Links ]
4. Althoff D, Rodrigues LN, Da Silva DD, Bazame HC. Improving methods for estimating small reservoir evaporation in the Brazilian Savanna. Agric Water Manag. 2019;216:105-112. https://doi.org/10.1016/j.agwat.2019.01.028 [ Links ]
5. Kohler M. Lake and pan evaporation. In: Water-loss investigations: Lake Hefner studies. Technical report. Menlo Park, CA: United States Geological Survey; 1954. p. 127-148. [ Links ]
6. Masoner JR, Stannard DI. A comparison of methods for estimating open-water evaporation in small wetlands. Wetlands 2010;30:513-524. https://doi.org/10.1007/s13157-010-0041-y [ Links ]
7. Chattopadhyay N, Hulme M. Evaporation and potential evapotranspiration in India under conditions of recent and future climate change. Phys Biophys Process Veg Environ. 1997;87:55-73. https://doi.org/10.1016/S0168-1923(97)00006-3 [ Links ]
8. Golubev VS, Lawrimore JH, Groisman PYa, Speranskaya NA, Zhuravin SA, Menne MJ, et al. Evaporation changes over the contiguous United States and the former USSR: A reassessment. Geophys Res Lett. 2001;28:2665-2668. https://doi.org/10.1029/2000GL012851 [ Links ]
9. Peterson TC, Golubev VS, Groisman PYa. Evaporation losing its strength. Nature. 1995;377:687-688. https://doi.org/10.1038/377687b0 [ Links ]
10. Roderick ML, Farquhar GD. Changes in Australian pan evaporation from 1970 to 2002. Int J Climatol. 2004;24:1077-1090. https://doi.org/10.1002/joc.1061 [ Links ]
11. McVicar TR, Roderick ML, Donohue RJ, Li LT, Van Niel TG, Thomas A, et al. Global review and synthesis of trends in observed terrestrial near-surface wind speeds: Implications for evaporation. J Hydrol. 2012;416-417:182-205. https://doi.org/10.1016/j.jhydrol.2011.10.024 [ Links ]
12. Roderick ML, Rotstayn LD, Farquhar GD, Hobbins MT. On the attribution of changing pan evaporation. Geophys Res Lett. 2007;34, L17403. https://doi.org/10.1029/2007GL031166 [ Links ]
13. Hoffman MT, Cramer MD, Gillson L, Wallace M. Pan evaporation and wind run decline in the Cape Floristic Region of South Africa (1974-2005): Implications for vegetation responses to climate change. Clim Change. 2011;109:437-452. https://doi.org/10.1007/s10584-011-0030-z [ Links ]
14. Brutsaert W, Parlange MB. Hydrologic cycle explains the evaporation paradox. Nature. 1998;396:30. [ Links ]
15. Roderick ML, Farquhar GD. The cause of decreased pan evaporation over the past 50 years. Science. 2002;298:1410-1411. https://doi.org/10.1126/science.1075390 [ Links ]
16. Brutsaert W. Indications of increasing land surface evaporation during the second half of the 20th century. Geophys Res Lett. 2006;33:L20403. https://doi.org/10.1029/2006GL027532 [ Links ]
17. Lawrimore JH, Peterson TC. Pan evaporation trends in dry and humid regions of the United States. J Hydrometeorol. 2000;1:543-546. https://doi.org/10.1175/1525-7541(2000)001<0543:PETIDA>2.0.CO;2 [ Links ]
18. Abtew W, Obeysekera J, Iricanin N. Pan evaporation and potential evapotranspiration trends in South Florida. Hydrol Process. 2011;25:958-969. https://doi.org/10.1002/hyp.7887 [ Links ]
19. Rayner DP. Wind run changes: The dominant factor affecting pan evaporation trends in Australia. J Clim. 2007;20:3379-3394. https://doi.org/10.1175/JCLI4181.1 [ Links ]
20. MacKellar N, New M, Jack C. Observed and modelled trends in rainfall and temperature for South Africa: 1960-2010. S Afr J Sci. 2014;110, Art. #2013-0353. https://doi.org/10.1590/sajs.2014/20130353 [ Links ]
21. Beguería S, Vicente-Serrano SM, Reig F, Latorre B. Standardized precipitation evapotranspiration index (SpEI) revisited: Parameter fitting, evapotranspiration models, tools, datasets and drought monitoring. Int J Climatol. 2014;34:3001-3023. https://doi.org/10.1002/joc.3887 [ Links ]
22. Vicente-Serrano SM, Beguería S, López-Moreno JI. A multiscalar drought index sensitive to global warming: The Standardized Precipitation Evapotranspiration Index. J Clim. 2010;23:1696-1718. https://doi.org/10.1175/2009JCLI2909.1 [ Links ]
23. Stagge J, Tallaksen L, Xu C, Lanen VHAJ. Standardized Precipitation-Evapotranspiration Index (SPEI): Sensitivity to potential evapotranspiration model and parameters. In: Hydrology in a changing world: Environmental and human dimensions. Proceedings of the 7th World Flow Regimes from International and Experimental Network Data Water Conference (FRIEND-Water 2014); 2014 October 7-10; Montpellier, France. Göttingen: Copernicus GmbH; 2014. p. 367-373. [ Links ]
24. Hobbins MT, Ramírez JA, Brown TC. Trends in pan evaporation and actual evapotranspiration across the conterminous U.S.: Paradoxical or complementary? Geophys Res Lett. 2004;31, L13503. https://doi.org/10.1029/2004GL019846 [ Links ]
25. Harris I, Osborn TJ, Jones P Lister D. Version 4 of the CRU TS monthly high-resolution gridded multivariate climate dataset. Sci Data. 2020;7, Art. #109. https://doi.org/10.1038/s41597-020-0453-3 [ Links ]
26. Beguería S, Vicente-Serrano SM. SPEI: A set of functions for computing potential evapotranspiration and several widely used drought indices including the Standardized Precipitation-Evapotranspiration Index (SPEI) [webpage on the Internet]. c2017 [cited 2021 Feb 01]. Available from: https://cran.r-project.org/web/packages/SPEI/index.html [ Links ]
27. Wild M. Enlightening global dimming and brightening. Bull Am Meteorol Soc. 2012;93:27-37. https://doi.org/10.1175/BAMS-D-11-00074.1 [ Links ]
28. Doorenbos J, Pruitt W. Crop water requirements. FAO Irrigation and Drainage Paper 24. Rome: Food and Agriculture Organization; 1977. [ Links ]
29. World Meteorological Organization (WMO). Chapter 10: Measurement of evaporation. In: Guide to meteorological instruments and methods of observation. Part 1: Measurement of meteorological variables. 2014 ed. Geneva: WMO; 2014. p. 311-322. [ Links ]
30. Kruger AC, Goliger AM, Retief JV, Sekele S. Strong wind climatic zones in South Africa. Wind Struct. 2010;13:37-55. [ Links ]
31. Wright MA, Grab SW. Wind speed characteristics and implications for wind power generation: Cape regions, South Africa. S Afr J Sci. 2017;113, Art. 2016-0270. http://dx.doi.org/10.17159/sajs.2017/20160270 [ Links ]
32. Jung C, Taubert D, Schindler D. The temporal variability of global wind energy - Long-term trends and inter-annual variability. Energy Convers Manag. 2019;188:462-472. https://doi.org/10.1016/j.enconman.2019.03.072 [ Links ]
33. Young IR, Zieger S, Babanin AV. Global trends in wind speed and wave height. Science. 2011;332:451. https://doi.org/10.1126/science.1197219 [ Links ]
34. Young IR, Ribal A. Multiplatform evaluation of global trends in wind speed and wave height. Science. 2019;364:548-552. https://doi.org/10.1126/science.aav9527 [ Links ]
35. Luvuno L, Biggs R, Stevens N, Esler K. Woody encroachment as a social-ecological regime shift. Sustainability. 2018;10, Art. #2221. https://doi.org/10.3390/su10072221 [ Links ]
36. Richardson DM, Van Wilgen BW. Invasive alien plants in South Africa: How well do we understand the ecological impacts? S Afr J Sci. 2004;100:45-52. [ Links ]
37. Yapi TS, O'Farrell PJ, Dziba LE, Esler KJ. Alien tree invasion into a South African montane grassland ecosystem: Impact of Acacia species on rangeland condition and livestock carrying capacity. Int J Biodivers Sci Ecosyst Serv Manag. 2018;14:105-116. https://doi.org/10.1080/21513732.2018.1450291 [ Links ]
38. Vilà-Guerau de Arellano JV-G, Van Heerwaarden CC, Lelieveld J. Modelled suppression of boundary-layer clouds by plants in a CO2-rich atmosphere. Nat Geosci. 2012;5:701-704. https://doi.org/10.1038/ngeo1554 [ Links ]
 Correspondence:
Arthur Chapman
Email: achapman@sun.ac.za
Received: 29 Jan. 2020
Revised: 01 Feb. 2021
Accepted: 11 Feb. 2021
Published: 29 July 2021
Editor: Yali Woyessa
Funding: None

