


Servicios Personalizados
Articulo
 Inglés (pdf)
 Articulo en XML
 Referencias del artículo
Indicadores

Links relacionados
-
 Citado por Google
 -
 Similares en Google
Compartir

 Permalink
South African Journal of Science
versión On-line ISSN 1996-7489
versión impresa ISSN 0038-2353
S. Afr. j. sci. vol.117 no.7-8 Pretoria jul./ago. 2021
http://dx.doi.org/10.17159/sajs.2021/8226
RESEARCH ARTICLE
A simple approach for monitoring vegetation change using time series remote sensing analysis: A case study from the Thathe Vondo Area in Limpopo Province, South Africa
Nndanduleni Muavhi
Department of Geology and Mining, University of Limpopo, Polokwane, South Africa
ABSTRACT
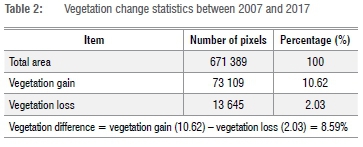
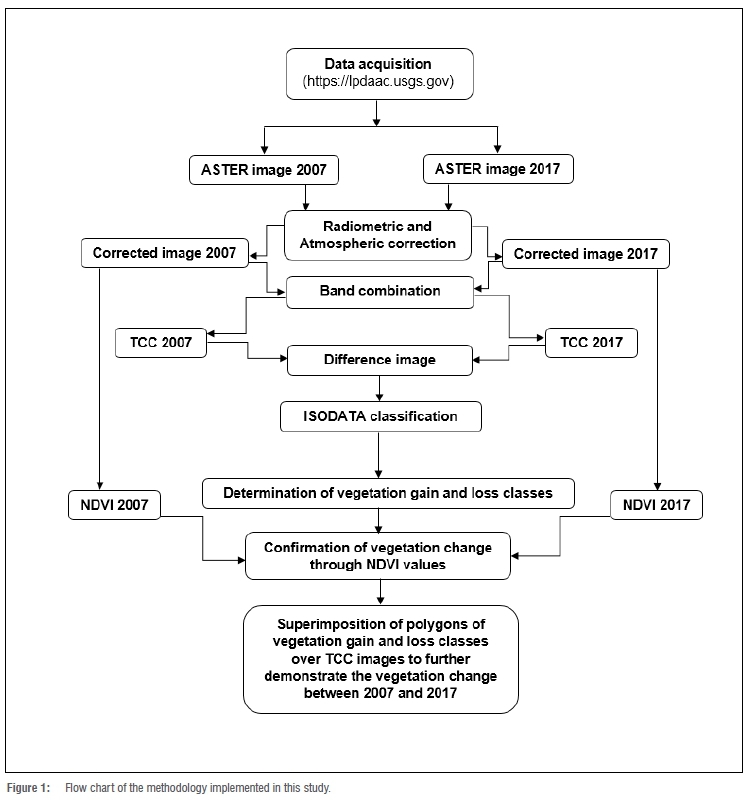
This study presents a simple approach of spatiotemporal change detection of vegetation cover based on analysis of time series remotely sensed images. The study was carried out at Thathe Vondo Area, which is characterised by episodic variation of vegetation gain and loss. This variation is attributable to timber and tea plantations and their production cycles, which periodically result in either vegetation gain or loss. The approach presented here was implemented on two ASTER images acquired in 2007 and 2017. It involved the combined use of band combination, unsupervised image classification and Normalised Difference Vegetation Index (NDVI) techniques. True colour composite (TCC) images for 2007 and 2017 were created from combination of bands 1, 2 and 3 in red, blue and green, respectively. The difference image of the TCC images was then generated to show the inconsistencies of vegetation cover between 2007 and 2017. For analytical simplicity and interpretability, the difference image was subjected to ISODATA unsupervised classification, which clustered pixels in the difference image into eight classes. Two ISODATA derived classes were interpreted as vegetation gain and one as vegetation loss. These classes were confirmed as regions of vegetation gain and loss by NDVI values of 2007 and 2017. In addition, the polygons of vegetation gain and loss regions were created and superimposed over the TCC images to further demonstrate the spatiotemporal vegetation change in the area. The vegetation change statistics show vegetation gain and loss of 10.62% and 2.03%, respectively, implying a vegetation gain of 8.59% over the selected decade.
SIGNIFICANCE:
• Vegetation change detection is essential in environmental monitoring and management of an area. This study presents a simple approach for assessing vegetation change over time. The approach involves change detection through the difference of spectral values of vegetation pixels of time series remotely sensed images.
Keywords: time series analysis, Thathe Vondo forest, remote sensing, vegetation change detection
Introduction
Time series remote sensing is an invaluable resource for dynamic monitoring of the environment over short and long time spans.1 This is because of the ability of remote sensors to cover a large area in a short period of time as well as their capability to revisit and acquire data for the exact area, which optimises environmental monitoring of large areas based on time series image analysis.24 In other words, as stated in Ghauri and Zaidi5, 'remote sensing provides continuous monitoring and mapping, both spatial and temporal, as opposed to a limited frequency point measurement'. Furthermore, rugged and hilly terrains can be expensive and cumbersome to access for point measurements.6 In addition to this, remotely sensed data of satellite platforms, such as the Advanced Spaceborne Thermal Emission and Reflection Radiometer (ASTER) and Landsat, can be accessed at no cost as their data are readily available and accessible.
Remote sensing has become an integral part of environmental monitoring because of its flexibility, efficiency, accessibility, and cost-effectiveness. Time series remote sensing analysis has been widely utilised in environmental monitoring and measurements of scale of land degradation3,7-12, including monitoring of environmental improvement during and after mine rehabilitation processes13-15. The most typically used techniques for vegetation change detection include principal component analysis, minimum noise fraction, tasselled cap, Normalised Difference Vegetation Index (NDVI) and supervised image classification.2-4,16-18 Supervised image classification is the process of clustering pixels in an image into classes corresponding to user-defined training classes.19 The accuracy of this classification method depends heavily on the quality of training sites and the spectral distinctness of the classes.
In this study, a simple approach for monitoring vegetation change using time series remote sensing analysis was proposed. The proposed approach involved the combined use of band combination, unsupervised image classification and NDVI.
Materials and methods
Figure 1 is a flow chart model illustrating the methodology of the proposed approach for monitoring vegetation using two time series images of the ASTER sensor.
Study area
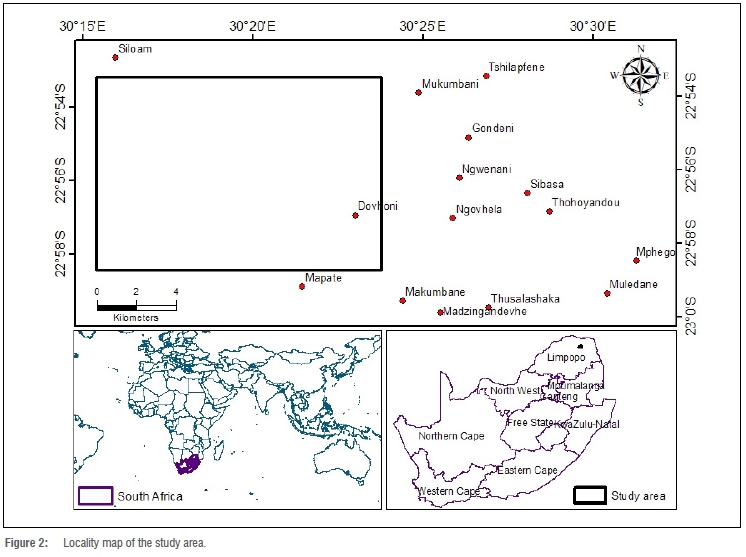
The area selected for this study was the Thathe Vondo Area, which is located about 13 km west of Thohoyandou town in the Limpopo Province of South Africa. The study area covered 150.84 km2 (Figure 2). Thathe Vondo is unique as it is characterised by episodic variation in vegetation gain and loss. This variation is attributable to timber and tea plantations and their production cycles, which periodically result in vegetation gain or loss. In this regard, vegetation change in the area seems inevitable. Furthermore, this makes the study area ideal for assessing the proposed approach for monitoring vegetation change over time.
Remote sensing data sets
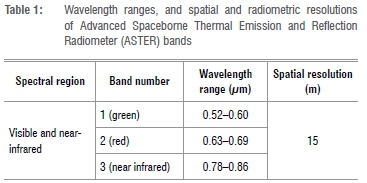
The remote sensing data selected for this study are ASTER L1T (Precision Terrain and Geometric Corrected Registered At-Sensor Radiance Product) scenes with Local Granule IDs of AST_L1T_00310262007081200 and AST_L1T_00310152017081915. The ASTER scenes were acquired in October 2007 and October 2017, respectively. These remote sensing data products were retrieved from the website (https://lpdaac.usgs.gov) maintained by the NASA Land Processes Distributed Active Archive Centre at the US Geological Survey / Earth Resources Observation and Science Centre in Sioux Falls, South Dakota, USA. ASTER covers a wide spectral region with 14 bands ranging from the visible to thermal infrared region. The spatial resolution varies with spectral region: 15 m in the visible and near infrared (VNIR), 30 m in the shortwave infrared, and 90 m in the thermal infrared. The VNIR bands (Table 1) were selected for monitoring vegetation gain and loss in the area. Vegetation has diagnostic spectral features in the VNIR spectral region of the electromagnetic spectrum. Furthermore, the VNIR region has better spatial resolution (15 m), which is the size of area represented by each pixel in an image. Spatial resolution has a significant impact on the spatial details of landcover mapping.19
Pre-processing and analysis of remote sensing data
The pre-processing and subsequent analysis of ASTER data were carried out using ENVI 5.0 and ArcGIS 10.3 software. The three VNIR bands of each ASTER scene were stacked together to build a new VNIR multiband image. The resultant multiband images of the two scenes were subset to cover the study area. Radiometric and atmospheric corrections of remotely sensed data in vegetation mapping have become a prerequisite. These corrections, particularly radiometric corrections, are essential when comparing multiple data sets over a certain period of time, as in the present study.20 In addition to radiometric distortions, solar irradiance, atmospheric transmittance, instrument gain, topographic effects, and albedo effects from radiance data need to be removed to avoid interference with the quality of the results.21 The dark object subtraction was applied to the two ASTER data sets in order to remove radiometric effects that may have affected the quality of the results. This calibration tool searches each band in an input data set for the darkest pixel value. Assuming that dark objects reflect no light, any value greater than zero must result from atmospheric scattering. The scattering is removed by subtracting this value from every pixel in the band.21 Additionally, a log residuals calibration tool was applied to the radiometric corrected data sets to remove solar irradiance, atmospheric transmittance, instrument gain, topographic effects, and albedo effects from radiance data. The log residuals tool also converts radiance data to a reflectance image, which is useful in mapping vegetation cover.21
Band combination
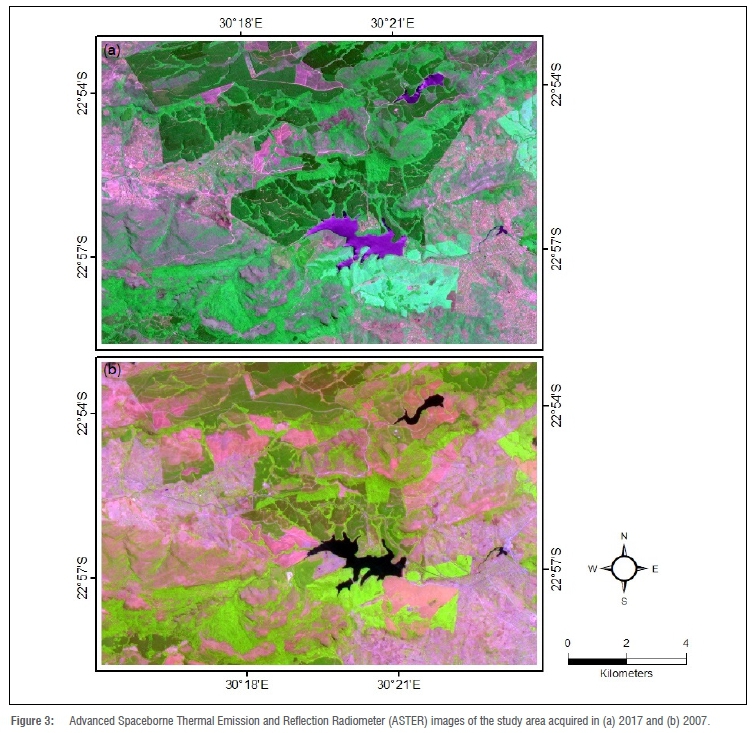
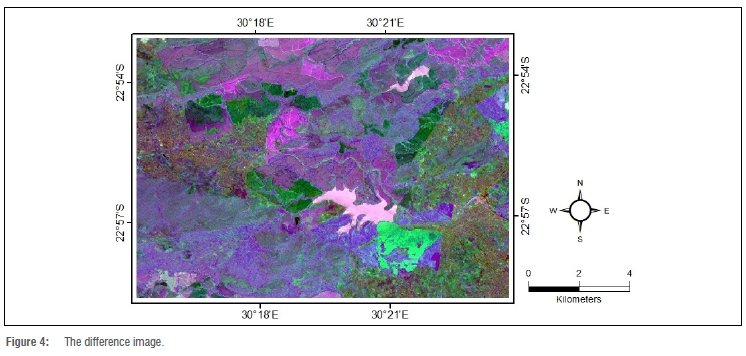
Band combination involves combining and displaying three bands, where each band is assigned one of the primary colours (red, green or blue). The generation of true colour composite (TCC) images from band combination can increase distinction between features.21 The TCC of ASTER images is created by combination of bands 1, 2 and 3 in red, blue and green, respectively. The advantage of a TCC image is that the features appear in their true colour form, which simplifies visual interpretability. For pixel-to-pixel-based comparison, the Image Analysis Tool from ArcGIS was used to create a difference image of the two time series images.
ISODATA classification
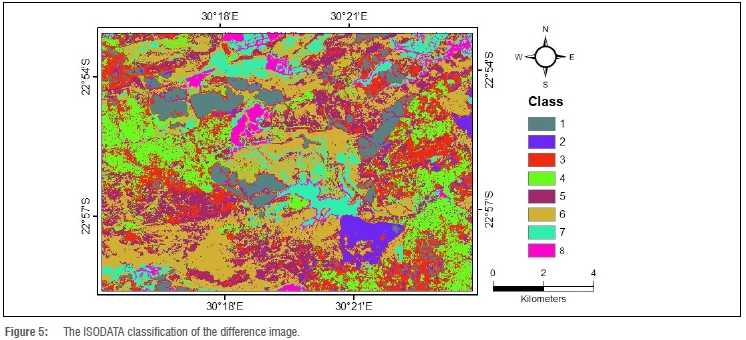
For best viewing and interpretation of the difference image, the ISODATA unsupervised image classification algorithm was applied to the difference image. The unsupervised image classification algorithm clusters pixels in an image based on statistics only, without any user-defined training classes.22 The clustering is based on grouping pixels of spectral similarities into the same classes. This is achieved by calculating class means that are evenly distributed in the data space and then iteratively clustering the remaining pixels using minimum distance techniques. Each iteration recalculates means and reclassifies pixels with respect to the new means.22
Normalised Difference Vegetation Index
The NDVI technique is implemented using near infrared (NIR) and red bands.23 The principle of applying the NDVI in vegetation mapping is that the vegetation is highly reflective and absorptive in NIR and visible red, respectively. The difference between these bands can be used to indicate the presence and greenness of vegetation. In other words, the NDVI is a biophysical parameter that is related to the photosynthetic property of vegetation. This parameter is capable of providing valuable information on the dynamic changes of vegetation cover, given that time series images are analysed. This makes the NDVI a good indicator of seasonally or periodically dynamic changes in vegetation condition. As a result, the NDVI has been widely used in monitoring the change in vegetation cover and vegetation health and productivity.2-4,17,18,24 The NDVI is mathematically expressed as the difference between NIR and red channels divided by their sum of them23:

where NIR and Red are the normalised reflectance values of NIR and red bands, respectively. The NDVI resulting values range from -1 to 1 and the common range for green and healthy vegetation is 0.2 to 123, while bare soil is typically represented by values <0. For pixel-to-pixel-based comparison, the Image Analysis Tool from ArcGIS was again used to generate the NDVI difference image of the two time series images.
Results and discussions
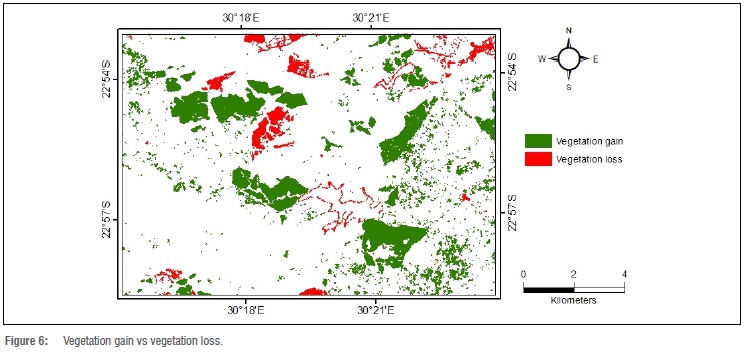
Figure 3 shows the TCC images for 2007 and 2017. The vegetation inconsistencies are evident in these images (Figure 3). The difference image of the TCC images is shown in Figure 4. As stated under the methodology, the difference image was subjected to ISODATA unsupervised classification for analytical simplicity and interpretability purposes. The ISODATA clustered pixels in the difference image into eight classes (Figure 5). To assign the ISODATA classes to vegetation gain and loss, the TCC image of 2017 was superimposed over the TCC image of 2007, and the Swap Layer Function from ArcGIS was used to carefully analyse and compare their dissimilarities. The Swap Layer Function involves superimposition of one image layer over another layer of similar geographical area, and cautiously swaps the superimposed layer to better illustrate the land-cover dissimilarities of the two image layers. Consequently, Classes 1 and 2 from the ISODATA image (Figure 5) were interpreted as vegetation gain and Class 8 as vegetation loss that occurred between 2007 and 2017 (Figure 6).
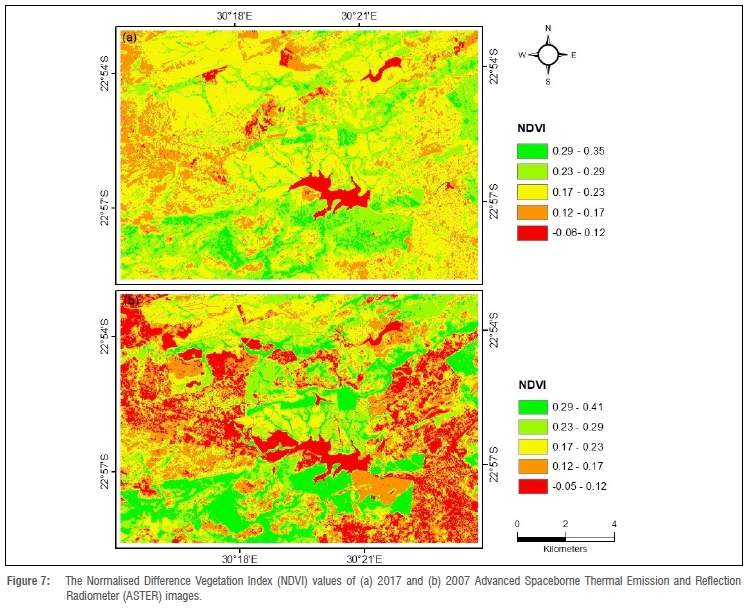
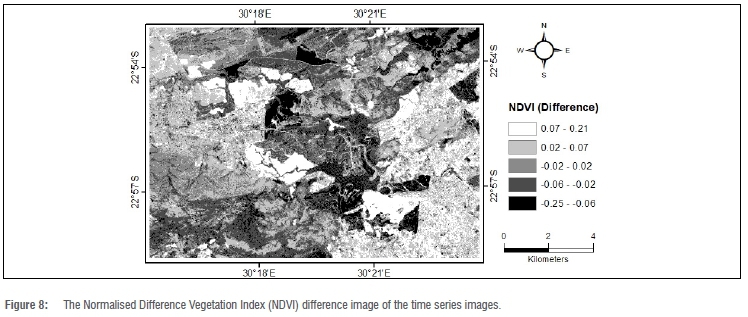
The NDVI values for the two-time series images are shown in Figure 7. As previously stated, the principle behind the implementation of NDVI in vegetation mapping is that vegetation is highly reflective and absorptive in NIR and visible red, respectively. As a result, the difference between these bands can indicate the presence and greenness of vegetation.23 The NDVI values of 2017 and 2007 range from -0.06 to 0.35 and -0.05 to 0.41, respectively (Figure 7). However, most pixels from 2017 are characterised by relatively higher NDVI values than pixels from the 2007 image. This implies that, by 2017 the area experienced vegetation gain and vegetation health improved. The NDVI difference image shows that the NDVI values increased to a maximum value of 0.21, which is considerably high and supports significant vegetation gain and productivity in the area (Figure 8). The NDVI values, of the difference image, which represent gain (0.07 to 021) and loss (-0.25 to -0.06) (Figure 8) correspond to vegetation gain and loss classes, respectively, in Figure 6.
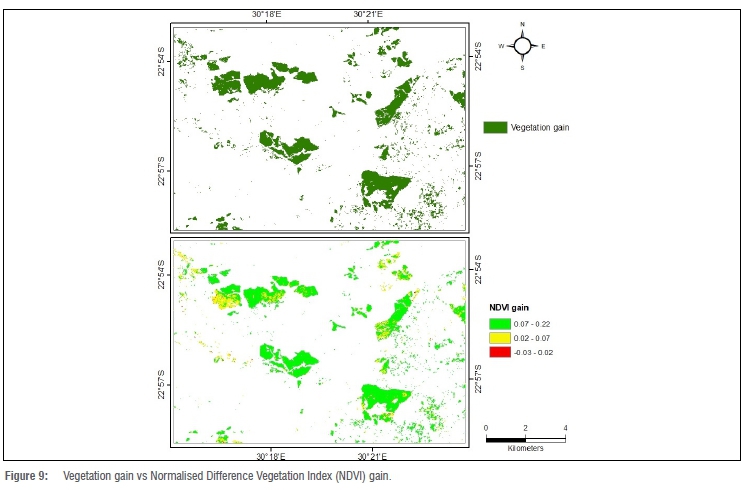
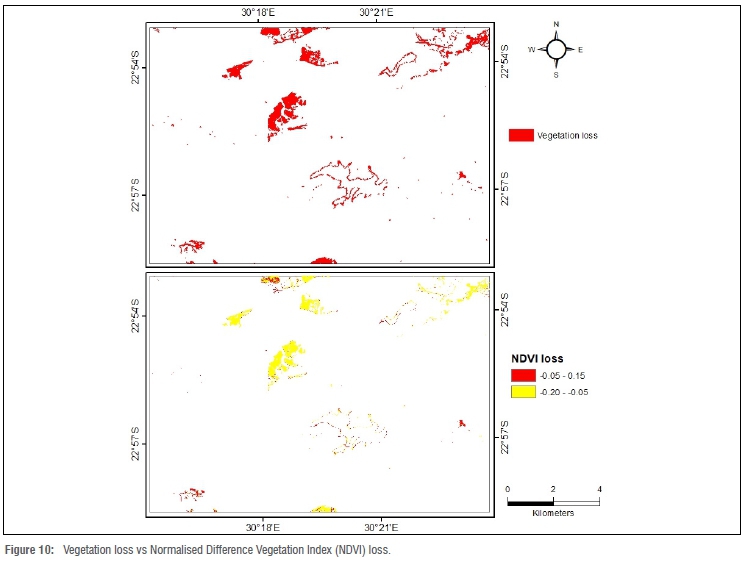
The vegetation gain and loss classes were converted to polygons. These polygons were used to extract NDVI values from the two NDVI images shown in Figure 7. This was done for comparative simplicity of vegetation gain and loss classes and their respective NDVI values. The vegetation gain class is characterised by high NDVI values and vegetation loss by low NDVI values (Figures 9 and 10) related to barren land. Thus, the NDVI values confirmed the ISODATA classes interpreted as vegetation gain and loss.
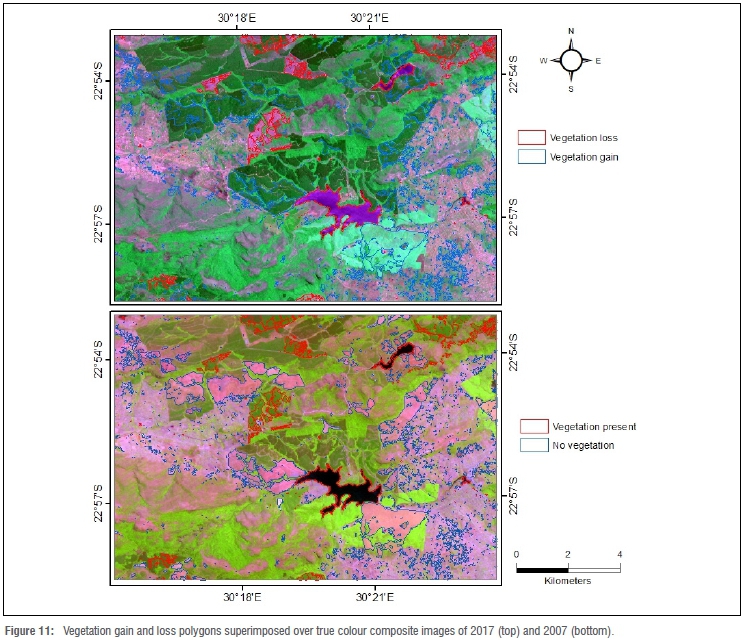
In addition, the vegetation gain and loss polygons were superimposed over the TCC images to further illustrate and verify the spatiotemporal vegetation change that occurred in the area from 2007 to 2017 (Figure 11). From Figure 11, the vegetation gain and loss regions are vividly pronounced from both images. The vegetation change statistics of the area between 2007 and 2017 are reported in Table 2. From October 2007 to October 2017, vegetation cover in the study area increased by 8.59%.
Conclusions
This study presents a simple approach of spatiotemporal change detection of vegetation cover based on time series analysis of remotely sensed images. The approach involves pixel-to-pixel-based comparison by differencing of spectral values of time series images. This approach is complemented by confirmation of vegetation change through NDVI values, whereby the increase and decrease in NDVI values correspond to vegetation gain and loss, respectively. The approach is quick and simple but yet effective, and it can be applied at any region under any environmental conditions.
Competing interests
I have no competing interests to declare.
References
1. Ayele GT, Tebeje AK, Demissie SS, Belete MA, Jemberrie MA, Teshome WM, et al. Time series land cover mapping and change detection analysis using geographic information system and remote sensing, Northern Ethiopia. Air Soil Water Res. 2018;11:1-18. https://doi.org/10.1177/1178622117751603 [ Links ]
2. Aly AA, Al-Omran AM, Sallam AS, Al-Wabel MI, Al-Shayaa MS. Vegetation cover change detection and assessment in arid environment using multitemporal remote sensing images and ecosystem management approach. Solid Earth. 2016;7:713-725. https://doi.org/10.5194/se-7-713-2016 [ Links ]
3. Ahmad N, Pandey P. Assessment and monitoring of land degradation using geospatial technology in Bathinda district, Punjab, India. Solid Earth. 2018;9:75-90. https://doi.org/10.5194/se-9-75-2018 [ Links ]
4. Nafaji Z, Fatchi P Darvishsefat AA. Vegetation dynamics trend using satellite time series imagery. Int Arch Photogramm Rem Sens Spat Inf Sci. 2019;XLII:783-788. https://doi.org/10.5194/isprs-archives-XLII-4-W18-783-2019 [ Links ]
5. Ghauri D, Zaidi A. Application of remote sensing in environmental studies. Aerosp Sci Eng. 2015;1:1-8. [ Links ]
6. Kaur B, Vatta K, Sidhu RS. Optimising irrigation water use in Punjab agriculture - Role of crop diversification and technology. Ind J Agric Ecol. 2015;70(3):307-318. [ Links ]
7. Zandi B, Chaure SK. Assessment of land degradation due to opencast mining using remote sensing and GIS. Ind Res Commun. 2015;9(1):68-73. [ Links ]
8. Fadhil AM. Land degradation detection using geo-information technology for some sites in Iraq. J Al-Nahrain University. 2009;12(3):94-108. https://doi.org/10.22401/JNUS.12.3.13 [ Links ]
9. Metternicht G, Zinck JA, Blanco PD, Del Valle HF. Remote sensing of land degradation - Experiences from Latin America and the Caribbean. J Environ Qual. 2009;39:42-61. https://doi.org/10.2134/jeq2009.0127 [ Links ]
10. Higginbottom TP Symeonakis E. Assessing land degradation and desertification using vegetation index data - Current frameworks and future directions. Remote Sens. 2014;6:9552-9575. https://doi.org/10.3390/rs6109552 [ Links ]
11. Ibrahim M, Al-Mashagbah A. Change detection of vegetation cover using remote sensing data as a case study - Ajloun area. Civil Environ Res. 2016;8(5):15. [ Links ]
12. Suh J, Kim S, Yi H, Choi Y An overview of GIS-based modelling and assessment of mining-induced hazards - Soil, water and forest. Environ Res Public Health. 2017;14:1-18. https://doi.org/10.3390/ijerph14121463 [ Links ]
13. Kariyawasam N, Raval S, Shamsoddini A. Incorporating remote sensing as a tool to assist rehabilitation monitoring in a dolomite mining operation in South Australia. Kuala Lumpur: International Federation of Surveyors (FIG) Press; 2014. p. 1-13. [ Links ]
14. Padmanaban R, Bhowmik AK, Cabral P A remote sensing approach to environmental monitoring in a reclaimed mine area. Int J Geo-Inf. 2017;6:1-14. https://doi.org/10.3390/ijgi6120401 [ Links ]
15. Dlamini LZD, Xulu S. Monitoring mining disturbance and restoration over RBM site in South Africa using LandTrendr algorithm and Landsat data. Sustainability. 2019;11:1-16. https://doi.org/10.3390/su11246916 [ Links ]
16. Xue J, Su B. Significant remote sensing vegetation indices - A review of developments and applications. J Sensors. 2017;2017:1-7. https://doi.org/10.1155/2017/1353691 [ Links ]
17. Adamu B, Tansey K, Ogutu B. Remote sensing for detection and monitoring vegetation affected by oil spoils. Int J Rem Sens. 2018;39(11):3628-3645. https://doi.org/10.1080/01431161.2018.1448483 [ Links ]
18. Hua L, Wang H, Sui H, Wardlow B, Hayes MJ, Wang J. Mapping the spatio-temporal dynamics of vegetation response lag to drought in semiarid region. Rem Sens. 2019;11:1-22. https://doi.org/10.3390/rs11161873 [ Links ]
19. Muavhi N. Evaluation of effectiveness of supervised classification algorithms in land cover classification using ASTER images - A case study from the Mankweng (Turfloop) Area and its environs, Limpopo Province, South Africa. S Afr J Geomat. 2020;9(1):61-74. [ Links ]
20. Dewa RP, Danoedoro P. The effect of image radiometric correction on the accuracy of vegetation canopy density estimate using several Landsat-8 OLI's vegetation indices - A case study of Wonosari area, Indonesia. IOP Conf Ser Earth Environ Sci. 2017;54:1-7. https://doi.org/10.1088/1755-1315/54/1/012046 [ Links ]
21. Research Systems Inc. ENVI Tutorials. Boulder, CO: Research Systems Inc.; 2008. [ Links ]
22. Tou JT, Gonzalez RC. Pattern recognition principles. Reading, MA: Addison-Wesley Publishing Company; 1974. [ Links ]
23. Jensen JR. Introductory digital image processing. Englewood Cliffs, NJ: Prentice-Hall; 1986. [ Links ]
24. Atesoglu A. Remote sensing and GIS application for suitable afforestation area selection in Turkey. Journal of the Faculty of Forestry Istanbul University. 2014;65(1):53-59. https://doi.org/10.17099/jffiu.00032 [ Links ]
 Correspondence:
Nndanduleni Muavhi
Email: nndandulenimuavhi@gmail.com
Received: 27 Apr. 2020
Revised: 16 Dec. 2020
Accepted: 23 Jan. 2021
Published: 29 July 2021
Editor: Yali Woyessa
Funding: None

