


Servicios Personalizados
Articulo
 Inglés (pdf)
 Articulo en XML
 Referencias del artículo
Indicadores

Links relacionados
-
 Citado por Google
 -
 Similares en Google
Compartir

 Permalink
South African Journal of Science
versión On-line ISSN 1996-7489
versión impresa ISSN 0038-2353
S. Afr. j. sci. vol.117 no.7-8 Pretoria jul./ago. 2021
http://dx.doi.org/10.17159/sajs.2021/8280
RESEARCH ARTICLE
Application of a soil quality triad in assessing ecological risk posed to croplands
Gerhard C. du PreezI, II; Hendrika FourieI; Mieke S. DaneelII; Victor WepenerI
IUnit for Environmental Sciences and Management, North-West University, Potchefstroom, South Africa,
IIAgricultural Research Council -Institute for Tropical and Subtropical Crops, Nelspruit, South Africa
ABSTRACT
Healthy soil ecosystems fulfil multiple functions (e.g. cycling nutrients and controlling pests), which play an important role in sustainable food production. However, the application of polluted irrigation water poses a major risk to soil quality (health) and warrants investigation to ultimately inform decision-making. We hypothesised that the standardised soil quality TRIAD approach (ISO 19204), which integrates the chemistry, ecology, and ecotoxicology lines of evidence, can be used as part of an ecological risk assessment of cropland soils. To investigate the applicability of this approach in an agricultural setting, we collected soils from croplands associated with the Hartbeespoort and Crocodile (West) irrigation schemes, which utilise water known to be heavily impacted by anthropogenic (metal, nutrient, and salt) pollution. Croplands associated with the Marico-Bosveld Irrigation Scheme served as the reference systems. Data from the three lines of evidence were scaled, weighted, and integrated. Moderate risk was evidenced for nutrient and salt content in most croplands associated with the Hartbeespoort Irrigation Scheme. However, either no or low risk was recorded for the ecology and ecotoxicology lines of evidence. Finally, the integrated risk assessment concluded that only low ecological risk was posed to soil quality, likely as a result of agricultural activities (e.g. tillage and fertiliser application) that deteriorated soils also at the reference system. This study shows important limitations in the application of ecological risk assessments in conventionally farmed soils, but still holds promise for organic and conservation systems.
SIGNIFICANCE:
• A pollution linkage between irrigation water and cropland soils was evidenced, but presented only minimal risk to soil quality.
• Conventional agricultural practices (e.g. tillage) mask the risk posed by environmental pollution and impair the applicability of ecological risk assessments.
• It is possible that this approach can be applied in less disturbed crop production systems, for example in conservation (regenerative) and organic croplands.
Keywords: environmental pollution, food security, integrated risk assessment, soil health, sustainable food production
Introduction
Agricultural output is required to double within the next 40 years in order to meet predicted global demands.1 Producers and policymakers, as well as the general public, are increasingly aware of this need and the role that promoting soil quality (health) plays in sustainable agriculture.2 However, soils in many agricultural systems are threatened by anthropogenic activities that result in environmental pollution.3-5 Good examples of threatened systems are the Hartbeespoort and Crocodile West irrigation schemes, which utilise water from the heavily polluted Crocodile (West) River.5,6 Therefore, where a pollution linkage exists, soil quality should be assessed and monitored in order to predict and mitigate the subsequent effects.7
Traditionally, soil quality assessments in agricultural systems were based on physico-chemical (abiotic) properties that influence crop yield and quality, while biotic attributes were mostly disregarded.8 However, soils can be viewed as living ecosystems with the associated faunal assemblages fulfilling important functions including plant disease, insect and weed control; carbon transformation; nutrient cycling; and soil structure maintenance.9-11 Assessing and monitoring soil quality thus requires a holistic approach that integrates both abiotic and biotic measurements. Although recently developed soil quality assessment frameworks for crop production (e.g. Soil Health Tool8) follow a more integrative approach, the aim of these frameworks is primarily to measure soil quality restoration and determine fertiliser needs. Therefore, these frameworks do not consider the ecological risk posed by anthropogenic pollution and also lack ecotoxicological perspective.
The TRIAD approach, in turn, incorporates the chemistry, ecology, and ecotoxicology lines of evidence (LOEs). Although this approach was originally developed as a sediment quality assessment12, it has also been used to evaluate soil quality13-15. Yet, a framework for undertaking a soil quality TRIAD as part of an ecological risk assessment (ERA) was only standardised within the last few years.7 According to ISO192047, each LOE is represented by one or multiple appropriate tests of which the data are scaled, for example between 0 (no effect) and 1 (maximum effect), and, if necessary, weighted (to reduce uncertainty). Finally, an integrated (combined) ecological risk number is calculated, which can be used as a decision support tool to inform policymakers on the necessity and urgency of mitigating ecological disturbance.
In this study, we applied the soil quality TRIAD approach and hypothesised that it could be used as part of an ERA of cropland soils. To our knowledge, this report is the first on the use of the standardised soil quality TRIAD approach, as part of an ERA, to evaluate the risk posed to cropland soils.
Material and methods
Site description
The study sites consisted of four croplands (HB1, HB2, HB3, and HB4) associated with the Hartbeespoort Irrigation Scheme (South Africa), which receive water via a canal system from the Hartbeespoort Dam, a major reservoir of the Crocodile (West) River System. An additional two croplands (CW5 and CW6), associated with the Crocodile (West) Irrigation Scheme (South Africa), which abstract water directly from the Crocodile (West) River downstream of the Hartbeespoort Dam, were also selected for investigation.
The Crocodile (West) River System is severely affected by pollutants (e.g. metals, nutrients, and salts) that originate from urban, industrial, and agricultural run-off, sewage effluent, as well as wastewater discharge.6,16,17 According to Du Preez et al.6, a cause for concern is the increase in salt and nutrient concentrations recorded from 2005 to 2015. Two croplands associated with the Marico-Bosveld (Ref 7 and Ref 8) Irrigation Scheme (South Africa) were selected as reference sites, as they receive water from the minimally impacted Marico River.6,18
Two sampling events were undertaken during March/April and September/October 2016 at all the listed study and reference sites. During the first sampling interval, the selected croplands were subjected to soybean crop production, while different crops (beetroot [Beta vulgaris L.], carrot [Daucus carota L.], maize [Zea mays L.], soybean [Glycine max L. Merrill], and wheat [Triticum aestivum L.]) were cultivated during the second sampling interval on the respective croplands. See Supplementary table 1 for further details.
Chemistry LOE: Sampling, processing, and analysis of soil
The stepwise execution of the soil quality TRIAD and ERA is schematically illustrated in Figure 1. For assessments associated with the chemistry LOE, 12 composite samples (consisting of five sub-samples each) of rhizosphere soils were collected per cropland. These sub-samples were collected following a diagonal sampling pattern19 along 12 evenly spaced lines (one line per composite sample) extending from the centre to the edge of the irrigated croplands5. Using a clean hand shovel, soil was sampled up to a depth of 20 cm. These samples were transported and stored at -20 °C until further processing.
Soil samples were homogenised, dried at 40 °C for 48 h, and sieved (<2 mm). Subsequently, soil water (capillary water that occupies soil pores) was extracted using the saturated paste extraction method.20 Although laborious and time consuming, this method is generally regarded as the most accurate measure of soil salinity under field conditions.21,22 Extracted soil water samples were vacuum filtered with a 0.45-μm Sartorius CN sterile membrane, which allowed analysis of the dissolved fraction of metals, nutrients, and salts.
Electrical conductivity and pH were measured using WTW Cond 3210 and Mettler Toledo FE20 meters, respectively. Ion (calcium [Ca], magnesium [Mg], phosphorus [P], potassium [K], and sodium [Na]) and metal concentrations (see 'Scaling, weighting, and integration of TRIAD results' for a list of analysed metals) were measured using an Agilent 7500 CE series ICP-MS, while major anion (chloride [Cl], nitrate [NO3], nitrite [NO2], and sulfate [SO4]) concentrations were quantified with a Metrohm 930 Compact IC Flex. A Pharo 300 Spectroquant was used to measure ammonium (NH4) concentrations, while total alkalinity (pH < 8.2) was quantified by means of titration.
Ecology LOE: Sampling, extraction, and analysis of nematode assemblages
For the characterisation of nematode assemblages (ecology LOE), rhizosphere soils were collected following the same methodology as described above. However, due to the typical heterogeneous distribution of nematodes in croplands, 20 composite samples (consisting of five sub-samples each) per cropland were analysed for this LOE. In total, 320 soil composite samples were collected and stored at 4 °C until further processing.
Soil samples were homogenised and nematodes were extracted from a 200-g representative aliquot using the decanting and sieving, sugar centrifugal flotation method.23 Nematodes were stored in 10 mL filtered tap water at 6-8 °C and counted (within 2 weeks of extraction) using a Nikon Eclipse 50i light microscope (100x magnification). Family level occurrence and abundance data were generated in order to calculate the Maturity Index, used to classify soil ecosystems on a scale from 1 (disturbed/enriched) to 5 (mature/structured)24, by applying the Nematode Indicator Joint Analysis (NINJA) web-based tool25.
The Shannon Diversity Index was calculated as follows:
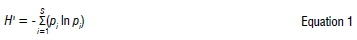
where pi represents the proportion of the i-th taxa in a sample.26 The inclusion of this index was considered appropriate as healthier soils typically present a higher diversity of biota.27
Ecotoxicology LOE: Measuring the toxicity of soil water samples
Because electrical conductivity serves as a measure of the concentration of dissolved ions28, it was used as a proxy for salt and nutrient content. Subsequently, from each farmland, the sample with the highest electrical conductivity per sampling interval (Supplementary table 2) was selected for further investigation. Caenortiabditis elegans (sourced from the Caenorhabditis Genetics Centre, University of Minnesota, Twin Cities, United States of America) was used as the test organism, as this nematode species has been well established as a model organism for ecotoxicological studies.29 Therefore, following ISO1087230, the growth and reproduction of C. elegans was determined after exposure (96 h at 20 °C) to extracted soil pore water samples. Four replicates of each of the selected samples were tested. The negative control consisted of M9 medium, while a positive control (benzylcetyldimethylammonium chloride monohydrate [BAC-C16]) was included to ensure the validity of the test results.30 The EC50 value of BAC-C16 was calculated (results not shown) as 16.94 mg/L. In order for the test to be valid, the percentage growth inhibition for the positive control should be between 20% and 80% when measured against the negative control.30
The growth and reproduction results were expressed as the percentage inhibition (against the negative control) as follows:
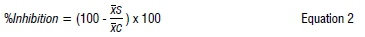
where xs and xc represent the mean of the parameter for a cropland and the negative control, respectively. Furthermore, the data were tested for normality using the D'Agostino and Pearson omnibus test, after which the unpaired t-test (parametric data) or Mann-Whitney test (non-parametric data) was used to test for significant differences between the means. For parametric data with an unequal number of replicates, Welch's correction was applied. Significance for all univariate analyses was regarded at p<0.05 and performed using the Graphpad Prism 6 software package.
Scaling, weighting, and integration of TRIAD results
Based on the criteria listed in Table 1, scaling from 0 (no effect) to 1 (maximum effect) and weighting of results were first applied within each LOE, after which the integrated ecological risk was calculated. It should be noted that if any of the tests presented risk lower than the reference sites (averaged), a risk value of 0 was assigned.14
For the chemistry LOE, the concentrations of metals, nutrients, and salts were considered. Only metals (aluminium [Al], arsenic [As], chromium [Cr], copper [Cu], manganese [Mn], selenium [Se], uranium [U], and zinc [Zn]) for which a target water quality range (tWqR) is provided in the South African Water Quality Guidelines: Aquatic Ecosystems31were included in the assessment. These guidelines were used because no criteria exist for soil water extracted using the saturated paste method. Nonetheless, these guidelines have been developed by considering the toxic effect of dissolved metals on faunal assemblages31 and therefore were deemed appropriate for use in this study13. However, to compensate for uncertainty associated with the use of these guidelines, scaled result values were weighted (see below). The concentration of each metal (averaged per cropland) was scaled as follows13:
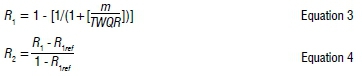
where m and ref represent the concentration of the metal at the study and reference sites, respectively, and TWQR the target water quality range for the specific metal. R1and R2denote the first and second step (i.e. result 1 and result 2) of the scaling approach, respectively.
The combined risk presented by the selected metals at each site was calculated as follows:
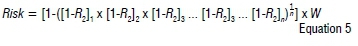
where n represents the number of metals and W the weighting factor (of 0.8), which accounts for the uncertainty associated with the use of the specified target water quality criteria.7
However, the risk posed by nutrient (inorganic N [NO2 + NO3 + NH4] and P) and salt (Cl, sO4, Ca, K, Mg, and Na) ions were calculated differently as the South African Department of Water Affairs and Forestry31 does not provide TWQR values for most salts. The combined risk was calculated based on the ratio-to-reference (RTF) method as implemented by Piva et al.32 and Li et al.33 as follows:
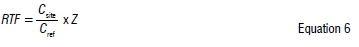
where Csiteand Crefrepresent the concentration of the constituent (nutrient or salt ion) at the study and reference sites, respectively. Z represents the statistical significance (p-value) between the means of the study and reference sites as determined using an analysis of variance test. Z equals 1 [if p<0.05], 3.5 - (50 x p) [if 0.05<p<0.06], or 0.2 x p-03257 [if 0.06<p<1]. Analysis of variance tests were performed using the Graphpad Prism 6 software package. Thereafter, the hazard quotient (HQ) was calculated per site as follows:
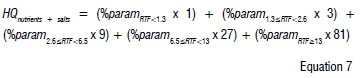
where %paramRTFis the percentage of RTF values within the specified range to the total number. Based on this assessment, each site's hazard level can be categorised in one of five classes, namely: Absent (HQ=100), Slight (100<HQ<300), Moderate (300<HQ<900), Major (900<HQ<2700), and Severe (2700<HQ<8100).33 However, in order to integrate these results into the ERA, each class was scaled by assigning an equal range between 0 and 1 as follows: Absent (0-0.2), Slight (0.21-0.4), Moderate (0.41-0.6), Major (0.61-0.8), and Severe (0.81-1). This was achieved by setting the limits of each HQ class to represent the limits of the corresponding scaled class and adjusting the values accordingly.
The risk results of the (1) metals and (2) nutrients and salt assessments were integrated into a single risk number (between 0 and 1) per site per sampling interval as follows:

The ecology (Maturity and Shannon Diversity indices) LOE was scaled using the BKX ('bodemkwaliteitsindex') method, as this allows results from different tests (within a LOE) to be integrated, while both lower and higher than reference values can be used.13 The following equation was applied:

where x is the ratio between the study and reference sites and n is the number of results (toxicity endpoints).
The BKX method was also used for scaling the ecotoxicology (C. elegans growth and reproduction inhibition tests) LOE.
Finally, the integrated ecological risk number (between 0 and 1) for the chemistry, ecology, and ecotoxicology LOEs was calculated per site per sampling interval as follows:
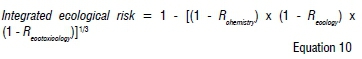
Equal weights (of 1) were assigned to risk numbers calculated for each LOE. Following Jensen et al.13, each risk number was categorised as presenting either no, low, moderate, or high risk. Lastly, the standard deviation between the LOEs was calculated in order to evaluate the concordance between the three LOEs.7,13
Results and discussion
Soil quality TRIAD assessment
For the execution of the ERA, data for the ecotoxicology LOE were generated and are reported below, while data for the chemistry and ecology LOEs were sourced from Du Preez et al.5 The latter authors found that the studied croplands, when compared against the reference sites, were irrigated with water that contained elevated salt and nutrient (inorganic N and P) concentrations, which influenced especially Na concentrations in the soil (chemistry LOE). Furthermore, nematode-specific and general community indices (ecology LOE) showed that the studied croplands, including the reference sites, presented disturbed soil ecosystems. (See Du Preez et al.5 for a detailed discussion on the results.)
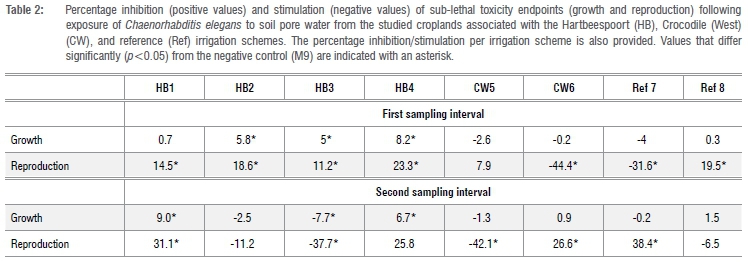
Results from the ecotoxicology LOE are presented as the percentage inhibition (against the negative control) of C. elegans growth and reproduction (Table 2). The percentage growth inhibition for the positive control, also measured against the negative control, was calculated as 55.3%; the tests were thus valid (i.e. ranging between 20% and 80% inhibition). Significant (p<0.05) inhibition of growth was observed for HB2 (5.8%), HB3 (5%), and HB4 (8.2%) during the first sampling interval. During the second sampling interval, significant (p<0.05) growth inhibition was observed for hB1 (9%) and HB4 (6.7%), while significant (p<0.05) stimulation was observed for HB3 (-7.7%). Reproduction of C. elegans was significantly (p<0.05) inhibited during the first sampling interval at all croplands associated with the Hartbeespoort Irrigation Scheme, as well as Ref 8 (19.5%). During the same sampling interval, C. elegans reproduction was significantly (p<0.05) stimulated for CW 6 (-44.4%) and Ref 7 (-31.6%). Furthermore, during the second sampling interval, HB1 (31.1%), CW6 (26.6%), and Ref 7 (38.4%) presented significant (p<0.05) reproduction inhibition, while HB3 (-37.7%) and CW5 (-42.1%) presented significant (p<0.05) reproduction stimulation.
The ecotoxicology results indicated that substantial variability occurred between the executed tests (growth and reproduction), as well as between sampling intervals. Chaenorhabditis elegans reproduction data also presented larger inhibition/stimulation ranges, when compared against growth, which indicates that reproduction was likely more sensitive. This supports findings by Höss et al.34 who studied the response of C. elegans to contaminated soils and found reproduction to be the most sensitive parameter (compared to growth and fertility). Furthermore, the reproduction of target organisms is regarded as being more ecologically relevant than growth.35 This represents one of the key advantages of C. elegans toxicity testing because intact (whole) individuals with different functioning physiological systems (e.g. digestive and reproductive) are exposed36, resulting in the potential measurement of multiple physiological endpoints. The stimulation of C. elegans reproduction can be regarded as a toxic response (e.g. hormesis)37 and was therefore included in the ERA.
Integrated ecological risk assessment
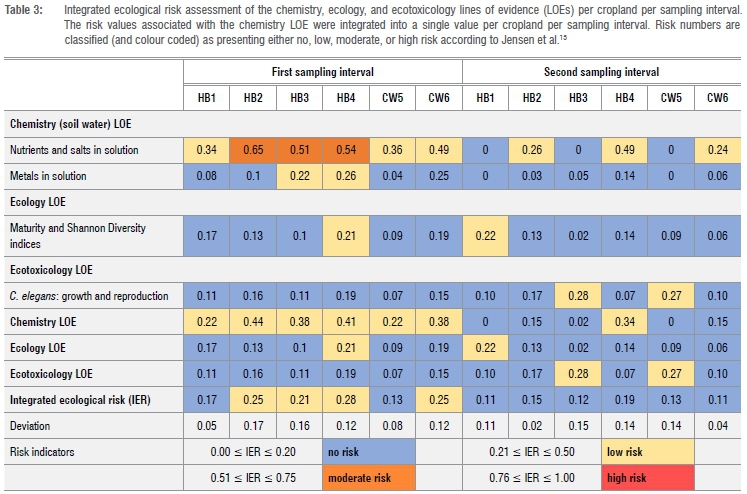
When considering the chemistry LOE, nutrient and salt contents presented moderate risk (Table 3) at most of the croplands (HB2, HB3 and HB4) associated with the Hartbeespoort Irrigation Scheme during the first sampling interval. However, for the remainder of the study sites, as well as during the second sampling interval, either no or low risk was evidenced for nutrient and salt contents. Metals presented only low risk (at some sites) during the first sampling interval and no risk during the second sampling interval.
The moderate risk evidenced for nutrient and salt contents at some croplands can lead to a negative impact on both the abiotic and biotic components of soil quality. From an abiotic perspective, elevated salt levels may cause salinity-induced water stress, which can have a negative impact on plant growth.28 Furthermore, increased nutrient levels can result in excessive crop growth, while also resulting in algae and aquatic plants clogging irrigation infrastructure.6,28 From a biotic perspective, increased soil salinity can inhibit microbial growth38,39, while specific ions can present toxicity-induced effects38,40. Furthermore, increased nutrient levels, although potentially serving as a food source to soil communities, can alter food-web structures.41-43
For the ecology LOE, no risk was evidenced during both sampling intervals with the exception of low risk at HB4 (first sampling interval) and HB1 (second sampling interval). The ecotoxicology LOE presented no risk for all croplands during the first sampling interval and low risk at only HB3 and CW5 during the second sampling interval. It is clear that, although ecological disturbance and soil pore water toxicity were evidenced at most of the study sites, either no or low risk was calculated due to the reference sites also presenting ecological disturbance and soil pore water toxicity. Therefore, even though elevated salt and nutrient concentrations may pose a threat to soil quality, it was not evidenced in this study.
Ultimately, the integrated ERA evidenced only low risk during the first sampling interval, at HB2, HB3, HB4 and CW6, and no risk during the second sampling interval. This outcome can be regarded as valid as the standard deviation in ecological risk recorded between the three LOEs for the studied croplands was low (< 0.17) during both sampling intervals. This is indicative of low uncertainty relating to the execution of TRIAD tests and integration of the LOEs.7 According to Mesman et al.44, the maximum proposed deviation value is 0.4 - well above values evidenced during this study.
Confounding influence of conventional agricultural activities
The ecological disturbance and soil pore water toxicity recorded at the reference sites are indicative of anthropogenic disturbance related to conventional farming practices. Du Preez et al.5 showed that a strong, positive correlation existed at the study sites between soil inorganic N content, crop production (and the associated agricultural activities), and r-strategist nematodes, which are more tolerant to environmental disturbance than K-strategists.24,45 This suggests that agricultural activities (e.g. tillage and fertiliser application) likely induced shifts in faunal community structures and impacted soil quality.5 The physical disturbance or tilling of soils, as was performed at all the studied and reference sites at one or multiple points within a 2-year time period before sampling (from personal communications with farmers), negatively impacts soil quality.46 Zhong et al.47 reported that tillage not only influenced soil structure, organic content, and the water retention capability of soils, but also the soil faunal community structure. With the application of nutrients (as fertilisers), Hu et al.43 reported an increase in the abundance of especially bacterivore nematodes, while elevated levels of N and P may reduce soil biodiversity. Similarly, Sarathchandra et al.48 reported a reduction in faunal diversity as a result of N application.
Considerations and recommendations
In the present study, the negative impact of agricultural practices associated with conventional farming masked the potential ecological risks posed to cropland soils. This represents an important limitation in the application of the soil quality TRIAD. Nonetheless, the soil quality TRIAD, as part of an ERA, has potential in agricultural systems that are less disturbed (e.g. conservation and/or organic systems) by agricultural activities.2
Furthermore, the lack of soil quality guidelines and target values specific for soil pore water extracted using the saturated paste method, creates some degree of uncertainty. Although weighting was applied in the present study to reduce this uncertainty, the development of such guidelines would be of benefit to environmental managers and/or researchers who aim to make use of the soil quality TRIAD approach. Alternatively, chemical extraction methods for which soil screening values are available can be considered.13
Conclusion
The standardisation of the soil quality TRIAD approach, as part of an ERA, provided a framework for the assessment and monitoring of agricultural systems threatened by anthropogenic pollution. Although we have demonstrated important limitations in the application of this framework in conventionally farmed croplands, it still holds promise for systems with minimal soil disturbance. It is therefore possible that this framework will be applicable in the assessment of conservation (regenerative) and organic crop production systems.
Acknowledgements
We thank Daneel du Preez and Willie Landman for assisting with field sampling.
Competing interests
We have no competing interests to declare.
Authors' contributions
All authors were involved in the conceptualisation of the study, while G.D.P undertook field sampling and sample analysis. G.D.P and V.W. were responsible for data analysis. The first draft of the manuscript was written by G.D.P after which the remaining authors provided input. Finally, the manuscript was revised and approved for submission by all authors.
Data availability
The data generated and analysed during this study are available in the supplementary material and in previously published works as indicated. Any additional data will be made available by the corresponding author upon request.
References
1. McBratney AB, Field DJ, Morgan CLS, Jarrett LE. Soil security: A rationale. In: Field DJ, Morgan CLS, McBratney AB, editors. Global soil security. Cham: Springer; 2017. p. 3-14. [ Links ]
2. Swanepoel CM, Swanepoel LH, Smith HJ. A review of conservation agriculture research in South Africa. S Afr J Plant Soil. 2017;35:1-10. https://doi.org/10.1080/02571862.2017.1390615 [ Links ]
3. Ma S-C, Zhang H-B, Ma S-T, Wang R, Wang G-X, Shao Y et al. Effects of mine wastewater irrigation on activities of soil enzymes and physiological properties, heavy metal uptake and grain yield in winter wheat. Ecotoxicol Environ Saf. 2015;113:483-490. https://doi.org/10.1016/j.ecoenv.2014.12.031 [ Links ]
4. Van der Laan M, Bristow K, Stirzaker RJ, Annandale J. Towards ecologically sustainable crop production: A South African perspective. Agric Ecosyst Environ. 2017;236:108-119. https://doi.org/10.1016/j.agee.2016.11.014 [ Links ]
5. Du Preez GC, Daneel MS, Wepener V Fourie H. Beneficial nematodes as bioindicators of ecosystem health in irrigated soils. Appl Soil Ecol. 2018;132:155-168. https://doi.org/10.1016/j.apsoil.2018.08.008 [ Links ]
6. Du Preez GC, Wepener V Fourie H, Daneel MS. Irrigation water quality and the threat it poses to crop production: Evaluating the status of the Crocodile (West) and Marico Catchments, South Africa. Environ Monit Assess. 2018;190:127. https://doi.org/10.1007/s10661-018-6512-y [ Links ]
7. ISO19204. Soil quality - procedure for site-specific ecological risk assessment of soil contamination (soil quality triad approach). Geneva: International Organization for Standardization; 2017. [ Links ]
8. Haney RL, Haney EB, Smith DR, Harmel RD, White MJ. The soil health tool -theory and initial broad-scale application. Appl Soil Ecol. 2018;125:162-168. https://doi.org/10.1016/j.apsoil.2017.07.035 [ Links ]
9. Kibblewhite M, Ritz K, Swift M. Soil health in agricultural systems. Philos T Roy Soc B. 2008;363(1492):685-701. https://doi.org/10.1098/rstb.2007.2178 [ Links ]
10. Neher DA. Role of nematodes in soil health and their use as indicators. J Nematol. 2001;33(4):161-168. [ Links ]
11. Lehman RM, Cambardella CA, Stott DE, Acosta-Martinez V Manter DK, Buyer JS, et al. Understanding and enhancing soil biological health: The solution for reversing soil degradation. Sustainability. 2015;7(1):988-1027. https://doi.org/10.3390/su7010988 [ Links ]
12. Chapman PM. The sediment quality triad approach to determining pollution-induced degradation. Sci Total Environ. 1990;97:815-825. https://doi.org/10.1016/0048-9697(90)90277-2 [ Links ]
13. Jensen J, Mesman M, Rutgers M, Dirven-van Breemen L, Sorokin N, Ter Laak TL, et al. Ecological risk assessment of contaminated land - decision support for site specific investigations. Bilthoven: Rijksinstituut voor Volksgezondheid en Milieu; 2006. [ Links ]
14. Ribé V Aulenius E, Nehrenheim E, Martell U, Odlare M. Applying the triad method in a risk assessment of a former surface treatment and metal industry site. J Hazard Mater. 2012;207-208:15-20. https://doi.org/10.1016/j.jhazmat.2011.07.120 [ Links ]
15. Gutiérrez L, Garbisu C, Ciprián E, Becerril JM, Soto M, Etxebarria J, et al. Application of ecological risk assessment based on a novel TRIAD-tiered approach to contaminated soil surrounding a closed non-sealed landfill. Sci Total Environ. 2015;514:49-59. https://doi.org/10.1016/j.scitotenv.2015.01.103 [ Links ]
16. South African Department of Environmental Affairs and Tourism (DEAT). State-of-rivers report: Monitoring and managing the ecological state of rivers in the Crocodile (West) Marico Water Management Area. Pretoria: DEAT; 2005. [ Links ]
17. Ballot A, Sandvik M, Rundberget T, Botha CJ, Miles CO. Diversity of cyanobacteria and cyanotoxins in Hartbeespoort Dam, South Africa. Mar Freshwater Res. 2014;65(2):175-189. https://doi.org/10.1071/MF13153 [ Links ]
18. Wolmarans CT, Kemp M, De Kock KN, Wepener V. The possible association between selected sediment characteristics and the occurrence of benthic macroinvertebrates in a minimally affected river in South Africa. Chem Ecol. 2017;33(1):18-33. https://doi.org/10.1080/02757540.2016.1261121 [ Links ]
19. Been TH, Schomaker CH. Distribution patterns and sampling. In: Perry RN, Moens M, editors. Plant nematology. Wallingford: CAB International; 2013. p. 331-358. [ Links ]
20. FSSA. Bemestingshandleiding [Fertiliser manual]. Pretoria: Die Misstofvereniging van Suid-Afrika; 2002. Afrikaans. [ Links ]
21. Rhoades JD, Chanduci F, Lesch S. Soil salinity assessment: Methods and interpretation of electrical conductivity measurements. Rome: Food and Agriculture Organization of the United Nations; 1999. [ Links ]
22. Doolittle JA. Non-invasive geophysical methods used in soil science. In: Huang PM, Li Y Sumner ME, editors. Handbook of soil sciences: Properties and processes. Boca Raton, FL: CRC Press; 2011. [ Links ]
23. Marais M, Swart A, Fourie H, Berry SD, Knoetze R, Malan AP. Techniques and procedures. In: Fourie H, Spaull VW, Jones RK, Daneel MS, De Waele D, editors. Nematology in South Africa: A view from the 21st century. Cham: Springer; 2017. p. 73-118. [ Links ]
24. Ferris H, Bongers T. Indices developed specifically for analysis of nematode assemblages. In: Wilson MJ, Kakouli-Duarte T, editors. Nematodes as environmental indicators. Wallingford: CABI Publishing; 2009. p. 124-145. [ Links ]
25. Sieriebriennikov B, Ferris H, De Goede R. NINJA: An automated calculation system for nematode-based biological monitoring. Eur J Soil Biol. 2014;61:90-93. https://doi.org/10.1016/j.ejsobi.2014.02.004 [ Links ]
26. Neher DA, Darby BJ. General community indices that can be used for analysis of nematode assemblages. In: Wilson M, Kakouli-Duarte T, editors. Nematodes as environmental indicators. Wallingford: CABI Publishing; 2009. p. 107-123. [ Links ]
27. Bender SF, Wagg C, Van der Heijden MG. An underground revolution: Biodiversity and soil ecological engineering for agricultural sustainability. Trends Ecol Evol. 2016;31(6):440-452. https://doi.org/10.1016/j.tree.2016.02.016 [ Links ]
28. South African Department of Water Affairs and Forestry (DWAF). South African water quality guidelines for agricultural use: irrigation. Pretoria: DWAF; 1996. [ Links ]
29. Hägerbäumer A, Höss S, Heininger P, Traunspurger W. Experimental studies with nematodes in ecotoxicology: An overview. J Nematol. 2015;47(1):11-27. [ Links ]
30. ISO10872. Water quality - determination of the toxic effect of sediment and soil samples on growth, fertility and reproduction of Caenorhabditis elegans (Nematoda). Geneva: International Organization for Standardization; 2010. [ Links ]
31. South African Department of Water Affairs and Forestry (DWAF). South African water quality guidelines: Aquatic ecosystems. Pretoria: DWAF; 1996. [ Links ]
32. Piva F, Ciaprini F, Onorati F, Benedetti M, Fattorini D, Ausili A, et al. Assessing sediment hazard through a weight of evidence approach with bioindicator organisms: A practical model to elaborate data from sediment chemistry, bioavailability, biomarkers and ecotoxicological bioassays. Chemosphere. 2011;83(4):475-485. https://doi.org/10.1016/j.chemosphere.2010.12.064 [ Links ]
33. Li X, Wang M, Chen W, Uwizeyimana H. Ecological risk assessment of polymetallic sites using weight of evidence approach. Ecotoxicol Environ Saf. 2018;154:255-262. https://doi.org/10.1016/j.ecoenv.2018.02.047 [ Links ]
34. Höss S, Jänsch S, Moser T, Junker T, Römbke J. Assessing the toxicity of contaminated soils using the nematode Caenorhabditis elegans as test organism. Ecotoxicol Environ Saf. 2009;72(7):1811-1818. https://doi.org/10.1016/j.ecoenv.2009.07.003 [ Links ]
35. Höss S, Williams P Ecotoxicity testing with nematodes. In: Wilson MJ, Kakouli-Duarte T, editors. Nematodes as environmental indicators. Wallingford: CABI Publishing; 2009. p. 208-224. [ Links ]
36. Hunt PR. The C. elegans model in toxicity testing. J Appl Toxicol. 2017;37(1):50-59. https://doi.org/10.1002/jat.3357 [ Links ]
37. Alvarez A, Jager T, Kooijman SA, Kammenga JE. Responses to stress of Caenorhabditis elegans populations with different reproductive strategies. Funct Ecol. 2005;19(4):656-664. https://doi.org/10.1111/j.1365-2435.2005.01012.x [ Links ]
38. Rath KM, Maheshwari A, Bengtson P, Rousk J. Comparative toxicities of salts on microbial processes in soil. Appl Environ Microbiol. 2016;82(7):2012-2020. https://doi.org/10.1128/AEM.04052-15 [ Links ]
39. Yuan B-C, Li Z-Z, Liu H, Gao M, Zhang Y-Y Microbial biomass and activity in salt affected soils under arid conditions. Appl Soil Ecol. 2007;35(2):319-328. https://doi.org/10.1016/j.apsoil.2006.07.004 [ Links ]
40. Salamún P Kucanová E, Brázová T, Miklisová D, Renco M, Hanzelová V. Diversity and food web structure of nematode communities under high soil salinity and alkaline pH. Ecotoxicology. 2014;23(8):1367-1376. https://doi.org/10.1007/s10646-014-1278-7 [ Links ]
41. Gruzdeva L, Matveeva E, Kovalenko T. Changes in soil nematode communities under the impact of fertilizers. Eurasian Soil Sci. 2007;40(6):681-693. https://doi.org/10.1134/S106422930 [ Links ]
42. Liang W, Lou Y Li Q, Zhong S, Zhang X, Wang J. Nematode faunal response to long-term application of nitrogen fertilizer and organic manure in Northeast China. Soil Biol Biochem. 2009;41(5):883-890. https://doi.org/10.1016/j.soilbio.2008.06.018 [ Links ]
43. Hu J, Chen G, Hassan WM, Chen H, Li J, Du G. Fertilization influences the nematode community through changing the plant community in the Tibetan Plateau. Eur J Soil Biol. 2017;78:7-16. https://doi.org/10.1016/j.ejsobi.2016.11.001 [ Links ]
44. Mesman M, Schouten AJ, Rutgers M. Handreiking TRIADE: locatiespecifiek ecologisch onderzoek in stap drie van het saneringscriterium [Guideline TRIADE: Location-specific ecological research in step three of the remediation criterion]. Bilthoven: RIVM; 2011. Dutch. [ Links ]
45. Ferris H, Bongers T, De Goede RGM. A framework for soil food web diagnostics: Extension of the nematode faunal analysis concept. Appl Soil Ecol. 2001;18(1):13-29. https://doi.org/10.1016/S0929-1393(01)00152-4 [ Links ]
46. Sánchez-Moreno S, Cano M, López-Pérez A, Benayas JMR. Microfaunal soil food webs in Mediterranean semi-arid agroecosystems. Does organic management improve soil health? Appl Soil Ecol. 2018;125:138-147. https://doi.org/10.1016/j.apsoil.2017.12.020 [ Links ]
47. Zhong S, Zeng HC, Jin ZQ. Influences of different tillage and residue management systems on soil nematode community composition and diversity in the tropics. Soil Biol Biochem. 2017;107:234-243. https://doi.org/10.1016/j.soilbio.2017.01.007 [ Links ]
48. Sarathchandra SU, Ghani A, Yeates GW, Burch G, Cox NR. Effect of nitrogen and phosphate fertilisers on microbial and nematode diversity in pasture soils. Soil Biol Biochem. 2001;33(7):953-964. https://doi.org/10.1016/S0038-0717(00)00245-5 [ Links ]
 Correspondence:
Gerhard du Preez
Email: gerhard.dupreez@nwu.ac.za
Received: 04 May 2020
Revised: 16 Dec. 2020
Accepted: 18 Jan. 2021
Published: 29 July 2021
Editor: Yali Woyessa
Funding: None
Supplementary Data
The supplementary data is available in pdf: [Supplementary data]

