


Services on Demand
Article
 English (pdf)
 Article in xml format
 Article references
Indicators

Related links
-
 Cited by Google
 -
 Similars in Google
Share

 Permalink
South African Journal of Science
On-line version ISSN 1996-7489
Print version ISSN 0038-2353
S. Afr. j. sci. vol.117 n.5-6 Pretoria May./Jun. 2021
http://dx.doi.org/10.17159/sajs.2021/8806
RESEARCH LETTER
Monitoring changes in South Africa's surface water extent for reporting Sustainable Development Goal sub-indicator 6.6.1.a
Heidi van DeventerI, II
ICouncil for Scientific and Industrial Research, Pretoria, South Africa
IIDepartment of Geography, GeoInformatics and Meteorology, University of Pretoria, Pretoria, South Africa
ABSTRACT
For the first progress reporting on the Sustainable Development Goal sub-indicator 6.6.1a in 2020, the South African and global statistics related to wetlands were compared. Firstly, in terms of the total wetland extent, the South African National Wetland Map version 5 (NWM5) represented 87% more inland, surface aquatic ecosystems than the Global Surface Water (GSW) product. More than half of the lacustrine systems and none of the palustrine and arid systems in NWM5 are represented in the GSW layer. Secondly, in terms of changes in the extent of wetlands, both the global and South African statistics showed a decreasing trend in the spatial extent of surface aquatic ecosystems in South Africa. These trends should be further investigated against systematic assessments of decadal drought periods. The hydroperiod information (permanent, seasonal and ephemeral inundation periods) of the GSW products show that South African lacustrine wetlands do not have a single dominant class (>70% of the extent of a polygon) of inundation, but consist of a mosaic of these classes.
SIGNIFICANCE:
• The South African National Wetlands Map version 5 represents 87% more of the extent of lacustrine, palustrine and arid wetlands than the Global Surface Water products that are used for progress reporting on the Sustainable Development Goal sub-indicator 6.6.1a.
• South African and global statistics suggest a decline in the extent of lacustrine wetlands, although a systematic comparison with decadal drought periods is required to confirm these trends.
• South African lacustrine wetlands consist of a mosaic of hydroperiod classes (permanent, seasonal and ephemeral inundation periods) with no individual class dominating (>70% of the extent of) wetlands polygons.
Keywords: SDG 6, wetlands, remote sensing, lacustrine wetlands, hydroperiod
Aquatic ecosystems play a pivotal role in water provision, but globally these systems are impacted and at the brink of collapse.1 Monitoring ecosystem changes in surface aquatic systems using remote sensing is critical to facilitate urgent intervention strategies to safeguard these vulnerable and threatened ecosystems. Space-borne satellite images now enable monitoring at scales ranging from landscape to global.
Seventeen Sustainable Development Goals (SDGs) were adopted in 2015 by member states of the United Nations and 2020 was the first year of reporting progress on the targets identified. In terms of aquatic ecosystems, SDG target 6.6 states: 'By 2020, protect and restore water-related ecosystems, including mountains, forests, wetlands, rivers, aquifers and lakes'. Global statistics derived from the Global Surface Water (GSW) products2 were released to assist each country in reporting sub-indicator SDG 6.6.1a, which pertains to the spatial extent of surface aquatic ecosystems. In 2019, South Africa released the latest National Biodiversity Assessment of 2018, which included updates to the National Wetland Map version 5 (NWM5) and artificial wetlands spatial data layers.3 These data sets provide a new opportunity for comparing the spatial extent of surface aquatic ecosystems between the different data sets. In addition, other GSW products are also considered for characterising the hydroperiod of South African wetlands.
SDG target 6.6. has only one indicator (6.6.1): 'Change in the extent of water-related ecosystems over time'.4 Aquatic ecosystems included for this target are 'wetlands, lakes, estuaries, artificial ecosystems (dams), rivers and aquifers'. Indicator 6.6.1 aggregates three of the sub-indicators, namely change in (a) spatial extent, (b) water quality and (c) water quantity, while a fourth sub-indicator, related to the ecological condition of ecosystems, is reported separately. Two tiers of reporting are facilitated. Tier 1 uses globally available data from remote sensing derivatives and countries can validate these quantities against their own methods and/or data sets. Tier 2 allows for countries to report their own statistics for the sub-indicators of SDG 6.6.1.
To facilitate Tier 1 reporting for the spatial extent of aquatic ecosystems (sub-indicator 6.6.1.a), the United Nations extracted data from recent GSW products which quantify the total extent and changes in the spatial extent of surface aquatic ecosystems. The GSW products were derived from Landsat images since 16 March 1984, and more recently Sentinel-2 images after 10 October 2015.2 The Freshwater Ecosystems Explorer application (www.sdg661.app) enables countries to view or download data for reporting.
The average extent of inundation between the years 2000 and 2004 was taken as the reference against which changes in the extent of surface water is measured for 6.6.1.a. These years were mainly drought free, i.e. they did not include a 60-month or 24-month decadal drought, with the exception of 2004, in which an intense summer drought affected 26% of the summer-rainfall region that covers about 90% of the areal extent of the country.5
The Freshwater Ecosystem Explorer statistics report 6144 km2 of wetlands for South Africa (Table 1). The statistics show that, since the reference period, permanent water reduced by nearly 20% while seasonal water increased by 32%. In addition, the minimum water extent of reservoirs (artificial) decreased by 25%, whereas the maximum water extent of reservoirs decreased by only 11%. These results suggest that South Africa may not yet have recovered from the 2015/2016 drought. However, no systematic assessment of the severity and geographic extent of this drought is yet available for the whole of South Africa, which would be necessary for comparing these to other decadal droughts described in Malherbe et al.5
The total spatial extent of surface aquatic ecosystems as reported for the SDG 6.6.1.a sub-indicator was compared to three data sets of South Africa (Table 1). Three research groups have mapped surface aquatic systems using various data sources, for different purposes, categories and intended uses.3,6,7 Using NWM5 and the artificial wetlands layer yielded the largest spatial extent of wetlands, with a total of nearly 44 000 km2.3 These inland wetlands, and the extent of some of the rivers, include permanently and seasonally inundated (lacustrine), vegetated (palustrine), arid (with no dominant inundation or vegetation cover) and artificial systems/ water bodies. Van Deventer et al.3 report extensive omission errors in aquatic ecosystems, with 76% of the national extent mapped at a low confidence. The statistics used for reporting on the SDG 6.6.1.a sub-indicator therefore underreport the spatial extent of inland wetlands by at least 87% of those mapped in NWM5 and the artificial wetland layers. Note that the GSW products do not include palustrine and arid systems at all, while these are included NWM5, in addition to the lacustrine systems.
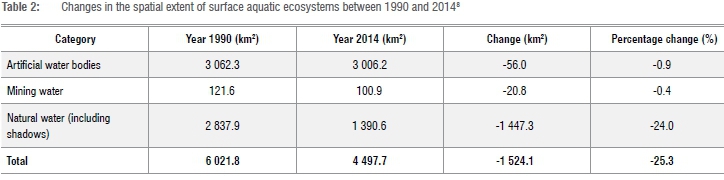
The South African 2013/2014 land cover data6 have been used to track changes against a historical reference point of 1990 (Table 2)8. The year 1990 is a suitable reference, because it was just before the 19911995 decadal drought.5 In the comparative study, three categories of water are reported to have reduced between 1990 and 2014, including a loss of nearly 1% of artificial water bodies, 0.5% mining water and 24% natural water (Table 2). The report notes, however, that the data derived from remote sensing products may include some shadows erroneously classified as wetlands. Despite the errors noted for both the GSW and land cover products, both studies observed a decrease in the spatial extent of surface aquatic ecosystems over the past 20-30 years. These general trends should be further investigated through a systematic assessment of the decadal drought cycles5, and for specific regions to evaluate whether they relate to the natural variation in rainfall or to climate change trends associated with increasing temperatures and evapotranspiration.
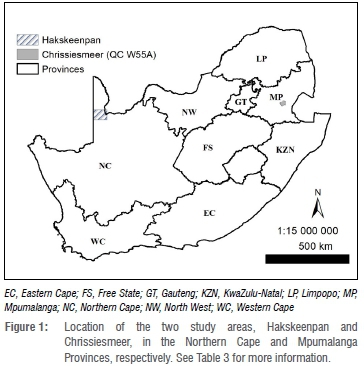
The Global Surface Water Explorer (GSWE, https://global-surface-water.appspot.com/) enables the viewing and download of several data layers (at 30 m spatial resolution) related to the spatial extent of inundation (Table 3, Figure 1). The transition data layer was used to investigate the three different hydroperiod classifications of permanently, seasonally and ephemerally inundated systems. The tiles were merged into a single raster using ArcGIS 10.69, and statistics were calculated (Tabulate Area) for each polygon of the inland wetlands and rivers of NWM5. In total, 19 551 polygons (12%) of the 157 728 inland wetlands and rivers have signatures of inundation according to the GSW transition data layer (Table 4). This totals 1359.1 km2 of inland wetlands, which is about half of the 2787.2 km2 of the lacustrine systems identified using the 2013/2014 National Land Cover data7 for NWM5.3 On average, the majority of inland wetlands and rivers showed that no more than 22% of their spatial extents are inundated, with the exception of depressions, which had an average of 29% of their extents inundated.
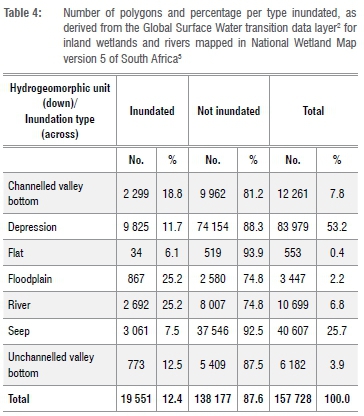
Fewer than 1% of the number of inland wetlands and river polygons in NWM5 had an extent of >70% of polygon in any one of the three hydroperiod classes of the GSW transition product. Consequently, a new approach for assigning hydroperiod to a single wetland unit needs to be investigated.
The author provided information to the South African Department of Water and Sanitation concerning the reference period and the underrepresentation of wetlands in the global data sets relative to NWM5, as described in this article. The Department's SDG team incorporated this information in their Response to the United Nations Environment Programme 2020 data drive.10
Acknowledgements
This work was funded by the Council for Scientific and Industrial Research (CSIR). I am grateful to my colleague, Steven Weerts, who provided proofreading and editing. Thank you to the external reviewers whose suggestions offered improvement to the manuscript.
Competing interests
There are no competing interests to declare.
References
1. Díaz S, Settele J, Brondízio ES, Ngo HT, Guèze M, Agard J, et al., editors. Intergovernmental Science-Policy Platform on Biodiversity and Ecosystem Services (IPBES) summary for policymakers of the Global Assessment Report on Biodiversity and Ecosystem Services of the Intergovernmental Science-Policy Platform on Biodiversity and Ecosystem Services. Bonn: IPBES; 2019. https://doi.org/10.5281/zenodo.3553579 [ Links ]
2. Pekel J-F, Cottam A, Gorelick N, Belward AS. High-resolution mapping of global surface water and its long-term changes. Nature. 2016;540:418-422. https://doi.org/10.1038/nature20584 [ Links ]
3. Van Deventer H, Van Niekerk L, Adams J, Dinala MK, Gangat R, Lamberth SJ, et al. National Wetland Map 5 - An improved spatial extent and representation of inland aquatic and estuarine ecosystems in South Africa. Water SA. 2020;46(1):66-79. https://doi.org/10.17159/wsa/2020.v46.i1.7887 [ Links ]
4. United Nations (UN). Integrated Monitoring Guide for SDG 6: Step-by-step monitoring methodology for indicator 6.6.1 on water-related ecosystems Version 20 [document on the Internet]. c2017 [cited 2021 Feb 02]. Available from: http://www.unwater.org/app/uploads/2017/05/Step-by-step-methodology-6-6-1_Revision-2017-01-20_Final-1.pdf [ Links ]
5. Malherbe J, Dieppois B, Maluleke P Van Staden M, Pillay DL. South African droughts and decadal variability. Nat Hazards. 2016;80(1):657-681. https://doi.org/10.1007/s11069-015-1989-y [ Links ]
6. GeoTerraImage Pty Ltd (GTI) 2013-2014 South African National Land-Cover Dataset. Pretoria, South Africa: GTI; 2015. [ Links ]
7. Department of Rural Development and Land Reform: National Geo-Information (DRDLR:NGI). Provincial geodatabases of hydrological databases exported from GeoMedia in March 2016. Cape Town: DRDLR:NGI; 2016. [ Links ]
8. GeoTerraImage Pty Ltd (GTI). South Africa land cover water feature splits (1990-2013/14). Data users report and meta data (Version 2). Pretoria: GTI; 2016. [ Links ]
9. Environmental Systems Research Institute (ESRI). ArcGIS desktop 10.6. Redlands, CA: ESRI; 1999-2017. [ Links ]
10. South African Department of Water and Sanitation (DWS). Sustainable Development Goal 6: 2020 data drive. South African response to the United Nations Environment Programme. Pretoria: DWS; 2020. Available from: https://www.dws.gov.za/projects/sdg/Water%20related%20Indicator%20Reports.aspx [ Links ]
 Correspondence:
Heidi van Deventer
Email: HvDeventer@csir.co.za
Received: 19 Aug. 2020
Revised: 02 Feb. 2021
Accepted: 03 Feb. 2021
Published: 28 May 2021
Editor: Yali Woyessa
Funding: Council for Scientific and Industrial Research (South Africa)

