


Servicios Personalizados
Articulo
 Inglés (pdf)
 Articulo en XML
 Referencias del artículo
Indicadores

Links relacionados
-
 Citado por Google
 -
 Similares en Google
Compartir

 Permalink
South African Journal of Science
versión On-line ISSN 1996-7489
versión impresa ISSN 0038-2353
S. Afr. j. sci. vol.117 no.5-6 Pretoria may./jun. 2021
http://dx.doi.org/10.17159/sajs.2021/8630
RESEARCH ARTICLE
The urban water metabolism of Cape Town: Towards becoming a water sensitive city
J. Ffion AtkinsI; Tyrel FlügelII, III; Rui HugmanII
IDepartment of Environmental and Geographical Sciences, University of Cape Town, Cape Town, South Africa
IIUmvoto Africa (Pty) Ltd, Cape Town, South Africa
IIIDepartment of Geography and Environmental Studies, Stellenbosch University, Stellenbosch, South Africa
ABSTRACT
To improve its resilience to increasing climatic uncertainty, the City of Cape Town (the City) aims to become a water sensitive city by 2040. To undertake this challenge, a means to measure progress is needed that quantifies the urban water systems at a scale that enables a whole-of-system approach to water management. Using an urban water metabolism framework, we (1) provide a first city-scale quantification of the urban water cycle integrating its natural and anthropogenic flows, and (2) assess alternative water sources (indicated in the New Water Programme) and whether they support the City towards becoming water sensitive. We employ a spatially explicit method with particular consideration to apply this analysis to other African or Global South cities. At the time of study, centralised potable water demand by the City amounted to 325 gigalitres per annum, 99% of which was supplied externally from surface storage, and the remaining ~1% internally from groundwater storage (Atlantis aquifer). Within the City's boundary, runoff, wastewater effluent and groundwater represent significant internal resources which could, in theory, improve supply efficiency and internalisation as well as hydrological performance. For the practical use of alternative resources throughout the urban landscape, spatially explicit insight is required regarding the seasonality of runoff, local groundwater storage capacity and the quality of water as it is conveyed through the complex urban landscape. We suggest further research to develop metrics of urban water resilience and equity, both of which are important in a Global South context.
SIGNIFICANCE:
• This research provides the initial groundwork of quantifying the magnitude of the urban water cycle of the City of Cape Town at an annual timescale, in relation to becoming a water sensitive city. The urban water metabolism framework used in this study provides important insight to assess whole-of-system urban water dynamics and to benchmark progress towards becoming water sensitive. By quantifying the magnitude of flows into and out of the urban system, this research sheds light on the opportunities to improve circularity in the urban water cycle. The spatial approach adopted here provides a platform to interrogate the urban landscape and its role in the urban water cycle. By using data products that are available via national data sets or remote sensing, this approach can be applied to other African or Global South where data is characteristically scarce. Further work is required to establish metrics that can adequately describe urban water resilience and equity.
Keywords: water sensitive cities, performance indicators, urban water management managed aquifer recharge, water equity
Introduction
Current urban water management practices are challenged by climate change, increasing per-capita water demand and growing populations. Already, many cities around the world are vulnerable to water shortages1-3 and it has been suggested that one in six large cities is likely at risk of a significant water deficit by 2 0 504. Recent water crises experienced by Bengaluru (India)5, Los Angeles (USA)3 and Cape Town (South Africa)6-8 highlight potential consequences of failing to account for the future water demands of a city within the context of climate change related stresses.
The City of Cape Town (hereafter the City) is largely dependent upon the surface storage of rainfall from the surrounding catchment areas to supply water to its residential, industrial and commercial users. A severe multi-year drought between 2015 and 2018 highlighted the vulnerability of a growing city being reliant solely on the surface storage of rainfall. Although the event was considered an extremely rare (1 in 300 year) drought9, there is strong evidence for drying and warming of the regional climate systems8 with observed, and modelled, long-term increases in aridity for most of southern Africa9-11. Additionally, reduced precipitation patterns have been observed in other Mediterranean-like climates of the southern hemisphere12,13, strengthening the prediction that severe droughts, like that experienced in 2015-2018, are likely to occur more frequently in the Cape Town region8.
While demand management strategies were highly effective in reducing water consumption by 50% during the 2015-2018 drought14, it is clear that demand management alone will be an insufficient adaptation measure for future climate scenarios. The Water Strategy for Cape Town15, which was published in response to the 2018 water crisis, recognises the need to take a whole-of-system approach and represents a welcome shift in urban water management paradigm and practice. The New Water Programme15 outlines the various planned contributions of alternative sources (groundwater, desalination and water reuse) and interventions such as reducing water demand, clearing alien vegetation and augmenting surface storage. The Water Strategy also highlights the City's commitment to transition to a water sensitive city and the 'optimal use stormwater and urban waterways for the purpose of flood control, aquifer recharge, water reuse and recreation'15. The water crisis faced by the City highlighted the need to be able to consider management interventions in relation to the dynamics of the urban system as a whole, which comprises social-ecological-technical, hydrological and economic components and processes. This research lays the groundwork of quantifying the magnitude of the urban water cycle at an annual timescale in order to contribute to an assessment of the water sensitivity of the City.
Water sensitive cities
A water sensitive city approaches urban water management as a holistic system, gives water due prominence in the design of urban areas and is underpinned by three key pillars16:
1. Cities as supply catchments: access to diverse water sources, both centralised and decentralised.
2. Cities providing ecosystem services: the urban landscapes actively support and supplement the natural environment.
3. Cities comprising water sensitive communities: emphasising the importance of socio-political capital for water sensitive behaviours and decision making.
Quantifying water sensitivity
The initial step for determining a city's degree of water sensitivity is quantifying the rate and direction of flows. This quantification of flows into, within, and out of urban areas is often referred to as urban metabolism17 and is a powerful empirical analysis of the society-nature interaction18. Urban metabolism focuses on quantifying the fluxes of energy, materials and nutrient flows into and out of urban areas19,20 and is readily applied into fields of urban planning and design19. For the most part, the field quantifies flows that are anthropogenically driven (e.g. water and energy consumption) and is only recently gaining traction as a framework to assess urban water cycles21 and performance22-24.
Performance indicators are important in the implementation, assessment and communication of progress towards sustainability goals.22 There are several methods to benchmark the performance of water management, using indicators such as Sustainable Cities Index25, Green Cities Index26, City Blueprint27 and more recently the Water Sensitive Cities Index22. A City Blueprint assessment was done for Cape Town28, evaluating the water governance processes and capacity required to implement water sensitive urban design (WSUD). Their assessment highlighted the shift in governance processes related to water scarcity during the 2018 water crisis and the potential to adopt WSUD through successful implementation of policies such as Management of Urban Stormwater Impacts Policy and the Flood Plain and River Corridor Management Policy. A review of methods used to evaluate urban water performance by Renouf and Kenway24 found that, with the exception of the Water Sensitive Cities Index, evaluation criteria are often misaligned from the visions and objectives of urban water management. At the macroscale (the city as a whole), there is little quantitative assessment to monitor progress towards (and gauge the performance of a city against) its urban water management visions and objectives. Earlier research by Kenway and colleagues21 addressed this void, applying a mass balance analysis of several cities in Australia. They proposed an urban water metabolism framework (UWMF) to quantify and assess the performance of a city, which was also the first attempt to quantify the term 'water sensitive city'. They integrated both the anthropogenic (bulk water supply, wastewater effluent, reuse) and natural hydrological flows (precipitation, evapotranspiration, runoff, groundwater infiltration) into the water mass balance. From this metabolic framework, they derived performance indicators that allowed each city's water management effectiveness to be compared. They argue that quantifying these volumes is the first step towards designing a water sensitive city21, and this also provides a benchmark for measuring progress and comparison between different cities. A method of accurate comparison is important to allow for cities to learn best practices from one another. Together, the metabolic framework and performance indicators provide powerful metrics to guide urban water management and policy along a trajectory towards being water sensitive.
Urban metabolism in Cape Town
Several studies have quantified the fluxes of materials, energy and water into Cape Town (at a city scale) using varying methods such as an ecological footprint assessment29 an economy-wide material flow analysis30; systems analysis31 and urban metabolism32. In terms of mass flux, water comprises the largest component - about 96% of the total material flows into and out of Cape Town29 - a fairly consistent proportion observed in all urban metabolism studies17,21,33. Currie et al.32
conducted a broad assessment of the urban metabolism of Cape Town, quantifying energy, water, people, transport, food and solid waste. For water, they primarily focused on municipal water services, i.e. the anthropogenic flows, and illustrated the average volumes of water per year that flow into and out of the City, compartmentalising these volumes into various sources (the different reservoirs) and pathways (i.e. domestic/commercial/industrial demand) within the City. While their analysis was comprehensive and provides novel insight into the spatial patterns of water consumption, from an urban water cycle perspective they did not include hydrological flows or alternative water supply (i.e. reuse, desalination, groundwater or runoff). An earlier study by Ahjum and Stewart31 aimed to assess the energy costs associated with the various demand and alternative (municipal) supply scenarios. They quantified parts of the urban water cycle from a systems perspective, did include groundwater supply (and recharge), and omitted all other components of the hydrological cycle (e.g. rainfall, runoff). Thus there exists a gap in the quantification of how the various flows into/within and out of the City are integrated and in some cases interdependent.
This research builds on such existing work but integrates the anthropogenic and hydrological components into one framework. It aims to contribute to the growing inventory of urban water metabolism within the context of holistic urban water management and the commitment to becoming a water sensitive city. The choice of spatially appropriate methods employed in this study is considered in terms of their applicability to other African and Global South cities, where data of the urban environment (e.g. stormwater runoff rates) are often scarce34,35. Using the UWMF proposed by Renouf et al.24, we assess whether the interventions proposed in the New Water Programme14 support the City towards becoming water sensitive. The particular objectives of this research are to (1) conduct a water mass balance analysis for the City of Cape Town, using available spatial data products (e.g. mean annual precipitation, landcover, evapotranspiration), keeping in mind scalability and comparability across cities, (2) assess performance of the urban water cycle in relation to the principles of water sensitivity, and (3) assess performance of the urban water cycle under the New Water Programme.
Methods
The urban water cycle of Cape Town was quantified as a mean annual average and was assessed in the context of a water sensitive city under a 'normal' non-drought scenario and under the New Water Programme. In brief, the steps taken were to:
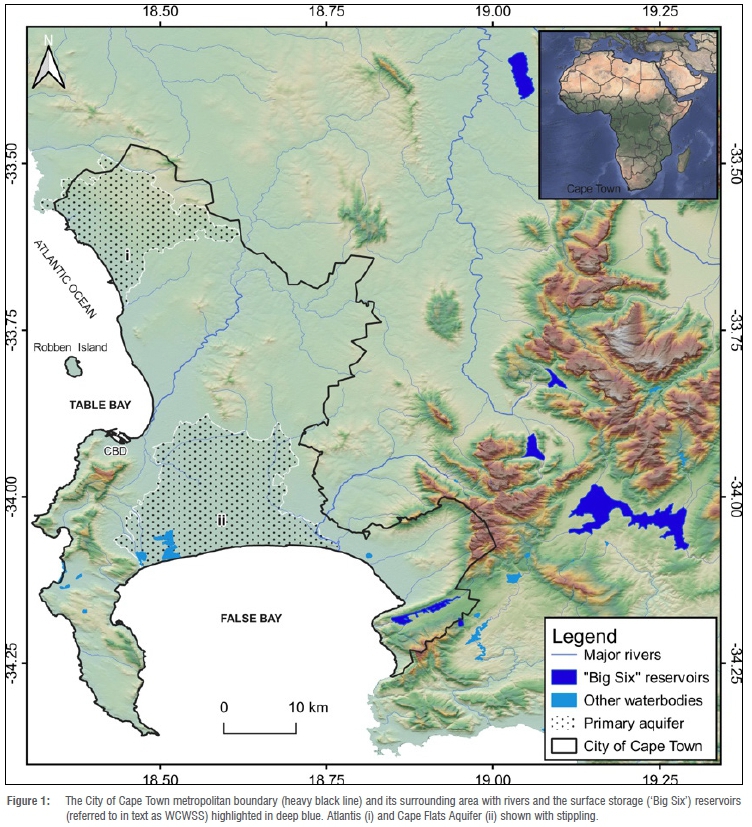
1. Define the system boundary (Figure 1) and quantify all parameters of the urban water cycle (Figure 2), both anthropogenic and hydrological flows.
2. Conduct mass balance analyses (Equation 1 and Table 1) of the urban water cycle in a non-drought 'normal' scenario (Figure 2a) and under the New Water Programme (Figure 2b).

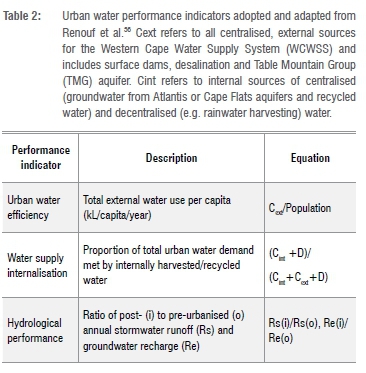
3. Assess the water sensitive performance of the urban water cycle (Table 2) using indicators stipulated in Renouf et al.36
4. Test and compare the performance of a hypothetical water cycle under the proposed New Water Programme.
System boundary
The system is defined as the City of Cape Town Metropole (Figure 1). Within the metropolitan boundary there are two primary aquifers (Cape Flats and Atlantis) and secondary aquifers (Table Mountain Group, TMG). The primary sand aquifers are found directly below the urban (Cape Flats Aquifer) and peri-urban (Atlantis) environments, and are a direct part of the urban hydrological cycle. Furthermore, they are a source for centralised and decentralised water supply, as well as subject to managed aquifer recharge (MAR) from treated wastewater and stormwater runoff. Although there are TMG aquifers within the urban boundary (i.e. Table Mountain itself), in this paper, we did not consider TMG as a source of groundwater supply within the City. References to TMG are in regard to aquifers beyond the metropolitan boundary (surrounding Steenbras) and are thus considered inputs into the system rather than internal flows.
Mass balance
The urban water cycle comprises anthropogenic and hydrological flows of water into, within and out of the city (Figure 2). Anthropogenic flows represent the volumes of water consumed and discharged by the urban areas serviced by the City with the point of entry as the water treatment plants and point of exit as the wastewater treatment works (WWTW). Hydrological flows represent precipitation, runoff, and groundwater recharge that occur within the defined system boundary, as well as surface and groundwater discharge out of the system into the ocean. Water that flows into the urban system via rivers and aquifers is not accounted for, as it is considered environmental flow, as per Renouf et al.36 Decentralised groundwater abstraction and non-potable reuse are assumed here to be their own separate outputs for convenience sake, but as these rates may increase in the future, they could equally be considered to leave the system as evapotranspiration or groundwater discharge.
The water mass balance assumes a steady state and follows Equation 1:
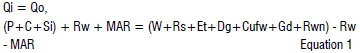
where Qi is the sum of all inputs and Qo is the sum of all outputs (including losses). Inputs consist of centralised bulk water supply (C) which comprises surface supply (Cs), desalination (Cd), TMG aquifer (Cg), precipitation (P) and surface water inflow (Si). Outputs consist of wastewater effluent (W), runoff (Rs), groundwater abstraction (Dg), groundwater discharge (Gd), non-potable reuse (Rwn) and losses (Cufw).
Water recycling terms (Rw and MAR) refer to potable reuse (as per the New Water Programme) and managed aquifer recharge (MAR) and are included as both Q and Qo, but are subtracted from outputs.
Estimating flows
Anthropogenic flows
Monthly flow data for bulk water supply and wastewater effluent were obtained from the City. Annual averages of both were calculated, using the data available for the time period between 2008 and 2012. Recycled water volumes were sourced from the City of Cape Town.14 The Western Cape Water Supply System (WCWSS) gets its water from six major rainfed dams that supply the City of Cape Town (~64%), agriculture (~29%) and other municipalities in the region (~7%).14 In this study we focus solely on the City of Cape Town and its use of WCWSS water. We omit water use of WCWSS water by other municipalities and agriculture owing to paucity of reliable data, but acknowledge this use merits further research. We do include the peri-urban agricultural area as it constitutes significant decentralised groundwater abstraction within the City's boundary. Virtual water and other forms of imported and exported water (e.g. imported in food and bottles) have not been included in this analysis but also merit future investigation.
Groundwater abstraction rates, both centralised and decentralised, were assumed to be the maximum permitted allowance, as stipulated in the water use licence. For decentralised abstractions, the allowed abstraction rate (7.6 GL/year) refers to the Philippi Horticultural Area -an urban farming locale within the city boundaries. Although considered agricultural use, these abstraction rates have been included owing to the direct use of the Cape Flats Aquifer which is an important decentralised supply relevant to this research. Private/residential abstraction rates are omitted from this study owing to paucity of data, although are expected to have increased during and since the drought (2015-2017). Centralised abstraction and MAR rates were assumed to be the maximum allowable rate as stipulated in the water use licence under the New Water Programme for the City.
Hydrological flows
We aimed to use spatial products that were readily available and locally relevant. A mean annual precipitation map was obtained from South African Water Resources Geographic Information System book of maps.38 A mean annual evapotranspiration map was generated by Schulze et al.39, using the FAO Penman-Monteith method40, and was based on daily maximum and minimum temperatures, on a 1.7x1.7 km grid for 50 years, and empirically determined month-by-month gridded values of actual vapour pressure and daily gridded values of solar radiation. Runoff was calculated as per the rational method using runoff coefficients according to SANRAL41, taking into consideration soil type, slope and land use (Supplementary tables 1-3). Several other methods to calculate runoff were explored and compared; these are detailed in the supplementary material. The values of hydrological parameters presented in the analysis represent the sum of all pixels within the metropolitan boundary. We acknowledge the potential for uncertainties associated with these spatial products to propagate error through to the final assessment of the City's performance and thus tested the sensitivity of performance indicators to these hydrological parameters, which is detailed in Supplementary table 7.
All flows were then visualised using a Sankey diagram which was constructed with the help of Python code published by Lupton and Allwood42.
Performance indicators
Performance indicators for urban water efficiency, water supply internalisation and hydrological performance were calculated following Renouf et al.24,36 (Table 2). Renouf et al.24,36 also include more indicators such as water-related energy efficiency and nutrient-related water efficiency, but owing to the paucity of necessary data for a robust assessment of such indicators, we have focused on the three aforementioned. Calculation of hydrological performance required estimating annual stormwater runoff and groundwater recharge in a pre-urbanised, or historical, environment. Historical runoff estimates were calculated following the same method for present day runoff except the urbanised areas were replaced by the South African National Vegetation map (City of Cape Town Open Data Portal). Details of runoff coefficient classifications are in Supplementary table 4.
Scenario assessment
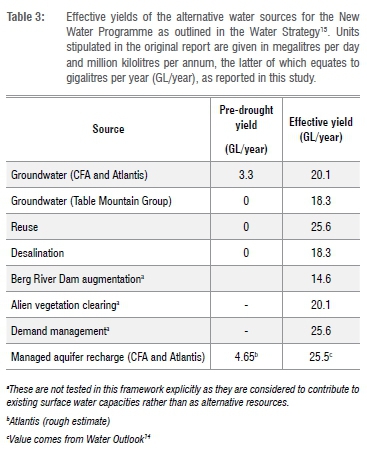
Two separate urban water cycles were quantified: the cycle which is considered 'normal' or non-drought (2008-2012) (Figure 2a) and is hereafter referred to as Scenario 1; and the cycle under the scenario of the New Water Programme (Figure 2b and Table 1), hereafter referred to as Scenario 2. For the New Water Programme, effective yields of the alternative water sources were derived from the Water Strategy15 and are detailed in Table 3. In this water cycle, supply/demand remain as they are for Scenario 1 in order to assess the impact of the alternative supply interventions on the water cycle as a whole.
Results and discussion
Mass balance
All data were collated into a mass balance analysis using Equation 1 and are summarised in Table 4 and Figure 3. In Scenario 1, total inputs equate to 1796 GL/year comprising precipitation and bulk water supply; total outputs equate to 1471 GL/year comprising wastewater effluent, runoff, evaporation, groundwater discharge, decentralised groundwater abstraction, recycled water and accounted for losses; and internal flows amount to 745 GL/year as groundwater recharge and abstraction. In Scenario 2, total inputs are reduced to 1754 GL/year where bulk water supply is divided into surface water, centralised groundwater abstraction and centralised desalination; internal flows are increased to 803 GL/year to include centralised groundwater abstraction from the internal primary aquifers, water recycling for potable use and MAR; outputs marginally decreased to 1709 GL/year, mostly reflected in reduced wastewater effluent discharge and reduced groundwater discharge.
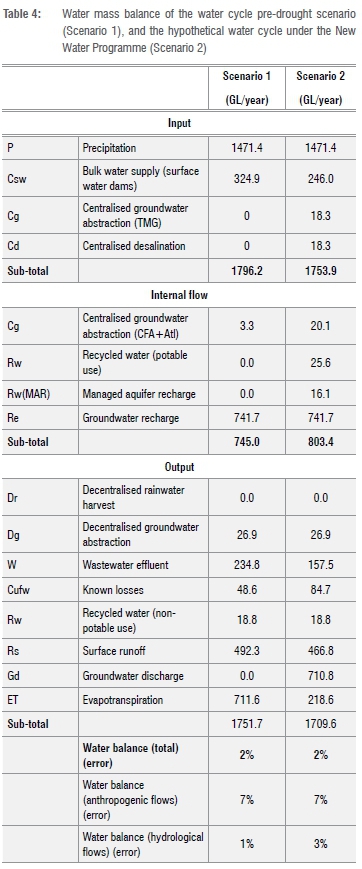
Assuming long-term averages are in equilibrium, inputs should equate to outputs, and thus we find a 2% error in the water cycle as a whole for both scenarios. As divided into anthropogenic and natural flows, 7% and 3% errors are found respectively. With regard to the 7% error in anthropogenic flows, we propose that it is a result of unaccounted for losses from the system. Bulk water supply (325 GL/year) far exceeded effluent released from WWTW (235 GL/year), representing a 27% loss from the system, as measured from points of entry via water treatment plants to the points of exit (WWTW). On average, the City reports ~15% loss between the water treatment plant and consumers (water that is sold); the remainder is loss between the consumer and WWTW discharge (including irrigation of gardens, pools, leaking sewers, and loss from the WWTW itself). Known losses (up to ~15%) are described in Figure 3 as 'loss', and what is unknown is described as 'Unaccounted for', in order to achieve conservation of mass within the analysis. The simplification of household behaviour and losses between consumers and the WWTW (mentioned in the methods section) has a considerable impact on macroscale dynamics and merits further, more detailed investigation. The 3% error in hydrological flows likely represents inaccuracies that exist in the spatial data and methods used to estimate natural flows, and are evaluated in the following section.
Estimating hydrological flows
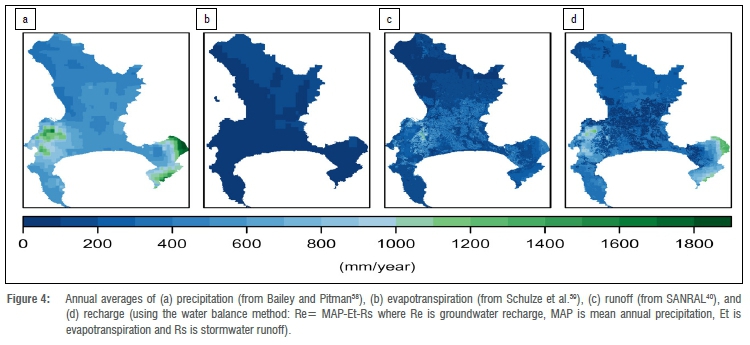
The total volume of rainfall within the City boundary is 1471.4 GL/year, equating to an average of 605 mm/year. Of this, an average of 219 GL/ year is lost to evapotranspiration, 492 GL/year to runoff and 742 GL/year to recharge (Table 4 and Figure 4). These respectively equate to spatial averages of 15%, 33% and 50% of total rainfall. The spatial distribution of each hydrological flow is inherently heterogeneous (Figure 4), where spatial estimates of evapotranspiration vary spatially between 0 and 30% of precipitation, runoff varies between 17% and 96%, and recharge between 0 and 83% (Supplementary figure 2).
Several methods were used to calculate runoff rates, resulting in wide variation in estimates of runoff (see Supplementary figure 1). A comparison was made between all runoff estimates of this study and a stormwater runoff model of the Zeekoevlei catchment using the software PCSWMM.43 An average runoff estimate using PCSWMM was 187.6 mm/year43 and our estimates ranged between 191 mm/year and 277 mm/year for the same catchment area. All runoff estimates of this study were marginally higher than estimates by Okedi43, likely representing storm conditions, but all estimates were within a reasonable range. Using the coefficients from SANRAL40 did result in the highest runoff value (277 mm/year) for the Zeekoevlei catchment, but using these coefficients also gave recharge values that were most consistent with those reported in the literature for the Atlantis aquifer44. Recharge rates in Atlantis were reported to be between 10% and 30.3% of rainfall, with an average of 16%.41(and references therein) The recharge rates calculated in this study are particularly high when compared to the average reported by Jovanovic et al.44 and it is likely that they represent potential rather than effective recharge. If this is the case, evapotranspiration rates41 may be an underestimate. Earlier studies into urban evapotranspiration have observed evapotranspiration to constitute 40-80% of a city's annual water balance losses.45 However, Hobbie et al.46 (see their supplementary material) conducted a water mass balance using recommended coefficients from the Minnesota Stormwater Manual47 and estimated average evapotranspiration in their urban watershed to be 14.5% of precipitation. Their watershed comprised urban (impervious), peri-urban and rural areas, similar to the landcover types found in the urban boundary of this study. Evapotranspiration is inherently patchy within an urban environment and the data product used41 has a resolution of 74 m which may not have captured the full variability. In light of this, we did assess the applicability of using MODIS16A3 product for the years of this study (2008-2012), and we found, for all years, the core urban area to be flagged as 'no data' and thus deemed unusable for spatial calculations of recharge. We assessed the potential for this unavoidable uncertainty in evapotranspiration products to propagate further error into the performance indicators (Supplementary table 7). This highlights both the challenges of working with spatial data in the urban environment and the scope to validate remote sensing products in highly heterogenous contexts.
Estimates of stormwater runoff rates using PCSWMM from more catchments within the urban environment would enable a more statistically robust comparison between methods. However, the generation of such estimates is a time-consuming, data-intensive process and if such estimates do already exist they have not been made available through the City of Cape Town Open Data Portal or formal channels of communication. The benefit of the methods employed in this study are that they are easily applied to landcover data that can be obtained from national (including satellite-derived) data sets that can be applied to many data scarce (namely in situ data) urban areas at multiple scales.
Limitations
We acknowledge several simplifications in the conceptualisation of the urban water cycle, most notably with regard to aggregates of household fluxes. For example, not all water that enters a household enters the sewer system, as some is lost due to gardening/recycling of grey water/ filling of pools and we acknowledge that this may be significant when combined at the city scale and particularly so during drought. We have assumed these pathways to be aggregate losses out of the system between the point of entry (water treatment plant) and exit (WWTW), rather than contributing to, for example, non-potable water recycling or decentralised storage. Future work would investigate these fluxes as aggregate contributions of household behaviour on the macroscale water budget.
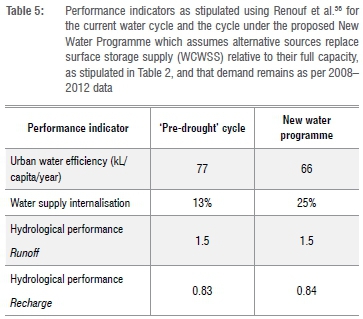
Performance scenario planning
To assess the metabolic performance of the current urban water cycle, performance indicators were calculated following Renouf et al.24,36,48, as presented in Table 5. Pre-drought (2018), 99% of centralised water inputs into the City were supplied from external sources (Cext) via WCWSS, with other decentralised sources such as groundwater and water recycling for potable and non-potable uses. Rainwater harvesting was assumed to be negligible; however, this is likely to have changed due to behavioural changes induced by the 2015-2018 water crisis.
Efficiency
Urban water efficiency is an indicator of the environmental water use of the urban system, expressed as a rate of environmental water withdrawal per inhabitant per year (kL/capita/year).36 The pre-drought per capita water withdrawal from the environment amounts to 77 kL/ capita/year (210 L/capita/day). The environmental water demand calculated by Renouf et al.36 for Australian cities was relatively higher (between 92 and 182 kL/capita/year). With the proposed New Water Programme, per capita environmental water withdrawal decreases to 66 kL/capita/year (183 L/capita/day), reflecting the internalisation of water sources via direct and indirect reuse. When compared to the results of Australian cities, the City is seemingly water efficient. However, this performance indicator is misleading in this context as it assumes that per capita water usage is equal across the population. We posit that this 'efficiency' reflects rather the vast disparities in access to and use of water in Cape Town.29,32,49 The 2011 Census estimates reported that 96.6% of households in Cape Town have piped access to water (via a public tap) within 200 m from home, and 87% of households have piped water within their dwelling or yard.32,50 However, this access varies considerably across the City51 - for example, only 50% of households in Site C Khayelitsha have piped water inside their dwelling or yard50. Per capita usage in areas where access to water is solely via a public tap will be considerably lower than in more affluent areas.
The water reuse scheme, which is intended to increase from 18 GL/ year to 43 GL/year, is one approach to improving the efficiency of the urban system but still remains a small contribution (~12%) to water supply. Representing urban water efficiency spatially would highlight the disparities in efficiency (i.e. high-end and low-end users) that a bulk (average) quantification cannot. By disaggregating water efficiencies spatially, urban planners and decision-makers would be better informed as to where to focus policy and funding.
Supply internalisation
The New Water Programme is designed to augment supply capacity into the City. Most of the designated augmented supplies come from outside the urban boundary as desalination, surface supply (Voëlvlei Dam) or TMG aquifer. Currently, supply internalisation is 13%, where internal sources comprise groundwater (8%) and recycled water (5%). With the New Water Programme, supply internalisation could increase up to 25%, assuming that water reuse schemes as well as MAR (including groundwater abstraction) contribute their full capacity (see Table 2).
Further, improving supply internalisation would entail adopting a fit-for-purpose approach52, by diversifying supply and reducing reliance on external sources of water for potable use. The contributions of greywater systems, rainwater harvesting, larger-scale stormwater harvesting and the use of groundwater for hospitals/irrigation of school fields and parks have not been accounted for here due to a paucity of data. As they become more significant and more established components of the system, they will merit inclusion in further studies.
Hydrological performance
The hydrological performance is an indicator of the degree to which natural hydrological flows have increased or decreased relative to pre-urbanised flows36, and is a ratio of post- to pre-urbanised annual flows. A ratio of greater than 1 means that the magnitude of the annual flow is larger than that of the pre-developed landscape, and a ratio of less than 1 means it is smaller. Currently, runoff is at a ratio of 1.5 and recharge at 0.83; effectively, runoff is greater than for pre-developed landscapes and recharge is smaller due to the increase in impervious services. With the New Water Programme, runoff does not change, but recharge increases marginally to 0.84, reflecting the volumes of water redirected from WWTW effluent to MAR (Figure 3). The sensitivity of hydrological performance of recharge to evapotranspiration was assessed by varying evapotranspiration by an arbitrary ±10% (Supplementary table 7). Results show a mean hydrological performance recharge of 0.83 (±0.02), indicating that this indicator is not sensitive to uncertainty in the evapotranspiration data.
Practicality of using alternative sources
Assessing the major outputs of water from the system, wastewater could theoretically replace centralised supply to the City by 63%, and stormwater runoff by 189%, which would not only improve hydrological performance of the City, but supply internalisation and diversification as well. These figures represent a theoretical upper limit of a closed-loop system and assume no wastewater is discharged into rivers and all stormwater is captured, which is not feasible, or even desirable (e.g. environmental flow requirements53). Utilising such resources is challenging; the storage and purification of alternative water sources would require a significant shift in management practices and a commitment to a holistic approach to urban water management.16 However, there are many examples where MAR has been used as a method for storing and treating urban stormwater54-56 or recycled wastewater57.
In Cape Town, MAR has been in successful operation in the peri-urban area of Atlantis since the 1980s.44,54 This indirect recycling of treated domestic wastewater and stormwater has proven an effective water conservation measure54 at a small scale (equating to ~1% of total bulk water supply). Modelling studies by Mauck58 have shown that MAR on the Cape Flats, as part of a larger water sensitive urban design strategy, can also mitigate the migration of pollution plumes from urban sources. Although there are several risks of implementing MAR in an urban landscape (specifically localised flooding and poor quality water), these can be significantly mitigated via the integration of (artificial) wetlands and detention ponds that act to purify water59 and, in some cases, recharge the aquifer. As wetlands in the area are hydrologically diverse in character60, further research is required to assess how feasible, from a hydro-ecological perspective, integrating wetlands into stormwater treatment could be at such a spatial scale. An estimated capacity of ~13 GL can be stored within the city-wide network of stormwater detention ponds43 and the potential to address the need for storage by using real-time control techniques is currently under investigation61. Successfully making use of stormwater resources within the urban environment provides possibilities to restore wetland and vlei (shallow lake) ecosystems throughout the City to create blue and green spaces62, in addition to mitigating against drought and flood in the form of storage. In order to fully explore the potential to store stormwater runoff in particular, the seasonal fluctuations in groundwater storage need to be included in this mass balance, as does better parameterisation of groundwater/ surface water interaction in both wetland and river systems. Further still, the quality of stormwater is often a key challenge to its usability; applying the water-related nutrient efficiency indicator suggested by Renouf et al.48 would be a useful starting point in quantifying city nutrient budgets.
Towards water sensitivity and resilience
The performance indicators used in this study do well to assess the urban water metabolism in terms of resource efficiency, reduced reliance on external sources and improved hydrological function. However, these indicators, derived in a developed country context, do not account for socio-economic disparities in access to water. Addressing development and inequity issues, characteristic in developing countries, is noted as one of the fundamental tenets of a water sensitive design16 for the South African context63. Cape Town has a marked degree of inequality in terms of access to resources30, and in particular water29,49, where only 83% of the population has access to running water within their residential abode or backyard32. The implementation of water sensitive projects requires simultaneously addressing equitable access to basic services.64 Tackling equitable service delivery to informal settlements, in particular, is an unrelentingly complex challenge for all cities in South Africa and many others of the Global South.65 Developing an indicator of water equity that accounts for access to water services, both centralised and decentralised, is a crucial consideration in moving towards water sensitivity.
It is worth noting that while urban metabolism provides a useful framework to benchmark sustainability of the urban water cycle, there remains a lack of adequate metrics to quantify its resilience. While there are distinct differences between these terms, they are often used interchangeably in the literature66,67, which adds challenges for the creation of adequate metrics. As recently defined by Elmqvist et al.68, sustainability is an increase in efficiency and optimisation of resource use (including equitable access) and resilience is the capacity of a system to recover from disaster events and return to desired functions. Quantifying the urban water metabolism highlights where sustainability of the water cycle could be improved and achieved. However, its resilience - an emergent property of the complex urban system - is much harder to define and thus quantify. More challenging yet in its definition is the uncertainty associated with predictions of future climate and socio-economic systems and the many potential scenarios of what a 'New Normal'49 may look like. Including the socio-ecological functions of the urban environment (e.g. water purification of wetlands, storage capacity or behavioural changes in water use) into the urban metabolism framework may be a start in developing resilience metrics for the urban water cycle.
Conclusion
This research offers a first systemic quantification of the various components of the urban water cycle of Cape Town, comprising both anthropogenic and hydrological variables at a steady state. Despite scarce, and low confidence, data used to derive several variables at the macroscale, the urban water metabolism framework has proven a useful tool in assessing the performance of the City in the context of becoming water sensitive. Broadly, the performance indicators highlight that water efficiency and supply internalisation improve under the proposed New Water Programme. Hydrological performance improves only marginally; increases in groundwater recharge reflect the volumes of water reclaimed from treated effluent for MAR. No improvement to hydrological performance regarding runoff is achieved and highlights the need to reduce runoff and increase recharge further within the urban landscape. Water reuse and MAR are proposed interventions that strongly drive improved performance, and yet their contributions remain small by comparison with externally sourced water. This reinforces the benefits of 'closing the loop' in the City's commitment to becoming water sensitive, notwithstanding the likely future of static or decreasing water inputs.
The UWMF performance indicator framework is shown to be a valuable tool in assessing the impact of management decisions and interventions on the urban water cycle of the City and its commitment to becoming water sensitive. However, including an indicator to assess water equity is critical if the framework is to be used in a developing country context and will enhance the applicability of this approach in more cities of the Global South. Finally, while the framework does well to assess the sustainability of the urban water cycle, measuring its resilience will require integrating metrics that can adequately represent more facets of the society-nature interaction of a complex adaptive urban system.
Acknowledgements
We acknowledge the City of Cape Town for the water consumption data provided and are grateful to several anonymous reviewers from the Department of Environmental and Geographical Sciences at UCT and Umvoto for helpful comments on early drafts of the manuscript. All opinions and findings are that of the authors and do not necessarily reflect the opinions of University of Cape Town, Stellenbosch University, Umvoto Africa and/or City of Cape Town.
Competing interests
J.F.A. has no conflict of interest. T.F. and R.H. are employees of Umvoto Africa, a Cape Town based geohydrology consultancy that was contracted to undertake groundwater studies for the City of Cape.
Authors' contributions
J.F.A. conceptualised the study and methodology, collated the different data requirements, conducted the spatial data analyses and budget analysis, created the figures and wrote the manuscript. T.F. conceptualised the study, conducted the spatial analyses, created the boundary map and revised the manuscript. R.H. conceptualised the study, conducted the budget analyses and revised the manuscript.
References
1. Padowski JC, Gorelick SM. Global analysis of urban surface water supply vulnerability. Environ Res Lett. 2014;9(10), Art. #104004. https://doi.org/10.1088/1748-9326/9/10/104004 [ Links ]
2. Richter BD, Abell D, Bacha E, Brauman K, Calos S, Cohn A, et al. Tapped out: How can cities secure their water future? Water Policy. 2013;15(3):335-363. https://doi.org/10.2166/wp.2013.105 [ Links ]
3. Pincetl S, Porse E, Mika KB, Litvak E, Manago KF, Hogue TS, et al. Adapting urban water systems to manage scarcity in the 21st century: The case of Los Angeles. Environ Manag. 2019;63(3):293-308. https://doi.org/10.1007/s00267-018-1118-2 [ Links ]
4. Flörke M, Schneider C, McDonald RI. Water competition between cities and agriculture driven by climate change and urban growth. Nat Sustain. 2018;1(1):51-58. https://doi.org/10.1038/s41893-017-0006-8 [ Links ]
5. Goldman M, Narayan D. Water crisis through the analytic of urban transformation: An analysis of Bangalore's hydrosocial regimes. Water Int. 2019;44(2):95-114. https://doi.org/10.1080/02508060.2019.1578078 [ Links ]
6. Shepherd TG, Boyd E, Calel RA, Chapman SC, Dessai S, Dima-West IM, et al. Storylines: An alternative approach to representing uncertainty in physical aspects of climate change. Clim Change. 2018;151(3-4):555-571. https://doi.org/10.1007/s10584-018-2317-9 [ Links ]
7. Wolski P. How severe is Cape Town's 'Day Zero' drought? Significance. 2018;15(2):24-27. https://doi.org/10.1111/j.1740-9713.2018.01127.x [ Links ]
8. Sousa PM, Blamey RC, Reason CJC, Ramos AM, Trigo RM. The 'Day Zero' Cape Town drought and the poleward migration of moisture corridors. Environ Res Lett. 2018;13(12):124025. https://doi.org/10.1088/1748-9326/aaebc7 [ Links ]
9. Otto FEL, Wolski P Lehner F, Tebaldi C, Van Oldenborgh GJ, Hogesteeger S, et al. Anthropogenic influence on the drivers of the Western Cape drought 2015-2017. Environ Res Lett. 2018;13(12), Art. #124010. https://doi.org/10.1088/1748-9326/aae9f9 [ Links ]
10. Feng S, Fu Q. Expansion of global drylands under a warming climate. Atmos Chem Phys. 2013;13(19):10081-10094. https://doi.org/10.5194/acp-13-10081-2013 [ Links ]
11. Lehner F, Coats S, Stocker TF, Pendergrass AG, Sanderson BM, Raible CC, et al. Projected drought risk in 1.5°C and 2°C warmer climates: Drought in 1.5°C and 2°C warmer climates. Geophys Res Lett. 2017;44(14):7419-7428. https://doi.org/10.1002/2017GL074117 [ Links ]
12. Garreaud RD, Alvarez-Garreton C, Barichivich J, Boisier JP Christie D, Galleguillos M, et al. The 2010-2015 megadrought in central Chile: Impacts on regional hydroclimate and vegetation. Hydrol Earth Syst Sci. 2017;21(12):6307-6327. https://doi.org/10.5194/hess-21-6307-2017 [ Links ]
13. Smith IN, Mcintosh P Ansell TJ, Reason CJC, McInnes K. Southwest Western Australian winter rainfall and its association with Indian Ocean climate variability. Int J Climatol A J R Meteorol Soc. 2000;20(15):1913-1930. https://doi.org/10.1002/1097-0088(200012)20:15<1913::AID-JOC594>3.0.CO;2-J [ Links ]
14. City of Cape Town. City of Cape Town Water Outlook 2018 [document on the Internet]. c2018 [cited 2020 Oct 02]. Available from: https://resource.capetown.gov.za/documentcentre/Documents/City%20research%20reports%20and%20review/Water%20Outlook%202018%20-%20Summary.pdf [ Links ]
15. City of Cape Town. Our shared water future: Cape Town's water strategy [document on the Internet]. c2019 [cited 2020 Oct 02]. Available from: https://resource.capetown.gov.za/documentcentre/Documents/City%20strategies,%20plans%20and%20frameworks/Cape%20Town%20Water%20Strategy.pdf [ Links ]
16. Wong THF, Brown RR. The water sensitive city: Principles for practice. Water Sci Technol. 2009;60(3):673-682. https://doi.org/10.2166/wst.2009.436 [ Links ]
17. Wolman A. The metabolism of cities. Sci Am. 1965;213:179-190. https://doi.org/10.1038/scientiflcamerican0965-178 [ Links ]
18. Fischer-Kowalski M. Society's metabolism: The intellectual history of materials flow analysis: Part I: 1860-1970. J Ind Ecol. 1998;2(1):61-78. https://doi.org/10.1162/jiec.1998.2.1.61 [ Links ]
19. Kennedy C, Pincetl S, Bunje P The study of urban metabolism and its applications to urban planning and design. Environ Pollut. 2011;159(8-9):1965-1973. https://doi.org/10.1016/j.envpol.2010.10.022 [ Links ]
20. Niza S, Rosado L, Ferrao P Urban metabolism: Methodological advances in urban material flow accounting based on the Lisbon case study. J Ind Ecol. 2009;13(3):384-405. https://doi.org/10.1111/j.1530-9290.2009.00130.x [ Links ]
21. Kenway S, Gregory A, McMahon J. Urban water mass balance analysis. J Ind Ecol. 2011;15(5):693-706. https://doi.org/10.1111/j.1530-9290.2011.00357.x [ Links ]
22. Beck L, Brown RR, Chesterfield C, Dunn G, De Haan F, Lloyd S, et al. Beyond benchmarking: A water sensitive city. Paper presented at: OzWater'16; 2016 May 10-12; Melbourne, Australia. [ Links ]
23. Paul R, Kenway S, McIntosh B, Mukheibir P Urban metabolism of Bangalore City: A water mass balance analysis. J Ind Ecol. 2018;22(6):1413-1424. https://doi.org/10.1111/jiec.12705 [ Links ]
24. Renouf M, Kenway SJ. Evaluation approaches for advancing urban water goals. J Ind Ecol. 2017;21(4):995-1009. https://doi.org/10.1111/jiec.12456 [ Links ]
25. Arcadis. Sustainable Cities Water Index [document on the Internet]. c2016 [cited 2020 Oct 02]. Available from: https://images.arcadis.com/media/0/6/6/%7B06687980-3179-47AD-89FD-F6AFA76EBB73%7DSustainable%20Cities%20Index%202016%20Global%20Web.pdf [ Links ]
26. EIU. Asian Green City Index: Assessing the environmental performance of Asia's major cities. Munich: Economist Intelligence Unit; 2011. [ Links ]
27. Van Leeuwen CJ, Koop SHA, Sjerps RMA. City blueprints: Baseline assessments of water management and climate change in 45 cities. Environ Dev Sustain. 2016;18(4):1113-1128. https://doi.org/10.1007/s10668-015-9691-5 [ Links ]
28. Madonsela B, Koop S, Van Leeuwen K, Carden K. Evaluation of water governance processes required to transition towards water sensitive urban design-an indicator assessment approach for the City of Cape Town. Water. 2019;11, Art. #292. https://doi.org/10.3390/w11020292 [ Links ]
29. Gasson B. The ecological footprint of Cape Town: Unsustainable resource use and planning implications. Paper presented at: The National Conference of South African Planning Institution; 2002 September 19-20; Durban, South Africa. [ Links ].
30. Hoekman P Von Blottnitz H. Cape Town's metabolism: Insights from a material flow analysis. J Ind Ecol. 2017;21(5):pp1237-1249. https://doi.org/10.1111/jiec.12508 [ Links ]
31. Ahjum F, Stewart TJ. A systems approach to urban water services in the context of integrated energy and water planning: A City of Cape Town case study. J Energy South Afr. 2014;25(4):59-70. https://doi.org/10.17159/2413-3051/2014/v25i4a2239 [ Links ]
32. Currie PK, Musango JK, May ND. Urban metabolism: A review with reference to Cape Town. Cities. 2017;70:91-110. https://doi.org/10.1016/j.cities.2017.06.005 [ Links ]
33. Decker EH, Elliott S, Smith FA, Blake DR, Rowland FS. Energy and material flow through the marine environment. Annu Rev Energy Environ. 2000;25(1):685-740. https://doi.org/10.1146/annurev.energy.25.1.685 [ Links ]
34. Currie P Lay-Sleeper E, Fernandez JE, Kim J, Musango JK. Towards urban resource flow estimates in data scarce environments: The case of African cities. J Environ Prot (Irvine, Calif). 2015;6(9):1066-1083. https://doi.org/10.4236/jep.2015.69094 [ Links ]
35. Vrebos D, Staes J, Vandenbroucke T, D'Haeyer T, Johnston R, Muhumuza M, Kasabeke C, Meire P. Mapping ecosystem service flows with land cover scoring maps for data-scarce regions. Ecosyst Serv. 2015;13:28-40. https://doi.org/10.1016/j.ecoser.2014.11.005 [ Links ]
36. Renouf MA, Kenway SJ, Lam KL, Weber T, Roux E, Serrao-Neumann S, et al. Understanding urban water performance at the city-region scale using an urban water metabolism evaluation framework. Water Res. 2018;137:395-406. https://doi.org/10.1016/j.watres.2018.01.070 [ Links ]
37. City of Cape Town. City of Cape Town draft water strategy [document on the Internet]. c2019 [cited 2020 Oct 02]. Available from: https://resource.capetown.gov.za/documentcentre/Documents/City%20strategies,%20plans%20and%20frameworks/Cape%20Town%20Water%20Strategy.pdf [ Links ]
38. Bailey AK, Pitman WV. Water resources of South Africa (WR2012): Book of maps. Version 1. WRC report no. TT 684/16. Pretoria: Water Research Commisson; 2016. [ Links ]
39. Schulze RE, Maharaj M, Moult N. South African atlas of climatology and agrohydrology. WRC report 1489/1/06 Section 13.3. Pretoria: Water Research Commission; 2007. [ Links ]
40. Allen RG, Pereira LS, Raes D, Smith M. Crop evapotranspiration: Guidelines for computing crop water requirements. FAO irrigation and drainage paper 56. Rome: FAO; 1998. [ Links ]
41. Kruger E, editor. Drainage manual: Application guide. 6th ed. Pretoria: The South African National Roads Agency, SOC Ltd.; 2013. [ Links ]
42. Lupton RC, Allwood JM. Hybrid Sankey diagrams: Visual analysis of multidimensional data for understanding resource use. Resour Conserv Recycl. 2017;124:141-151. https://doi.org/10.1016/j.resconrec.2017.05.002 [ Links ]
43. Okedi J. The prospects for stormwater harvesting in Cape Town, South Africa using the Zeekoe Catchment as a case study [PhD thesis]. Cape Town: University of Cape Town; 2019. [ Links ]
44. Jovanovic N, Bugan RDH, Tredoux G, Israel S, Bishop R, Marinus V. Hydrogeological modelling of the Atlantis aquifer for management support to the Atlantis Water Supply Scheme. Water SA. 2017;43(1):122-138. https://doi.org/10.4314/wsa.v43i1.15 [ Links ]
45. Grimmond CSB, Oke TR. An evapotranspiration-interception model for urban areas. Water Resour Res. 1991;27(7):1739-1755. https://doi.org/10.1029/91WR00557 [ Links ]
46. Hobbie SE, Finlay JC, Janke BD, Nidzgorski DA, Millet DB, Baker LA. Contrasting nitrogen and phosphorus budgets in urban watersheds and implications for managing urban water pollution. Proc Natl Acad Sci USA. 2017;114(16):4177-4182. https://doi.org/10.1073/pnas.1618536114 [ Links ]
47. Minnesota Pollution Control Agency. The simple method for estimating phosphorus export. In: Minnesota Stormwater Manual [webpage on the Internet]. c2017 [updated 2020 Apr 08; cited 2020 Oct 02]. Available from: https://stormwater.pca.state.mn.us/index.php?title=The_Simple_Method_for_estimating_phosphorus_export [ Links ]
48. Renouf M, Serrao-Neumann S, Kenway SJ, Morgan E, Low Choy D. Urban water metabolism indicators derived from a water mass balance - Bridging the gap between visions and performance assessment of urban water resource management. Water Res. 2017;122:669-677. https://doi.org/10.1016/j.watres.2017.05.060 [ Links ]
49. Enqvist JP Ziervogel G. Water governance and justice in Cape Town: An overview. Wiley Interdiscip Rev Water. 2019; e1354. https://doi.org/10.1002/wat2.1354 [ Links ]
50. City of Cape Town. Trends and change - 10 years: Census 2001 - Census 2011. Cape Town: City of Cape Town; 2012. [ Links ]
51. Currie PK, Musango JK, May ND. Urban metabolism: A review with reference to Cape Town. Cities. 2017;70(June):91-110. https://doi.org/10.1016/j.cities.2017.06.005 [ Links ]
52. Kenway SJ, Lam KL, Sochacka B, Renouf MA. Integrated urban water systems. In: Newton P Prasad D, Sproul A, White S, editors. Decarbonising the built environment: Charting the transition. Singapore: Springer Singapore; 2019. p. 287-304. https://doi.org/10.1007/978-981-13-7940-6_15 [ Links ]
53. Gerten D, Hoff H, Rockström J, Jägermeyr J, Kummu M, Pastor AV. Towards a revised planetary boundary for consumptive freshwater use: Role of environmental flow requirements. Curr Opin Environ Sustain. 2013;5(6):551-558. https://doi.org/10.1016/j.cosust.2013.11.001 [ Links ]
54. Bugan RDH, Jovanovic N, Israel S, Tredoux G, Genthe B, Steyn M, et al. Four decades of water recycling in Atlantis (Western Cape, South Africa): Past, present and future. Water SA. 2016;42(4):577-594. https://doi.org/10.4314/wsa.v42i4.08 [ Links ]
55. Clark R, Gonzalez D, Dillon P Charles S, Cresswell D, Naumann B. Reliability of water supply from stormwater harvesting and managed aquifer recharge with a brackish aquifer in an urbanising catchment and changing climate. Environ Model Softw. 2015;72:117-125. https://doi.org/10.1016/j.envsoft.2015.07.009 [ Links ]
56. Radcliffe JC, Page D, Naumann B, Dillon P Fifty years of water sensitive urban design, Salisbury, South Australia. Front Environ Sci Eng China. 2017;11(4):7. https://doi.org/10.1007/s11783-017-0937-3 [ Links ]
57. Bekele E, Toze S, Patterson B, Higginson S. Managed aquifer recharge of treated wastewater: Water quality changes resulting from infiltration through the vadose zone. Water Res. 2011;45(17):5764-5772. https://doi.org/10.1016/j.watres.2011.08.058 [ Links ]
58. Mauck BA. The capacity of the Cape Flats Aquifer and its role in water sensitive urban design in Cape Town [PhD thesis]. Cape Town: University of Cape Town; 2017. [ Links ]
59. Verhoeven JTA, Meuleman AFM. Wetlands for wastewater treatment: Opportunities and limitations. Ecol Eng. 1999;12:5-12. https://doi.org/10.1016/S0925-8574(98)00050-0 [ Links ]
60. Brown C, Magoba R. Rivers and wetlands of Cape Town: Caring for our rich aquatic heritage. WRC report no. TT 376/08. Pretoria: Water Research Commission; 2009. [ Links ]
61. Okedi J, Armitage NP. Benefits of real time control for catchment scale stormwater harvesting in Cape Town, South Africa. In: Mannina G, editor. New trends in urban drainage modelling UDM 2018 green energy and technology. Cham: Springer; 2018. p. 587-591. https://doi.org/10.1007/978-3-319-99867-1_101 [ Links ]
62. Brodnik C, Holden J, Marino R, Wright A, Copa V Rogers B, et al. Jumping to the top: Catalysts for leapfrogging to a water sensitive city. IOP Conf Ser Earth Environ Sci. 2018;179(1):12034. https://doi.org/10.1088/1755-1315/179/1/012034 [ Links ]
63. Armitage N, Fisher-Jeffes L, Carden K, Winter K, Naidoo V Spiegel A, et al. Water Sensitive Urban Design (WSUD) for South Africa: Framework and guidelines. WRC report no. TT 588/14. Pretoria: Water Research Commision; 2014. [ Links ]
64. Fisher-Jeffes L, Carden K, Armitage N, Borwa A. A water sensitive urban design framework for South Africa. T Reg Plan. 2017;71(1):1-10. [ Links ]
65. Seeliger L, Turok I. Averting a downward spiral: Building resilience in informal urban settlements through adaptive governance. Environ Urban. 2014;26(1):184-199. https://doi.org/10.1177/0956247813516240 [ Links ]
66. Elmqvist T. Development: Sustainability and resilience differ. Nature. 2017;546:352. https://doi.org/10.1038/546352d [ Links ]
67. Johannessen Ä, Wamsler C. What does resilience mean for urban water services? Ecol Soc. 2017;22(1):1. https://doi.org/10.5751/ES-08870-220101 [ Links ]
68. Elmqvist T, Andersson E, Frantzeskaki N, McPhearson T, Olsson P Gaffney O, et al. Sustainability and resilience for transformation in the urban century. Nat Sustain. 2019;2(4):267-273. https://doi.org/10.1038/s41893-019-0250-1 [ Links ]
 Correspondence:
Ffion Atkins
Email: ffion.atkins@uct.ac.za
Received: 14 July 2020
Revised: 02 Oct. 2020
Accepted: 22 Nov. 2020
Published: 28 May 2021
Supplementary Data
The supplementary data is available in pdf: [Supplementary Data]
Editor: Yali Woyessa
Funding: South African National Research Foundation (grant no. 114696)

