


Servicios Personalizados
Articulo
 Inglés (pdf)
 Articulo en XML
 Referencias del artículo
Indicadores

Links relacionados
-
 Citado por Google
 -
 Similares en Google
Compartir

 Permalink
South African Journal of Science
versión On-line ISSN 1996-7489
versión impresa ISSN 0038-2353
S. Afr. j. sci. vol.117 no.5-6 Pretoria may./jun. 2021
http://dx.doi.org/10.17159/sajs.2021/8118
RESEARCH ARTICLE
Impacts of soil carbon on hydrological responses - a sensitivity study of scenarios across diverse climatic zones in South Africa
Stefanie SchütteI; Roland E. SchulzeI; Mary ScholesII
ICentre for Water Resources Research, University of KwaZulu-Natal, Pietermaritzburg, South Africa
IISchool of Animal, Plant and Environmental Sciences, University of the Witwatersrand, Johannesburg, South Africa
ABSTRACT
Soil organic carbon (SOC) content and the water holding capacity of soils are two properties which link the carbon and hydrological cycles. Hydrological model inputs seldom include soil carbon as a parameter even though soil carbon content is known to influence soil water retention capacities. This study is a sensitivity analysis of changes in hydrological responses when the model inputs include different soil carbon percentages for the topsoil horizon. Sensitivities of hydrological responses such as transpiration, runoff volumes, the stormflow component of runoff and extreme runoff events to SOC content were quantified under various climatic conditions in South Africa. The soil water holding capacities at the drained upper limit (i.e. field capacity), permanent wilting point and saturation were calculated for the topsoil horizon, using SOC dependent pedo (soil)-transfer functions for different soil carbon scenarios and locations in South Africa. These variables, together with other pre-determined soil- and location-related inputs, as well as 50 years of daily climate, were then used as inputs in a process-based hydrological model. Overall, it was found that increased SOC content in the topsoil horizon leads to an increase in transpiration, a reduction in runoff, especially in its stormflow component, and a reduction of extreme runoff events. However, these changes are relatively small compared to the influence of climate, particularly of rainfall amount and distribution.
SIGNIFICANCE:
• Organic carbon content of the soil and the water holding capacity of soils link the carbon and hydrological cycles.
• Management interventions that increase SOC lead to win-win situations because, in addition to climate change mitigation, plant water availability improves, and overall surface runoff 'flashiness' becomes more regulated.
• While rainfall amount and distribution over space and time remain the most critical determinants of hydrological responses, increased SOC in the topsoil horizon leads to increases in transpiration and thus plant growth, and to a reduction in runoff, especially in its stormflow component, and hence to a small reduction of severe flooding events.
Keywords: organic matter, impact on hydrology, soil water holding capacity, hydrological modelling
Introduction
The amount of soil organic carbon (SOC), and more broadly soil organic matter, is directly linked to the chemical, physical and biological properties of soil. Soil texture, rather than SOC, is the main determinant of soil water holding capacity, i.e. the volume of water that can be held by the soil. However, SOC also plays a role, thereby linking the carbon and hydrological cycles.1-3 Mechanisms of general soil water absorption and retention are explained in soil science textbooks.4 SOC itself has a water retention effect through affecting soil structure and adsorption properties5, as well as through soil aggregation and associated pore space distribution6.
The SOC impact on soil water retention depends on the type of soil, on soil carbon content and on the amount of water in the soil at a given point in time.5-11 A positive correlation of SOC with water retention and/or selected water potentials is extensively reported in the literature8-13, with limited exceptions13-15. The importance of SOC in estimating water retention is affected by textural composition5,16, with this effect being of higher importance in coarse-textured soils than in fine-textured soils5,8,16. A US database analysis linked an increase of 1% (of soil weight) in SOC content to a 2% to >5% increase in plant available water content.17 Soil water is a key controller of metabolic processes in the soil and of plant growth and productivity.18 Changes in soil water retention with SOC additions affect the timing and duration of plant water availability, and are especially valuable in low carbon soils.8
The quantification of the relationship between SOC content and soil water retention has been reported as part of selected pedo (soil)-transfer functions which are empirical relationships between parameters of soil characteristics and more readily obtainable data on soil properties.19,20 Soil water retention is commonly measured at suctions of 33 kPa and 1500 kPa. It is assumed that these water holding volumes are indicators of that particular soil's hydrological variables of drained upper limit (DUL) and permanent wilting point (WP), respectively, while plant available water is the water held between DUL and WP.21 Rawls et al.5 and Saxton and Rawls16 developed equations for water retention at suctions of 33 kPa and 1500 kPa which included clay, sand and silt content, as well as SOC, based on US soil databases, with the equations of Rawls et al.5 being the more robust.22 Soil porosity equations were also developed by Rawls et al.7
Soil organic carbon in South Africa is generally low and spatially highly variable.23 With hydrological responses expected to change in South Africa in the next 50 years due to climate and land use change, there has to date been no baseline study to illustrate how soil carbon content impacts hydrological responses. This study focuses on the sensitivity of hydrological processes - e.g. stormflow and plant physiological responses, specifically transpiration rate - to varying amounts of soil carbon. The aim of this study was to use a process-based daily time-step hydrological model to explicitly include soil carbon contents across seven hydroclimatic zones using SOC-dependent pedo-transfer functions for different soil carbon scenarios and locations in South Africa. The results of this study would then indicate the SOC threshold at which hydrological processes are impacted upon and where these soils are located in South Africa.
Methodology
Six scenarios with varying carbon content were defined. One scenario was based on the actual SOC contents in the topsoil horizon, as derived from the soil carbon database24,25, with an average SOC of 1.2% and a range between 0 and 12%. To be able to calculate sensitivities to changes in SOC content, hypothetical doubling and halving of the actual SOC amount were undertaken, with the three carbon scenarios being termed 'Cactual', 'Chalf' and 'Cdouble'. The half scenario was included because land-use change mostly results in a reduction of SOC; however, conservation agriculture, irrigation and afforestation could result in an increase - hence the double scenario. In addition to the above scenarios, unrelated to actual SOC contents, assumptions of hypothetical SOC contents of 1%, 2% and 4% were made, with these three carbon scenarios being termed 'C,' 'C2' and 'C4'. This approach was used to exclude the impact of the spatial variability of actual SOC in order to determine the sensitivity of the modelled hydrological responses. While a change of SOC from 1% to 4% is perhaps unrealistic, this was chosen to show more extreme changes. While hydrological modelling includes the soil profile properties, and therefore properties of the top- and subsoil horizons, we focused only on changes of SOC in the topsoil horizon, where substantial changes are more likely.
The soil-dependent hydrological soil water variables of DUL, WP and porosity (PO) for the topsoil horizon were calculated for each carbon scenario using the pedo-transfer functions by Rawls et al.5, but corrected as per Nemes et al.22 to read SOC rather than soil organic matter. First, soil textural contents of clay and sand, as well as SOC, were obtained from the Soil Profile Database.26 The conversion from point values to area values has been explained in detail in Schütte et al.24
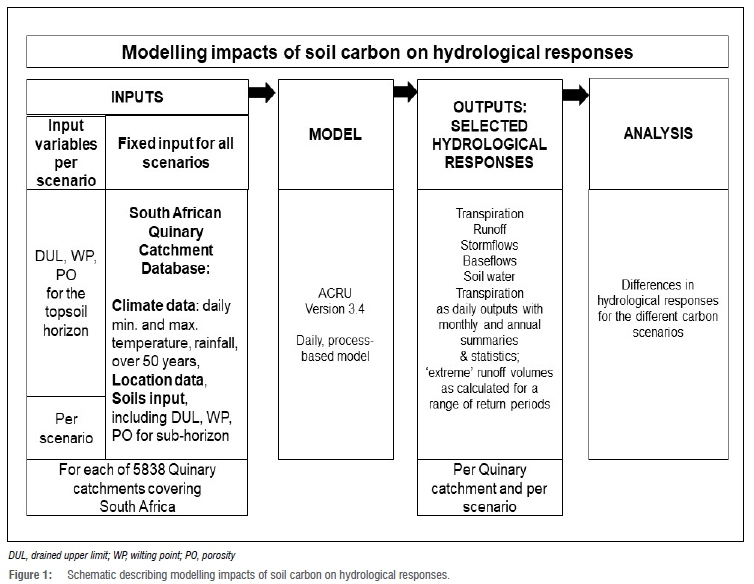
A schematic on the more detailed methodology of modelling impacts of soil carbon on hydrological responses is shown in Figure 1. To model hydrological responses in southern Africa, the Quinary Catchments Database27 is frequently used. In the Quinary Catchments Database, South Africa, Lesotho and Eswatini (formerly known as Swaziland) were delineated into 5838 hydrologically relatively homogeneous response units, the so-called Quinary catchments, which are hydrologically interlinked with each linked to a 50-year data set of daily climate as well as location (e.g. altitude and slope), natural vegetation and soil properties. This existing database was used in this study to model hydrological responses, but with the DUL, WP and PO values of the topsoil horizon in the Quinary Catchments Database replaced with the newly calculated values. By using this approach to model the various scenarios, perscenario results of hydrological responses can be obtained on a Quinary catchment spatial resolution across southern Africa, with the responses including transpiration, runoff, and its components of stormflow and baseflow, all for a statistically median year, for the 1:10 dry year, the 1:10 wet year, as well as for design 1-day, 2-day and 3-day runoff events calculated for a range of return periods by volumes.
The analysis of hydrological responses shown here is focused on seven strategic locations within South Africa, each represented by its respective Quinary catchment. These seven selected locations are considered to be representative of different climatic regimes and natural vegetation zones in South Africa and have been used as sample locations in previous studies.28,29 The selected locations, together with the natural vegetation types in these zones, are shown in Figure 2. Table 1 shows the selected locations' identifiers, elevations, Quinary catchment names and numbers, their dominant natural vegetation and soil types, as well as mean monthly rainfall and potential evaporation, and monthly means of daily maximum temperature for the 50 years of observed and/or infilled data30 (1950-1999), with the different climatic zones, according to the frequently used international Köppen classification31 provided in the text.
Roodeplaat is in Köppen Climate Zone Cwb (winters long, dry and cool), with a mean annual precipitation (MAP) of 689 mm, mainly in the summer months (October to March). Mara is in Köppen Climate Zone BSh (semi-arid, hot and dry), with a low MAP of 375 mm. Upington has a very low MAP of 204 mm (Köppen Climate Zone BWh, arid, hot and dry). Elsenburg is in the winter rainfall region, with a MAP of 796 mm, and is in Köppen Climate Zone Csb (summers long, dry and cool). Outeniqua is in Köppen Climate Zone Cfb (wet all seasons, summers long and cool) and experiences rainfall throughout the year, with slightly lower rainfall in the cool winter months, with a MAP of 985 mm. Cedara is in Köppen Climate Zone Cwb (winters long, dry and cool), with a MAP of 842 mm, mainly in the summer months. Mount Edgecombe has a MAP of 1068 mm and is in Köppen Climate Zone Cfa (wet all seasons, summers long and hot, but wetter in summer than in winter). The locations' MAPs show a wide range from 204 mm to 1068 mm, while the annual mean temperature ranges from 19 °C to 29 °C. There is also a large elevation range, from 83 m to 1542 m.
The widely verified process-based daily time-step ACRU Model28 was used first to simulate and explore the baseline hydrological characteristics of the seven hydroclimatic zones assuming naturally occurring vegetation types according to Acocks32. These simulations included volumes and monthly distributions of baseflow and stormflow. The model was then used to simulate the impacts of the various SOC scenarios. The model takes into account the atmosphere-soil profile-plant-water continuum of the landscape. Daily precipitation that reaches the soil surface after interception by vegetation either infiltrates and moves from topsoil horizon to subsoil horizon and possibly groundwater, or the water runs off as stormflow or (slow, delayed) baseflow to discharge into rivers.28
Results
The calculated ACRU input variables changed as a result of SOC changes; for example for Quinary catchment No. 4686, which represents Cedara for the C1 and C4 scenarios: the topsoil horizon DUL increased from 0.301 m/m (C1) to 0.335 m/m (C4), WP increased from 0.179 m/m (C1) to 0.181 m/m (C4) and PO increased from 0.454 m/m to 0.496 m/m.
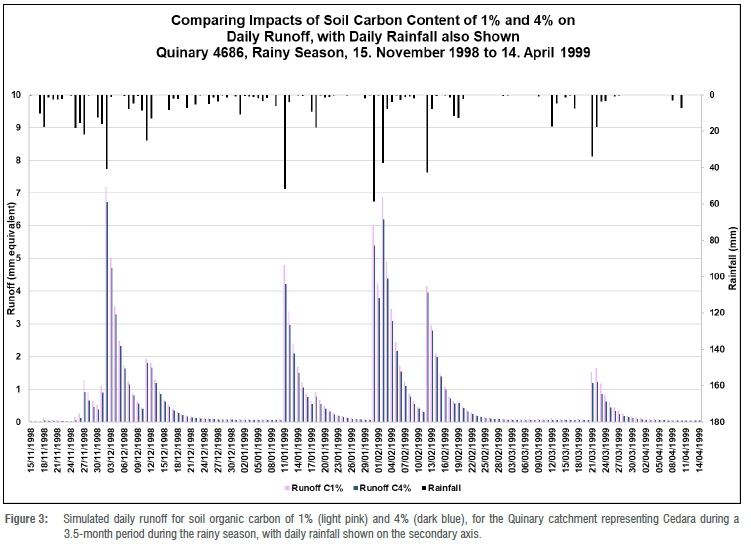
Figure 3 shows the runoff results for a daily time slice of 5 months for one selected Quinary catchment (No. 4686) representing Cedara for the C1 and C4 scenarios. The runoff events are highly dependent on the magnitude and timing of the rainfall events. The C4 scenario provided evidence that the higher SOC percentages reduced daily peaks compared to the C1 scenario.
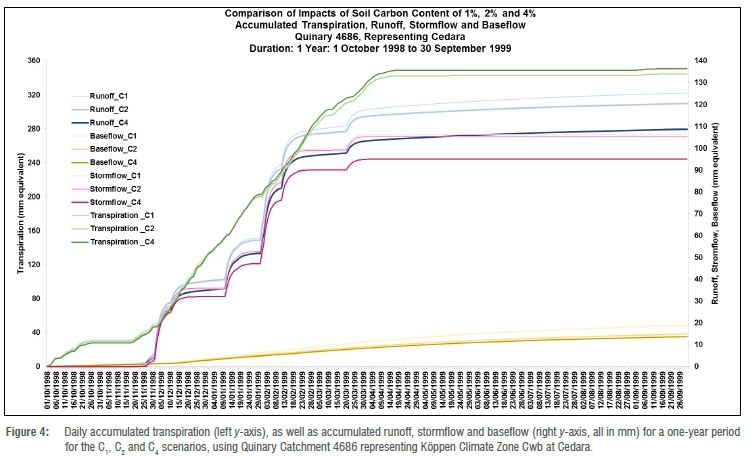
Impacts of the 1%, 2% and 4% SOC scenarios for the same Cedara catchment, for a period of 1 year (Figure 4), show accumulated annual transpiration of 345 mm (C1 and C2) and 352 mm (C3), thus showing an increase in transpiration of 6 mm (2%) from the C1 to the C4 scenario. Runoff decreased by 16 mm (equivalent to 13%) from 125 mm (C1) to 120 mm (C2) to 109 mm (C4). The stormflow component of runoff was reduced by 11 mm (11%, for C1 to C4) from 106 mm (C1) to105 mm (C2) to 95 mm (C4), and the baseflow was reduced by 5 mm (or 26%) from 19 mm (C1) to 15 mm (C2) to 14 mm (C4).
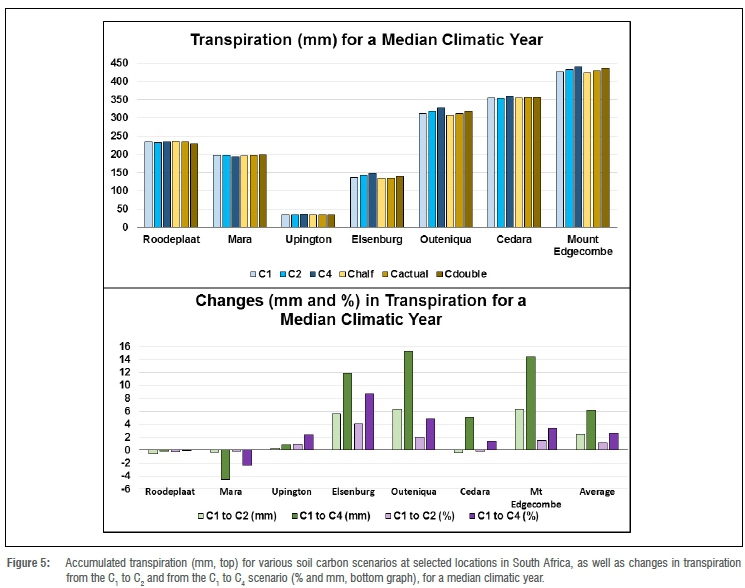
Changes in median annual transpiration for the 50 years of modelled daily values at the various locations are shown in Figure 5, representing plant water usage, with large differences, as expected, among the locations, being the lowest in arid Upington (Köppen Zone BWh) and the highest in moist Mount Edgecombe (Köppen Zone Cfa). With an increase in SOC, transpiration hardly changed for Roodeplaat, Mara, Cedara and Upington. However, at Elsenburg, in the winter rainfall zone and with a more temperate climate (Köppen Zone Csb), transpiration increased by 12 mm, equivalent to 9%, for a change in SOC from 1% to 4%, and increased by 6 mm, equivalent to 4%, for a change in SOC from 1% to 2%. Mount Edgecombe (in the Cfa climate zone, wet all seasons, summers long and hot) shows a transpiration increase of 14 mm, equivalent to 3%, for a change in SOC from 1% to 4%, but hardly any change (6 mm or 1%) when changing from 1% to 2% SOC. Generally, however, these locations show an increase in transpiration with increased SOC.
The runoff figures (not shown) in a 1:10 dry year vary from no runoff for all carbon scenarios for arid Upington, to a runoff of 56 mm in the C1 scenario, 53 mm in the C2 scenario, 43 mm in the C4 scenario, and 60 mm, 58 mm and 54 mm, respectively, for the Chalf, Cactual and Cdouble scenarios for Elsenburg. In a year of median responses, the runoff ranges between 1 mm for Upington in the C4 scenario to 196 mm, 193 mm and 187 mm for Elsenburg (winter rainfall zone, Csb) for, respectively, the Chalf, Cactual and Cdouble scenarios. For a 1:10 wet year, runoff ranges between 21 mm for Upington (dry, BWh) for the C4 scenario, to 468 mm, 463 mm and 452 mm at Mount Edgecombe (wet, Cfa) for the Chalf, Cactual and Cdouble scenarios (not shown).
Selected changes in runoff results (Figure 6) show the impact of SOC to vary. While no impact is seen in Upington in a 1:10 dry year, because there is no runoff anyway, substantial sensitivities to SOC are seen for the other wetter areas. The largest absolute reduction of 24 mm is at Cedara in a 1:10 wet year when changing SOC from 1% to 4% SOC, with the largest relative reduction (but only a small absolute reduction) in runoff for Upington at 44% in a median year with a change in SOC from 1% to 4%.
Stormflows are rapid surface or near surface flows and are generally the major component of total runoff in most parts of South Africa. The highest results are from Mount Edgecombe (wet, Cfa) where stormflows are modelled at 330 mm, 328 mm and 310 mm for the C1 C2 and C4 scenarios (not shown). Changes (mm and %) in stormflows in a 1:10 dry year, a median year and a 1:10 wet year for changing scenarios from the C1 to the C4 scenario (Figure 6) show the biggest absolute change, for a 1:10 wet year at Cedara (wet, Cwb) with a 24 mm reduction for a change from 1% to 4% SOC, while the biggest relative change is for Upington (dry, BWh) with a 27% reduction. In summary, an increase in SOC can lead to significant reductions in stormflows, but this depends on the inherent climate of an area and whether it is a dry, median or wet year.
Baseflows are the slow-release component of runoff and are the only water source in rivers in the non-rainy season while being a major component of runoff in the winter rainfall region. Most important in this sensitivity study are baseflows in the 1:10 dry year, with no baseflows for any of the SOC scenarios generated at Roodeplaat, Mara and Upington and very little at Cedara. The highest annual baseflows are found at Elsenburg (winter rainfall, temperate climate) with respectively 58, 56 and 52 mm for the Chalf, Cactual and Cdouble SOC scenarios (not shown).
In the cases where baseflow occurred, generally, a small reduction in baseflows was evident, although in relative terms this could be high, with up to 99% for Upington for a change of SOC from 1% to 4% in a 1:10 wet year (not shown).
Changes in more extreme runoff design events for 1-day and 3-day accumulated magnitudes for design return periods of 2-, 5-, 10- and 50-year return periods are shown in Figure 7. While the Quinary catchments at Elsenburg (winter rainfall) and Outeniqua (all year rainfall) show no significant changes, the highest absolute reduction was at Mount Edgecombe (wet, Cfa), from 2.9 mm equivalent runoff for a 3-day event for the 2-year return period to 4.4 mm for a 3-day event for the 50-year return period. Relative reductions were highest for Upington (dry, BWh), up to 20% for a 2-day runoff event for a 50-year return period (not shown), with a reduction of 2.2% for 3-day and 2-day runoff events for a 50-year return period.
Overall, it was found that increased SOC content in the topsoil horizon leads to an increase in transpiration, a reduction in runoff, especially in the stormflow component, and to a reduction of extreme runoff events.
Discussion and conclusions
While most soil profile and location specific properties cannot be changed, land use management can influence the amount of carbon in the soil, especially in the topsoil horizon. The sensitivities of hydrological responses such as transpiration, total runoff, the stormflow component, and extreme events to changes in SOC content at a number of diverse locations within South Africa were quantified using a hydrological process modelling approach. Relevant hydrological soil variables of soil water content at DUL (or field capacity), WP and PO, i.e. at saturation, were calculated for the topsoil horizon, using pedo-transfer functions which include various amounts of carbon representing different soil carbon scenarios. These soil carbon scenarios were then used as inputs to a process-based hydrological model at Quinary catchment resolution, with other soil profile, location and natural vegetation properties remaining as per the standard South African Quinary Catchments Database. Differences in hydrological responses between the scenarios were assessed for a number of climatically diverse areas within South Africa ranging from desert to sub-tropical climates.
Soil water holding capacities impacted by SOC were found to be a link between the carbon and the hydrological cycles as reported in the literature.1-3 For the location studies, SOC was shown to impact hydrological responses, but the magnitude of these changes is strongly influenced by rainfall regimes and varies between the different climatic zones, location and soil properties. In assessing runoff on a daily basis for Cedara, for example, an increase in SOC led to a reduction in the conversion of rainfall to runoff, with the peak runoff magnitudes generally being reduced. Changes in runoff range between insignificant in very dry areas, to up to 24 mm of absolute reduction for Cedara in a 1:10 wet year, when modelling a change from 1% to 4% SOC, with the largest relative reduction (but only a small absolute reduction) in runoff for Upington at 44% for a median year when SOC is changed from 1% to 4%. The significant reductions in runoff results are mainly from stormflows, but with also more muted reductions in baseflows. An increase in SOC leads to transpiration increases, as was expected and found by others.8 With an increase in SOC, shifts from runoff, and especially from the stormflow component, towards transpiration are seen. With increased SOC, the soil holds water more in situ in the landscape, with this water being available for plant transpiration and growth, which in turn leads to a reduction in runoff. On the other hand, when there is very little rain, as is in the case of Upington in a 1:10 dry year, then there is no runoff for any of the soil carbon scenarios.
Not all areas show a change in extreme runoff with SOC changes, but most show a slight reduction in extreme runoff events with an increase in SOC content. When expressed as relative changes, this reduction is higher in smaller floods with shorter return periods compared to changes in larger floods with higher return periods. However, when expressed as absolute changes, the reductions are higher for larger floods with higher return periods compared to smaller floods with shorter return periods. Overall, an increase in soil carbon is shown to reduce extreme runoff events in most areas, but with different magnitudes. Increases in soil carbon should thus help to reduce some flood damage, thereby providing an important ecosystem service.
For the first time in South Africa, sensitivities of hydrological responses to SOC content changes have been calculated for selected locations with widely differing climatic regimes, with the results of this study confirming those in the literature.12 In this study, a quantification of the overall reduction in runoff, and especially in stormflows, has been presented. Land management practices that increase carbon content would retain more water in the soil profile which would be available for plant use, and would thus usually lead to reduced runoff and flood events, but the impacts are limited and, again, depend on climatic, soil and location factors. Increased SOC, with increased plant water availability, is an additional benefit to climate change mitigation and thus presents a win-win situation.
More research is recommended to update the South African hydrological soil property databases, incorporating the new DUL, WP and plant available water values. While we examined only changes in SOC content in the topsoil, this study could be expanded to the subsoil horizon as well. The methodology developed in this study could also be used for sensitivity studies elsewhere in South Africa. Bearing in mind uncertainties regarding input values of carbon content, climate and soil variables, as well as pedo-transfer functions established elsewhere in the world, further improvements to impact modelling can be made if locally derived equations of WP, DUL and PO, which include a soil carbon factor, and improved model inputs, become available. Further research is also recommended to study the impact of actual changes in SOC on hydrological responses in South Africa over a historical period, as well as on SOC impacts on plant growth in the form of changes to soil water and plant stress-free days, for agricultural crop yield and primary production assessments.
Acknowledgements
We acknowledge the National Research Foundation (South Africa) for financial support of S.S.'s PhD studies through the Southern African Systems Analysis Programme. And the Agricultural Research Council for allowing the use of their databases. We also thank the two anonymous reviewers whose comments helped to improve this paper.
Competing interests
We declare that there are no competing interests.
Authors' contributions
S.S. devised the methodology, did the modelling and the analyses and wrote the paper. R.E.S. and M.S. provided technical input and provided editing support in their roles as PhD supervisor and co-supervisor, respectively.
References
1. Falkowski PG, Scholes RJ, Boyle E, Canadell J, Canfield D, Elser J, et al. The global carbon cycle: A test of our knowledge of earth as a system. Science. 2000;290128176(13):291-296. https://doi.org/10.1126/science.290.5490.291 [ Links ]
2. Mu Q, Zhao M, Running SW. Evolution of hydrological and carbon cycles under a changing climate. Part III: Global change impacts on landscape scale evapotranspiration. Hydrol Process. 2011;25(26):4093-4102. https://doi.org/10.1002/hyp.8367 [ Links ]
3. Lal R. Agricultural activities and the global carbon cycle. Nutr Cycl Agroecosystems. 2004;70(2):103-116. https://doi.org/10.1023/B:FRES.0000048480.24274.0f [ Links ]
4. Sumner ME, editor. Handbook of soil science. Boca Raton, FL: CRC Press; 2000. [ Links ]
5. Rawls WJ, Pachepsky YA, Ritchie JC, Sobecki TM, Bloodworth H. Effect of soil organic carbon on soil water retention. Geoderma. 2003;116(1-2):61-76. https://doi.org/10.1016/s0016-7061(03)00094-6 [ Links ]
6. Hudson BD. Soil organic matter and available water capacity. J Soil Water Conserv. 1994;49(2):189-194. [ Links ]
7. Rawls WJ, Nemes A, Pachepsky Y Effect of soil organic carbon on soil hydraulic properties. Dev Soil Sci. 2004;30:95-114. https://doi.org/10.1016/S0166-2481(04)30006-1 [ Links ]
8. Ankenbauer KJ, Loheide SP. The effects of soil organic matter on soil water retention and plant water use in a meadow of the Sierra Nevada, CA. Hydrol Process. 2017;31(4):891-901. https://doi.org/10.1002/hyp.11070 [ Links ]
9. Kay BD, Da Silva AP Baldock JA. Sensitivity of soil structure to changes in organic carbon content: Predictions using pedotransfer functions. Can J Soil Sci. 1999;77(4):655-667. https://doi.org/10.4141/S96-094 [ Links ]
10. Resurreccion AC, Moldrup P Tuller M, Ferré TPA, Kawamoto K, Komatsu T, et al. Relationship between specific surface area and the dry end of the water retention curve for soils with varying clay and organic carbon contents. Water Resour Res. 2011;47(6):1-12. https://doi.org/10.1029/2010wr010229 [ Links ]
11. Da Costa A, Albuquerque JA, Da Costa A, Pértile P Da Silva FR. Water retention and availability in soils of the State of Santa Catarina-Brazil: Effect of textural classes, soil classes and lithology. Rev Bras Ciência do Solo. 2013;37(6):1535-1548. https://doi.org/10.1590/S0100-06832013000600010 [ Links ]
12. Franzluebbers A. Water infiltration and soil structure related to organic matter and its stratification with depth. Soil Tillage Res. 2002;66(2):197-205. https://doi.org/10.1016/S0167-1987(02)00027-2 [ Links ]
13. Shaxson TF. Re-thinking the conservation of carbon, water and soil: A different perspective. Agron Sustain Dev. 2006;26:9-19. https://doi.org/10.1051/agro:2005054 [ Links ]
14. Lal R. Physical properties and moisture retention characteristics of some Nigerian soils. Geoderma. 1978;21(3):209-223. https://doi.org/10.1016/0016-7061(78)90028-9 [ Links ]
15. Danalatos NG, Kosmas CS, Driessen PM, Yassoglou N. Estimation of the draining soil moisture characteristic from standard data as recorded in routine soil surveys. Geoderma. 1994;64(1-2):155-165. https://doi.org/10.1016/0016-7061(94)90095-7 [ Links ]
16. Saxton KE, Rawls WJ. Soil water characteristic estimates by texture and organic matter for hydrologic solutions. Soil Sci Soc Am J. 2006;70(5):1569. https://doi.org/10.2136/sssaj2005.0117 [ Links ]
17. Olness A, Archer D. Effect of organic carbon on available water in soil. Soil Sci. 2005;170(2):90-101. https://doi.org/10.1097/00010694-200502000-00002 [ Links ]
18. Shaxson TF. Re-thinking the conservation of carbon, water and soil: A different perspective. Agron Sustain Dev. 2006;26:9-19. https://doi.org/10.1051/agro:2005054 [ Links ]
19. Pachepsky YA, Rajkai K. Tóth B. Pedotransfer in soil physics: Trends and outlook - A review. Agrokémia és Talajt. 2015;64(2):339-360. https://doi.org/10.1556/0088.2015.64.2.3 [ Links ]
20. Van Looy K, Bouma J, Herbst M, Koestel J, Minasny B, Mishra U, et al. Pedotransfer functions in Earth system science: Challenges and perspectives. Rev Geophys. 2017;55(4):1199-1256. https://doi.org/10.1002/2017RG000581 [ Links ]
21. Bauer A. Influence of soil organic matter on bulk density and available water capacity of soils. Farm Res. 1974:44-52. https://library.ndsu.edu/repository/handle/10365/24299 [ Links ]
22. Nemes A, Timlin DJ, Pachepsky YA, Rawls WJ. Evaluation of the pedotransfer functions for their applicability at the U.S. National Scale. Soil Sci Soc Am J. 2009;73(5):1638. https://doi.org/10.2136/sssaj2008.0298 [ Links ]
23. Du Preez CC, Van Huyssteen CW, Mnkeni PNS. Land use and soil organic matter in South Africa 1: A review on spatial variability and the influence of rangeland stock production. S Afr J Sci. 2011;107:27-34. https://doi.org/10.4102/sajs.v107i7/8.354 [ Links ]
24. Schütte S, Schulze RE, Paterson G. Identification and mapping of soils rich in organic carbon in South Africa as a climate change mitigation option. Pretoria: Department of Environmental Affairs; 2019. Available from: https://www.environment.gov.za/sites/default/files/reports/identificationandmapping_soilsrich_organiccarboninsouthafrica.pdf [ Links ]
25. Schulze RE, Schütte S. Mapping soil organic carbon at a terrain unit resolution across South Africa. Geoderma. 2020;373:114447. https://doi.org/10.1016/j.geoderma.2020.114447 [ Links ]
26. Soil Survey Staff, ARC-ISCW. 1:250 000 scale land type survey of South Africa. Pretoria: Agricultural Research Council -Institute for Soil, Climate and Water; no date. [ Links ]
27. Schulze RE, Horan MJC, Kunz RP Lumsden TG, Knoesen D. Methods 2: Development of the Southern African Quinary Catchments Database. In: Schulze RE, Hewitson BC, Barichievy KR, Tadross MA, Kunz RP Horan MJC, et al. Methodological approaches to assessing eco-hydrological responses. Pretoria: Water Research Commission; 2010; p. 63-74. [ Links ]
28. Schulze RE. Hydrology and agrohydrology - A text to accompany the ACRU 3.00 Agrohydrological Modelling System. Pretoria: Water Resarch Commission; 1995. [ Links ]
29. Hughes CJ. Degradation of ecological infrastructure and its rehabilitation for improved water security [unpublished doctoral thesis]. Pietermaritzburg: University of KwaZulu-Natal; 2018. [ Links ]
30. Lynch SD. Development of a raster database of annual, monthly and daily rainfall for southern Africa. Pretoria: Water Research Commission; 2004. [ Links ]
31. Schulze RE, Schütte S. Climate zones and climate change. In: Schulze RE, editor. Handbook for farmers, officials and other stakeholders on adaptation to climate change in the agriculture sector within South Africa Section B: Agriculture's natural capital in South Africa: A climate change perspective. Pietermaritzburg: Department Agriculture, Forestry and Fisheries; 2016. p. 173-179. Available from: https://www.daff.gov.za/daffweb3/Branches/Forestry-Natural-Resources-Management/Climate-Change-and-Disaster-Management/Climate-Change-Unit [ Links ]
32. Acocks JPH. Veld types of southern Africa. 3rd ed. Memoirs of the Botanical Survey of South Africa 57. Pretoria: Botanical Research Institute; 1988. p.1-146. [ Links ]
 Correspondence:
Stefanie Schütte
Email: Schuttes@ukzn.ac.za
Received: 02 Apr. 2020
Revised: 30 Sep. 2020
Accepted: 04 Nov. 2020
Published: 28 May 2021
Editor: Yali Woyessa
Funding: National Research Foundation (South Africa)

