


Servicios Personalizados
Articulo
 Inglés (pdf)
 Articulo en XML
 Referencias del artículo
Indicadores

Links relacionados
-
 Citado por Google
 -
 Similares en Google
Compartir

 Permalink
South African Journal of Science
versión On-line ISSN 1996-7489
versión impresa ISSN 0038-2353
S. Afr. j. sci. vol.117 no.5-6 Pretoria may./jun. 2021
http://dx.doi.org/10.17159/sajs.2021/8617
RESEARCH ARTICLE
Source apportionment of ambient PM10-25 and PM2.5 for the Vaal Triangle, South Africa
Luckson MuyemekiI; Roelof BurgerI; Stuart J. PikethI; Brigitte LanguageI; Johan P BeukesII; Pieter G. van ZylII
IUnit for Environmental Sciences and Management, North-West University, Potchefstroom, South Africa
IIChemical Resource Beneficiation, North-West University, Potchefstroom, South Africa
ABSTRACT
The Vaal Triangle Airshed Priority Area (VTAPA), like other priority areas in South Africa, has an air pollution problem. Understanding the sources contributing to air pollution in this priority area will assist in the selection and implementation of appropriate control strategies. For this study, aerosol samples in the coarse (PM10-25) and fine (PM25) fraction were collected at four sites in the VTAPA during summer/autumn, winter, and spring. The contributing sources were identified and characterised based on the elemental and ionic compositions obtained through X-ray fluorescence and ion chromatography analysis. The highest seasonal median concentrations of PM10-2.5 (116 μg/m3) and PM2.5 (88 μg/m3) were observed in Sharpeville during the winter. The lowest median concentrations of PM10-2.5 (25 μg/m3) and PM2.5 (18 μg/m3) were detected in Zamdela during the summer/autumn period. At all sites, there was a high abundance of crustal elements in PM10-2.5 and a dominance of coal and biomass combustion-related elements in PM25. The Positive Matrix Factorisation receptor model identified dust-related and secondary aerosols as the major contributing sources of PM10-2.5. PM2.5 contributions were predominantly from coal burning for Sebokeng and Sharpeville and from industry, wood and biomass burning, and secondary aerosols for Kliprivier and Zamdela. The results of this study identify the main sources contributing to particulate air pollution in the VTAPA and provide local authorities with valuable information for decision-making.
SIGNIFICANCE:
• Dust, industry, domestic coal burning, vehicles, and wood and biomass combustion are the key sources of particulate air pollution in the VTAPa that need to be prioritised by decision-makers.
• Although Sebokeng and Sharpeville are located within the vicinity of industries, domestic coal burning has a greater contribution to particulate loading at these sites.
• Results from this study will assist in the design of local municipality air quality management plans for the VTAPA.
Keywords: PM10-25, PM25, chemical composition, trajectory cluster analysis, source apportionment
Introduction
Over the past decades, South Africa has experienced strong economic growth, industrial expansion, and rapid urbanisation. This has led to the emergence of cities characterised by high population densities and high industrial and traffic activities. Air pollution is a serious environmental problem in these urban areas and has attracted widespread attention from the public as a result of its negative effects on humans.1 Pollution from particulate matter (PM) is of primary concern in South Africa.2 Exposure to PM is the fourth leading human health risk factor and is linked to over 5 million premature deaths all over the world.3 Exposure to PM, especially PM25, over long periods is dangerous to humans as inhaled particles will penetrate deep into the lungs and increase the risk of morbidity and premature mortality due to cardiopulmonary diseases and lung cancer.4-6 Effective strategies are urgently needed to improve air quality and address the health risks associated with PM. Acquiring reliable and comprehensive information on the main sources of PM is the first key step required to achieve this.7
Source apportionment is an air quality management tool that can provide statistical information about source contributions which is important in the formulation of mitigation strategies for PM.8-10 Attempts have been made in South Africa to apportion PM sources and their contributions. Engelbrecht et al.11 used the Chemical Mass Balance model to compare PM source contributions from residential coal and low-smoke fuels used in the township of Qalabotjha. The Chemical Mass Balance model was also applied to identify the PM sources contributing to air pollution in Kwadela township.12 Recently, Tshehla and Djolov13 used the Positive Matrix Factorisation (PMF) receptor model to apportion PM sources in an industrialised rural area in the Limpopo Province. In the case of South Africa, where local source profiles are still lacking, the PMF model is a suitable alternative for the Chemical Mass Balance model as it does not require source profile data. The main sources of particulate (PM10 and PM2.5) pollution identified from these source apportionment studies in South Africa include industries, residential solid fuel burning, vehicles, dust, and biomass burning.13 However, despite attempts to identify air pollution sources in South Africa, studies reporting on PM sources are still lacking.14 A thorough understanding of the different compositions and contributions of PM is required as it will assist air quality planners in assigning precedence to key pollutant sources.7
In 2006 the Vaal Triangle, a highly industrialised region, was classified as an air pollution priority area due to public health concerns over the elevated levels of air pollution faced in this region.15 The major local sources found in the Vaal Triangle Airshed Priority Area (VTAPA) include industries, residential burning, vehicles, waste, and windblown dust.16 These sources occur within close proximity to one another. In 2009, an Air Quality Management Plan detailing possible intervention strategies for the VTAPA was published.17 The first 5-year cycle review of this Air Quality Management Plan in 2013 revealed that, despite efforts made, air pollutant concentrations were still above national ambient air quality standards.18 This was due to inadequate implementation of air quality controls.18
The second 5-year cycle of the VTAPA Air Quality Management Plan is currently in review. Target air quality limits still have not been met as daily and annual average PM concentrations still remain above the national standards.15 A source apportionment study is therefore required to establish an understanding of the current sources contributing to PM and identify opportunities for further emission reductions.
In this study, therefore, we sought to achieve the following objectives: (1) to explore the temporal and spatial variations of PM in the VTAPA; (2) to determine the elemental and ionic compositions of PM; and (3) to identify and apportion the main sources contributing to PM pollution.
Materials and methods
Sampling sites
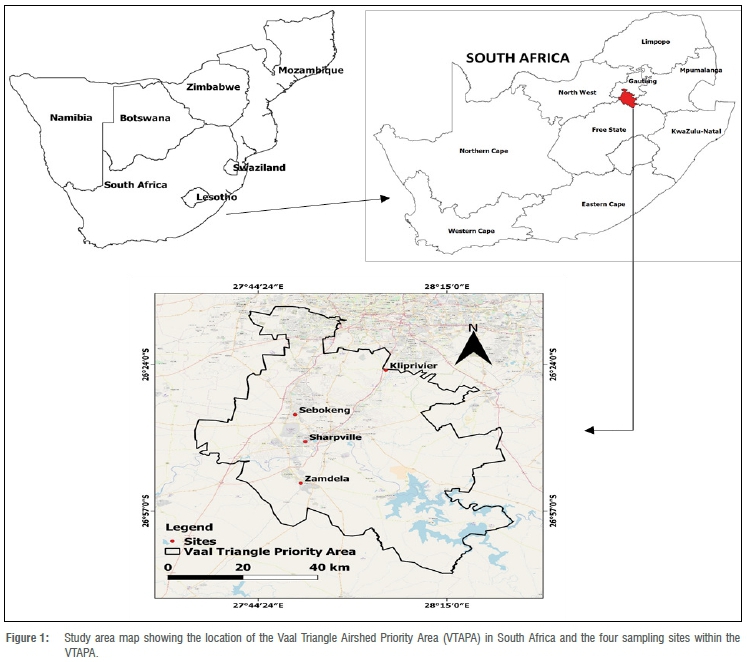
The VTAPA is situated on the high central inland plateau of South Africa with terrain elevations ranging between 1300 m and 1900 m above sea level. The VTAPA stretches from the southern part of the Gauteng Province to the northern section of the Free State Province. The land use in this region includes commercial, industrial, residential, and low-intensity agricultural activities, all situated within close vicinity to one another. Four sites in the VTAPA were selected for this study. These sites (Figure 1) were selected based on a baseline assessment that identified these sites as ambient PM hotspot zones.19 Sebokeng (26.5879S, 27.8410E), Sharpeville (26.6810S, 27.8677E) and Zamdela (26.8449S, 27.8551E) monitoring sites are situated inside densely populated low-income settlements, while Kliprivier (26.4203S, 28.0849E) site is in a low-density area.
Sampling strategy
Sampling was performed simultaneously at all of the sites for the summer/autumn (2 February - 9 March 2018 and 12 March -21 March 2018), winter (20 June - 6 July 2018), and spring (13 September -21 September 2018 and 25 September - 3 October 2018) periods. Dichotomous low volume samplers (MicroPNS Type Dichoto LVS16, Umwelttechnik MCZ GmbH, Bad Nauheim, Germany) with split-flow rates of 1.7 IVmin (for fine particles) and 15 L/min (for coarse particles) were employed for the simultaneous and sequential collection of particulate matter in the fine (PM2.5) and coarse (PM10-2.5) fraction on 47 mm PTFE Teflon filter membranes (2 μm pore size). Prior to being weighed, the filters were inspected for defections and then preconditioned in a stable environment for 24 h so as to allow for their weights to stabilise. The filters were then weighed three times before and after sampling using an XP26 DeltaRange Microbalance (Mettler-Toledo AG, Greifensee, and CH). The averaged mass difference (μg) was used together with the total volume of air sampled (m3) to calculate the mass concentrations of the particles collected on each filter. These filters were stored in individual Petri slide dishes.
Two consecutive continuous 12-h samples for each size fraction were collected daily to enable comparisons between day (10:00 - 22:00) and night concentrations (22:00 - 10:00).20-22 In total, 768 filters were sampled for the entire campaign. Laboratory blanks were used to determine the impact of laboratory procedure on the measured filter mass concentrations. Field blanks were utilised to determine the effect of sample handling and the filter itself on measured mass concentrations.
Chemical analyses
Elements
Trace elements on the Teflon filters were chemically analysed using X-ray fluorescence, which is a non-destructive procedure that allows for the analysis of filters without being subjected to any pre-treatment process. X-ray fluorescence involves the interplay between X-ray photons and the elements found in the PM species leading to the discharge of electrons, which will result in the release of X-rays that are unique for the individual element.23 A wavelength dispersive X-ray fluorescence spectrometer was used for this analysis. The exposed Teflon samples were placed in filter holders and put into 47-mm stainless steel sample cups. These samples were then analysed by being exposed to an excitation condition in which X-rays produced from the spectrometer interact with atoms in the filters.23 The following elements were detected using the spectrometer: Na, Mg, Al, Si, P S, Cl, K, Ca, Ti, V, Cr, Mn, Fe, Ni, Cu, Zn, and Pb. The measured concentrations of these elements were corrected using blanks.
Ions
Water-soluble ionic species on the Teflon filters were analysed using ion chromatography. A Dionex ICS-3000 system consisting of two flow lines was used for ion chromatography analysis.24 One flow line was used for the detection of anion species and the other flow line to detect cation species. Before chemical analysis commenced, the filters were leached in 10 mL deionised water in an ultrasonic bath for 30 min. Five standards, ranging from 20 ppb to 500 ppb, were prepared using certified stock solutions obtained from Industrial Analytical (Johannesburg, South Africa). Filter samples were then analysed for the following water-soluble ionic species: F-, Cl-, SO42-, NO3-, CH3COO-, HCOO-, C2O42-, Na+, NH4+, K+, Mg2+, and Ca2+. In order to avoid contamination, this procedure was conducted in a stabilised room. The measured ion concentrations were corrected using blanks.
Meteorological data
Meteorological data from weather stations near the sampling sites were obtained for each site from the South African Weather Services (https://saaqis.environment.gov.za/). The meteorological variables used in this study include temperature (Temp), relative humidity (RH), wind speed (WS), and wind direction (WD). Wind roses (Supplementary figure 1) for each site and sampling season were generated using the Open Air package in R.
Positive Matrix Factorisation model analysis
PM10-2.5 and PM2.5 source contributions to ambient air particulate concentrations in the VTAPA were quantified using the US Environmental Protection Agency (EPA) PMF model. The PMF model is a multivariate factor analysis tool that deconstructs the matrix of speciated sample data into two matrices: factor contributions and factor profiles.2.5 This is a well-tested receptor model that has been applied globally.26-28 For this study, the PMF (Version 5.0) was performed to obtain quantitative source profiles and mass contributions. The PMF model equation can be expressed as follows:

where Xijis the concentration of species j measured on sample I; p is the number of factors contributing to the samples; fkj is the concentration of species j in factor profile k; gik is the relative contribution of factor k to sample I, and eij is the error of the PMF model for the species j measured on sample I.
In order to run PMF, the model requires sample chemical species concentration values and uncertainty estimates for each species. Uncertainty estimates were calculated by dividing the limit of quantification from the mass concentration for each species so as to obtain a fractional value. This can be expressed as:

where F is the fractional value, LOQ is the limit of quantification per species per exposed filter (μg/m3), and M is the species mass concentration (μg/m3).
An uncertainty is then assigned to each species based on the specific range into which the fractional value of a particular species falls.
The PMF model was run multiple times for all sites using elemental and ionic composition data for PM10-2.5 and PM2.5. The species used in the model were chosen according to the signal-to-noise (S/N) criterion. Species with S/N values greater than 2 were classified as 'strong', while those within the 0.2-1.9 range were categorised as 'weak'. Species with S/N values less than 0.2 were defined as 'bad' variables and were removed from the analysis. The optimal number of factors for each site was selected based on (1) knowledge of sources affecting the study area, (2) distributions of the scaled residuals and (3) the Qtrue/Qrobust ratio.29 Species with symmetrically distributed scaled residuals within a range of -3 to +3 are indicative of a good model fit. The Qtrue/Qrobust ratio is useful in determining the influence of outliers on the model. A ratio above 1.5 indicates that outliers may have a disproportionate effect on the model and will need to be down weighted (Supplementary table 1).30,31 The number of factors chosen for each site is shown in Table 1. A source type was assigned to each factor based on known representative indicator chemical species and source profiles obtained from the US EPA SPECIATE database (https://www.epa.gov/air-emissions-modeling/speciate-2).11,32

Air mass origin
Back trajectory analysis was used to identify the transport pathways of air masses reaching the observation sites in the VTAPA. Five-day back trajectories were computed daily throughout each sampling period (summer/autumn, winter, and spring) as they can capture the pattern of pollutant transport from source regions to the study site.21,33 Each trajectory was run every hour for 12 h so as to capture day and night-time air mass pathways. These trajectories were generated in the PC version of the HYSPLIT (Hybrid Single-Particle Lagrangian Integrated Trajectory) model using the Global Data Assimilation System's meteorological data set (spatial resolution of 1° x 1°), developed by the US National Center for Environmental Prediction.34 A starting height of 500 m above ground level was chosen as it corresponds to trajectories near the ground.21 The meteorological data were obtained from the US National Oceanic and Atmospheric Administration ftp server (ftp://arlftp.arlhq.noaa.gov/pub/archives/gdas1). The Sharpeville site was used as the reference point for the backward trajectories.
The trajectory cluster analysis tool in the HYSPLIT model was then used to group individual trajectories of similar air mass origins into clusters. Cluster analysis allows for air masses to be examined over time, whilst reducing the uncertainty effects related to long trajectories.35 This tool employs an algorithm that utilises the latitudes and longitudes of hourly endpoints as input variables.36 The number of clusters retained for this study was determined by the percentage change in the total spatial variance. Individual trajectories within each cluster were then averaged to produce cluster-mean trajectories.
Statistical analyses
Statistical tests were carried out to deduce whether PM10-2.5 and PM2.5 concentrations at each site differed significantly across seasons. Based on the Shapiro-Wilk's test, PM10-2.5 and PM2.5 concentrations were found to be not normally distributed. Therefore, the Kruskal-Wallis test was used for the variance analysis.
Results and discussion
Meteorological conditions
Table 2 presents the mean values of the meteorological conditions during the three sampling periods. Wind speed was relatively higher in summer/autumn and spring, and lower in winter. At all sites, relative humidity decreased significantly from summer/autumn to spring. Seasonal variations showed that temperature values at all sites were comparatively higher in spring and summer/autumn and lower in winter. The highest temperatures were experienced in February.
Spatial and temporal variations of PM10-2.5 and PM2.5 mass concentration
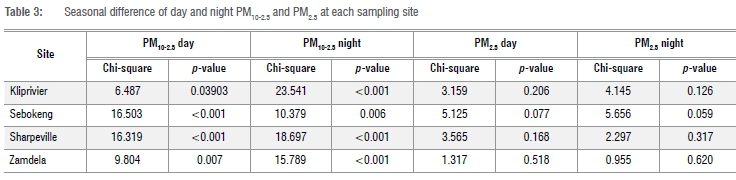
Statistical analysis of the temporal pattern of PM10-2.5 concentrations (Table 3) at each sample site revealed significant seasonal differences for both day and night. It can be observed that the highest seasonal median values for PM10-2.5 were experienced in Sharpeville during the winter season for both the day (95 μg/m3) and night (116 μg/m3) periods (Figure 2). Day and night PM10-2.5 concentrations were significantly higher in spring and winter than in the summer/autumn period. There were no significant seasonal differences in PM2.5 concentrations at each sample site. The highest seasonal PM2.5 median values were observed in winter, with Sebokeng's maximum concentration (68 μg/m3) occurring during the daytime and Sharpeville's peak (88 μg/m3) during the night. The lowest seasonal median values for PM10-2.5 (25 μg/m3) and pM2.5 (18 μg/m3) were experienced in Zamdela during the summer/ autumn period.
PM10-2.5 and PM2.5 chemical composition
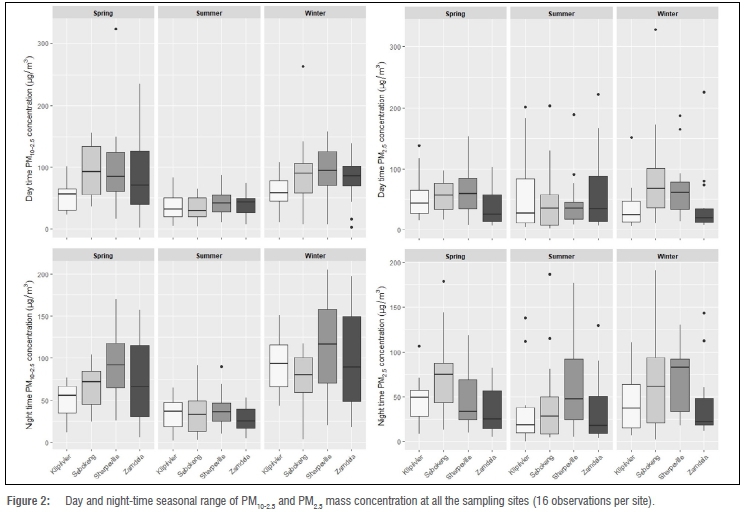
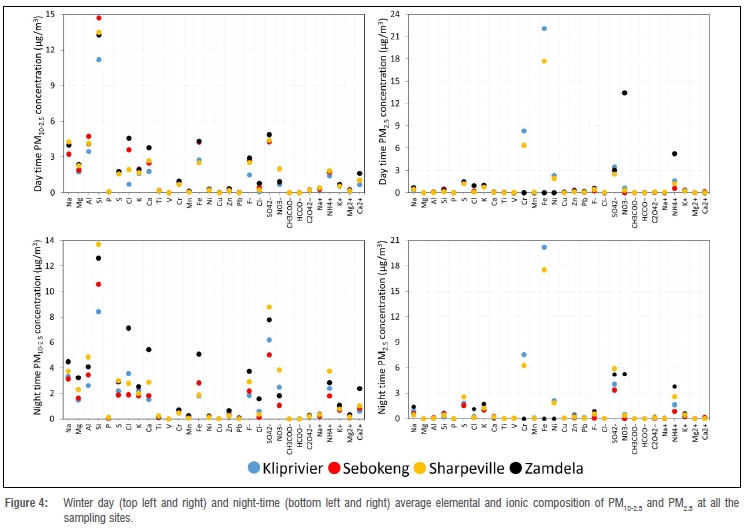
The elemental and ionic contents of PM10-2.5 and PM2.5 for summer/ autumn, winter, and spring at the four sampling sites are shown in Figures 3, 4, and 5, respectively. Statistical summaries of the elemental and ionic species for each site are given in Supplementary tables 2-13.
Elements
The elements Si, Mg, Al, Ca, Na, S, and Fe contributed the most towards PM10-2.5 concentrations at all sites, both during the day and night for all seasons. These elements were highest in spring, which is a season associated with strong winds in the VTAPA (Supplementary figure 1). The abundance of Si, Mg, Al, Ca, Na, and Fe in PM10-2.5 indicate that dust is dominant at these sites. There is also a strong presence of S in PM2.5 for both day and night at all sites during all three seasons, implying that coal combustion could be an important contributor to atmospheric PM. There is a fairly high abundance of K and Zn in the PM2.5 during the days and nights of winter and spring. These elements could have been emitted as a result of wood and biomass burning. Fe, Cr, and Ni were dominant in PM2.5 during the day and night for Kliprivier (summer/autumn) and Zamdela (winter and spring). Fe, Cr, and Ni were also significant contributors of PM2.5 during the summer/autumn nights at Kliprivier and Sebokeng. In Kliprivier, this could be a result of emissions from commercial heavy-duty vehicles operating on public roads from 20:00 to 06:00. The high concentrations of Fe, Cr, and Ni in Sebokeng could result from night-time operations at ArcelorMittal metallurgical industry.
Ions
Ionic compositions for PM10-2.5 and PM2.5 revealed that SO42-, NH4+, and F" are all dominant species for summer/autumn, winter and spring at all sites. The occurrence of these ionic species could be a result of coal combustion from industries, and to a lesser extent from residential solid fuel burning. The strong presence of NO3" in PM10-2.5 and PM25 during the day and night in winter could suggest an industrial origin. SO42", NH4+, F", and NO3" concentrations are highest in winter mainly as a result of increased coal combustion. High Na+, Mg2+, and Ca2+ abundances were observed for PM10-2.5, suggesting the possibility of marine and crustal origin sources. Wood and biomass burning is also an important source, as indicated by the abundance of K+ in PM2.5, especially in winter where it is highest due to the need for space heating.
Apportionment of sources identified by PMF
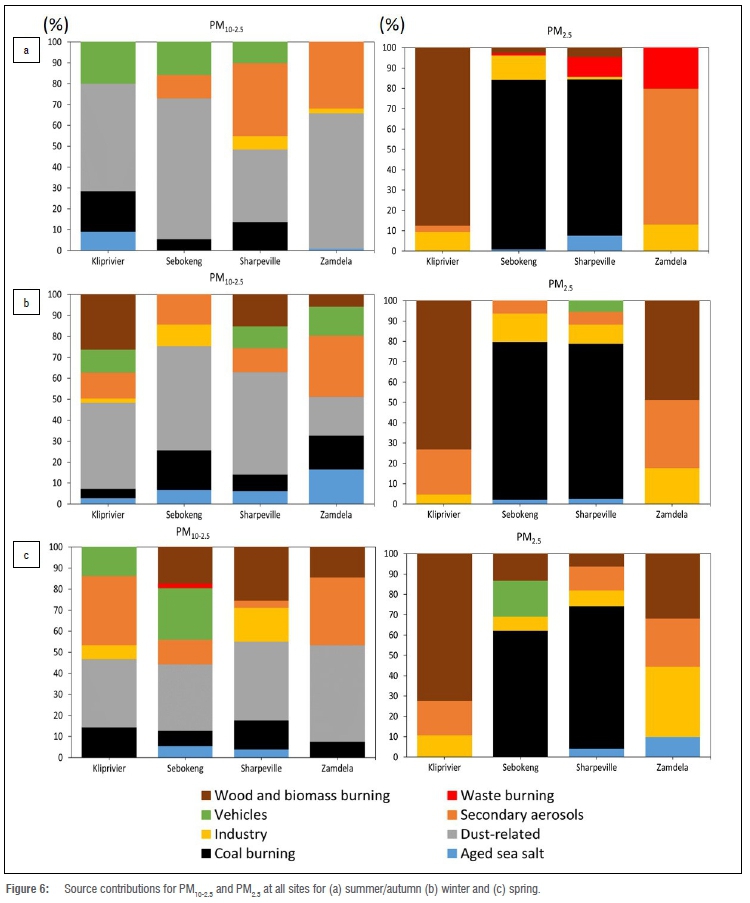
The potential sources that were identified using the PMF model are industry, coal burning, wood and biomass burning, waste burning, dust-related, vehicles, secondary aerosols, and aged sea salt. Figure 6 presents the source apportionment results for the four sampled sites and shows the variations in contributions based on the three sampling periods.
PM10-2.5 and PM2.5 sources
The industry source is typically characterised by strong contributions from Zn, Fe, Pb, Ni, Cr, Mn, and V. These elements are usually associated with smelters and metallurgical industries.37 The metal element V is mainly associated with heavy fuel oil combustion.38 Coal, coking coal, and heavy fuel oil are the main energy sources that drive industries in the VTAPA.17 Coal burning is an important source identified through PMF. This source is generally associated with burning in low-income households and industries. The coal-burning source is highly loaded with Cl". This ion is mainly from ammonium chloride (NH4Cl), which occurs as a result of the rapid reaction between HCl and NH4+ in the atmosphere.39 With coal being the primary energy source in South Africa, coal burning can be regarded as the largest potential source of HCl.
Wood and biomass burning are characterised by a high content of K+ and minor contributions of SO42" and NO3". K+ is widely recognised as an indicator of biomass burning as it is released during the plant combustion process.31 For the low-income settlements in the VTAPA, K+ is more representative of wood combustion as wood is an important energy source for cooking and space heating in these settlements.15 Biomass burning occurs in the VTAPA through the burning of open spaces used for agricultural activities.17
Refuse collection in the low-income settlements of South Africa is infrequent and has resulted in the pile-up of solid waste into heaps. As a measure to reduce these heaps, residents have resorted to burning waste.15 The waste burning source identified through PMF contained high values of NH4+ and small contributions from Cl" and K+. The occurrence of Cl" could be as a result of the presence of salt-containing foodstuffs and chlorine-based materials in domestic waste disposals. Residents in low-income settlements often do not sort their waste before disposal, which can result in domestic waste being mixed with garden waste, thus likely explaining the presence of K+ in the waste burning source.
The dust-related source was identified in the coarse fraction and was characterised by crustal elements which included Ca, Mg, Si, Al, Fe, Ti, and Mn. This source could have been generated locally through resuspension of soil and construction works as well as through regional transportation of dust aerosols.40 The elements found in the dust-related source could also be associated with resuspended dust resulting from motor vehicle entrainment on unpaved roads in low-income settlements. Other metals such as Cr and V were also present in the dust-related source and could be as a result of soil contamination from industrial emissions.41 NO3", Pb, Zn, Mn, and Fe were characteristic of the vehicle source. The Zn, Mn, and Fe metal elements found in this source are associated with both petrol- and diesel-fueled vehicles.42 These elements are also associated with brake, tear, and engine wear.43 Zn is a common additive found in lubricating oils and can be emitted through combustion by diesel engines.38 Fe is generally found in catalysts used for petrol fuel combustion.44
The secondary aerosol source mainly consisted of SO42", NO3" and NH4+, formed through the chemical transformation of SO2, NOx, and NH3 pollutants originating from other direct sources. The presence of secondary aerosols in the VTAPA could also be a result of long-range transportation. The aged sea salt source was characterised by high loadings of Na and low Cl levels. The lack of Cl in the aged sea salt source is a result of Cl displacement in sea salt particles by acidic pollutants (H2SO4 and HNO3) leading to the formation of sulfate and nitrate salts.45 The long distances travelled by air masses (transporting sea salt) from the sea to the study site could also have resulted in the loss of Cl along their trajectories.
Seasonal contributions
Source apportionment results reveal that for PM10-2.5, dust-related is a major source at Kliprivier (32-52%), Sebokeng (31-68%), Sharpeville (34-49%), and Zamdela (19-65%). Dust-related contributions show relatively higher concentrations in summer/autumn and spring, and lower concentrations in winter. Secondary aerosols have an important contribution at Kliprivier (12-32%), Sebokeng (11-14%), Sharpeville (12-35%), and Zamdela (29-32%). The seasonal variations showed that contributions of secondary aerosols were relatively higher in spring and summer/autumn and lower in winter. For summer/autumn this could mainly be as a result of regional transportation from the industrial region of Mpumalanga, whilst for spring, secondary aerosols could be from the intensive agricultural region of the Free State Province.40,46
Coal combustion and vehicles are sources prominent in the coarse fraction. Coal combustion accounts for 4% to 19%, 6% to 19%, 8% to 14%, and 7% to 16% of PM10-2.5 mass concentrations in Kliprivier, Sebokeng, Sharpeville, and Zamdela, respectively. Vehicles account for 11% to 20%, and 16% to 25% of PM10-2.5 mass concentrations in Kliprivier and Sebokeng, respectively. Vehicles contributed to 10% of PM10-2.5 mass concentrations for both summer/autumn and winter at Sharpeville. In winter, vehicles contributed 14% of PM10-2.5 mass concentrations at Zamdela.
Coal burning, secondary aerosols, wood and biomass burning, and industries are the key PM sources in the fine fraction. Coal burning is the main source of PM2.5 air pollution in Sebokeng and Sharpeville, contributing over 60% for all three seasons with the highest concentrations being experienced in winter. These results are expected as domestic fuel combustion in low-income settlements is higher during winter due to the high demand for space heating.47 Secondary aerosols are a key PM2.5 source in Zamdela with contributions ranging from 24% to 67%. These secondary aerosols are likely to have an industrial origin as Sasol Chemical Industries Complex is located within the vicinity of Zamdela. Secondary aerosols are also an important PM2.5 source at Kliprivier. The contribution from secondary aerosols for all three seasons in Kliprivier varied from 17% to 22%. The presence of secondary aerosols at Kliprivier is likely to be from coal-fired power stations. This site is impacted by pollution originating outside the designated boundaries of the VTAPA. Industries account for 5% to 11%, 7% to 14%, 10% to 12%, and 18% to 35% of PM2.5 mass concentrations in Kliprivier, Sebokeng, Sharpeville, and Zamdela, respectively.
Wood and biomass burning is an important source identified in both fractions, accounting for 15% to 25% and 6% to 14% of PM10-2.5 mass concentrations in Sharpeville and Zamdela, respectively. The higher contributions in spring for both Sharpeville and Zamdela are consistent with the biomass burning patterns in South Africa, with biomass burning occurring during late winter and early spring.48 Wood and biomass burning accounts for 26% and 17% of PM10-2.5 mass concentrations in Kliprivier and Sebokeng, respectively. In the fine fraction, wood and biomass burning accounts for 72% to 84%, 2% to 13%, 4% to 6%, and 32% to 49% of PM mass concentrations in Kliprivier, Sebokeng, Sharpeville, and Zamdela, respectively. For Kliprivier, Sebokeng, and Sharpeville, the concentrations of the wood and biomass burning source were highest in spring as extensive biomass burning activities take place during August and September.40 Regional transportation also plays a significant role during the same period as biomass burning emissions originating from Zambia, Angola, Mozambique, and Zimbabwe are transported to South Africa.48 In Zamdela, the concentrations of wood and biomass burning in the fine fraction were highest in winter and this could be due to the extensive use of wood by households for space heating. Wood is the main solid fuel source for cooking and space heating in Zamdela.49 Waste burning is an important source of PM in the fine fraction at Zamdela during the summer/autumn period. This source accounted for 20% of PM in the fine fraction.
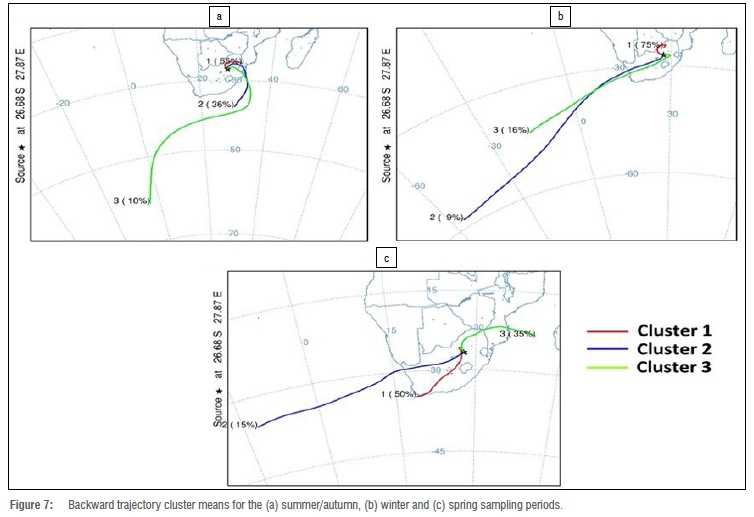
Seasonality of air masses
Table 4 gives a summary of the cluster means and their associated trajectories for each sampling period. As shown in Figure 7, there are three types of air masses associated with the summer/autumn period. The first type of air mass originates from Mozambique and along its pathway passes through mining and industrial areas in the Mpumalanga region. This air mass accounts for the majority (55%) of trajectories arriving at the study site. The high concentrations of PM2.5 observed in Kliprivier, Sharpeville, and Zamdela during the summer/autumn period might be influenced by this air mass. The second (36%) and third (9%) type of air mass originate from the Indian and south Atlantic Ocean, respectively, and both pass through the Mpumalanga region along their trajectories. These air masses are potential contributors of aged sea salt and secondary aerosols in the VTAPA. In winter, three major air masses were identified. Air mass 1, which accounts for 75% of the trajectories, originated within northern South Africa and passed through Botswana and the mining areas of the North West Province via a short pathway, suggesting contributions from both local and regional pollutant sources. This air mass could also account for the high concentrations of PM10-2.5 observed at all sites during winter. Air masses 2 and 3 (accounting for 9% and 16% of trajectories, respectively) arrived from the southwest direction, from the south Atlantic Ocean.

In spring, the study site is influenced by three major air masses. The first air mass, which accounts for 50% of the total trajectories, originates from the Indian Ocean and travels in a northeasterly direction, passing through the agricultural region of the Free State before arriving at the study site. This air mass could have contributed to the high concentrations of PM10-2.5 and PM2.5 observed at all the sample sites during the spring period. The second air mass (which accounts for 15% of trajectories) begins in the south Atlantic Ocean, crosses through the Northern Cape, and then passes over the mining areas of the North West Province, making it a potential contributor of aged sea salt and secondary aerosols in the VTAPA. The third air mass - with 35% of trajectories - originates from the Indian Ocean, crosses into Mozambique, and passes through the mining region of Limpopo along its pathway, suggesting contributions from both local and regional pollutant sources.
Conclusion
PM10-2.5 and PM2.5 aerosol samples were collected for three seasons at four sites in the VTAPA industrial/urban region and were chemically analysed. Elemental and ionic compositions for these samples show an abundance of crustal elements in PM10-2.5 and a predominance of coal and biomass combustion-related elements in pM2.5 at all sites. Eight sources of PM10-2.5 and PM2.5 were resolved and identified using the pMf model and include industry, coal burning, wood and biomass burning, waste burning, dust-related, vehicles, secondary aerosols, and aged sea salt. In the coarse fraction, dust-related and secondary aerosols were the major contributing sources. In the fine fraction, secondary aerosols, coal burning, industry and wood and biomass burning were the main sources of PM.
The present study has demonstrated the importance of source apportionment as a tool in the management of air quality management in the townships of the VTAPA. For Kliprivier, appropriate abatement strategies should focus on reducing emissions from dust, wood and biomass burning, and vehicles. The main emission sources to target in Sebokeng are dust, vehicles, and domestic coal burning. In Sharpeville, the focus should be on reducing emissions from domestic coal burning, dust, industry, and vehicles. Abatement strategies in Zamdela should focus on industry, wood and biomass burning, and dust emission sources. Reducing the strength of these sources will benefit residents in the VTAPA by lowering PM exposure and improving air quality.
Acknowledgements
This research was supported by a public/private partnership which included the South African Department of Environmental Affairs (now the Department of Environment, Forestry and Fisheries) and industry stakeholders in the VTAPA, and was coordinated and implemented by the North-West University Climatology Research Group. The views expressed are those of the authors and not necessarily the funding department. We thank Joe Malahlela for his assistance in the field.
Competing interests
We declare that there are no competing interests.
Authors' contributions
The majority of the work was conducted by L.M. who was responsible for the investigation, data analysis and writing (original draft and conceptualisation). S.J.P was responsible for funding acquisition, supervision and writing (reviewing and editing). R.P.B. was responsible for data curation and writing (reviewing and editing). B.L. was responsible for analysing the data and writing (reviewing and editing). J.P.B. was responsible for analysing the data. PG.v.Z. was responsible for analysing the data. All authors agreed to the submission of the manuscript.
References
1. Amegah AK, Agyei-Mensah S. Urban air pollution in sub-Saharan Africa: Time for action. Environ Pollut. 2017;220:738-743. https://doi.org/10.1016/j.envpol.2016.09.042 [ Links ]
2. Altieri KE, Keen SL. Public health benefits of reducing exposure to ambient fine particulate matter in South Africa. Sci Tot Environ. 2019;684:610-620. https://doi.org/10.1016/j.scitotenv.2019.05.355 [ Links ]
3. Bhanarkar AD, Purohit P Rafaj P Amann M, Bertok I, Cofala J, et al. Managing future air quality in megacities: Co-benefit assessment for Delhi. Atmos Environ. 2018;186:158-177. https://doi.org/10.1016/j.atmosenv.2018.05.026 [ Links ]
4. Norman R, Cairncross E, Witi J, Bradshaw D, South African Comparative Risk Assessment Collaborating Group. Estimating the burden of disease attributable to urban outdoor air pollution in South Africa in 2000. S Afr Med J. 2007;97(7):782-790. [ Links ]
5. Anderson JO, Thundiyil JG, Stolbach A. Clearing the air: A review of the effects of particulate matter air pollution on human health. J Med Toxicol. 2012;8(2):166-175. https://doi.org/10.1007/s13181-011-0203-1 [ Links ]
6. Feng S, Gao D, Liao F, Zhou F, Wang X. The health effects of ambient PM2.5 and potential mechanisms. Ecotoxicol Environ Saf. 2016;128:67-74. https://doi.org/10.1016/j.ecoenv.2016.01.030 [ Links ]
7. Thunis P Clappier A, Tarrason L, Cuvelier C, Monteiro A, Pisoni E, et al. Source apportionment to support air quality planning: Strengths and weaknesses of existing approaches. Environ Int. 2019;130:1-13. https://doi.org/10.1016/j.envint.2019.05.019 [ Links ]
8. Gupta AK, Karar K, Srivastava A. Chemical mass balance source apportionment of PM10 and TSP in residential and industrial sites of an urban region of Kolkata, India. J Hazard Mater. 2007;142(1-2):279-287. https://doi.org/10.1016/j.jhazmat.2006.08.013 [ Links ]
9. Hopke PK. The use of source apportionment for air quality management and health assessments. J Toxicol Environ Health A. 2008;71(9-10):555-563. https://doi.org/10.1080/15287390801997500 [ Links ]
10. Zhu Y Huang L, Li J, Ying Q, Zhang H, Liu X, et al. Sources of particulate matter in China: Insights from source apportionment studies published in 1987-2017. Environ Int. 2018;115:343-357. https://doi.org/10.1016/j.envint.2018.03.037 [ Links ]
11. Engelbrecht JP, Swanepoel L, Chow JC, Watson JG, Egami RT. The comparison of source contributions from residential coal and low-smoke fuels, using CMB modeling, in South Africa. Environ Sci Policy. 2002;5(2):157-167. https://doi.org/10.1016/S1462-9011(02)00029-1 [ Links ]
12. Van den Berg B. Source apportionment of ambient particulate matter in Kwadela, Mpumalanga [MSc dissertation]. Potchefstroom: North-West University; 2015. [ Links ]
13. Tshehla C, Djolov G. Source profiling, source apportionment and cluster transport analysis to identify the sources of PM and the origin of air masses to an industrialised rural area in Limpopo. Clean Air J. 2018;28(2):54-66. https://doi.org/10.17159/2410-972x/2018/v28n2a18 [ Links ]
14. Mathuthu M, Dudu VP Manjoro M. Source apportionment of air particulates in South Africa: A review. Atmos Clim Sci. 2019;9:100-113. [ Links ]
15. South African Department of Environmental Affairs (DEA). The second generation Vaal Triangle Airshed Priority Area Air Quality Management Plan : Draft baseline assessment report. Pretoria: DEA; 2019. [ Links ]
16. South African Department of Environmental Affairs (DEA). The benefits and costs of air quality management. Pretoria: DEA; 2018. [ Links ]
17. South African Department of Environmental Affairs and Tourism (DEAT). Vaal Triangle Air-Shed Priority Area Air Quality Management Plan. Vol. GN32263, Government Gazette. Pretoria: DEAT; 2009. p. 2-239. [ Links ]
18. South African Department of Environmental Affairs (DEA). The Medium Term Review of the 2009 Vaal Triangle Airshed Priority Area: Air Quality Management Plan. Pretoria: DEA; 2013. [ Links ]
19. Thomas RG. An air quality baseline assessment for the Vaal airshed in South Africa [MSc dissertation]. Pretoria: University of Pretoria; 2008. https://repository.up.ac.za/handle/2263/28444 [ Links ]
20. Jalava PI, Wang Q, Kuuspalo K, Ruusunen J, Hao L, Fang D, et al. Day and night variation in chemical composition and toxicological responses of size segregated urban air PM samples in a high air pollution situation. Atmos Environ. 2015;120:427-437. https://doi.org/10.1016/j.atmosenv.2015.08.089 [ Links ]
21. Chandra S, Kulshrestha MJ, Singh R, Singh N. Chemical characteristics of trace metals in PM10 and their concentrated weighted trajectory analysis at Central Delhi, India. J Environ Sci (China). 2017;55:184-96. https://doi.org/10.1016/j.jes.2016.06.028 [ Links ]
22. Hao Y Deng S, Yang Y Song W, Tong H, Qiu Z. Chemical composition of particulate matter from traffic emissions in a road tunnel in Xi'an, China. Aerosol Air Qual Res. 2019;19(2):234-246. https://doi.org/10.4209/aaqr.2018.04.0131 [ Links ]
23. Research Triangle Institute. Standard operating procedure for the X-Ray fluorescence analysis of particulate matter deposits on teflon filters [document on the Internet]. c2009 [cited 2018 May 20]. Available from: http://www3.epa.gov/ttnamti1/files/ambient/pm25/spec/pmxrfsop.pdf [ Links ]
24. Conradie EH, Van Zyl PG, Pienaar JJ, Beukes JP Galy-Lacaux C, Venter AD, et al. The chemical composition and fluxes of atmospheric wet deposition at four sites in South Africa. Atmos Environ. 2016;146:113-131. https://doi.org/10.1016/j.atmosenv.2016.07.033 [ Links ]
25. Paatero IP Eberly S, Brown SG, Norris GA. Methods for estimating uncertainty in factor analytic solutions. Atmos Measure Tech. 2014;7(3):781-797. https://doi.org/10.5194/amt-7-781-2014 [ Links ]
26. Bove MC, Brotto P Calzolai G, Cassola F, Cavalli F, Fermo P et al. PM10 source apportionment applying PMF and chemical tracer analysis to ship-borne measurements in the Western Mediterranean. Atmos Environ. 2016;125:140-151. https://doi.org/10.1016/j.atmosenv.2015.11.009 [ Links ]
27. Chuang MT, Chen YC, Lee C Te, Cheng CH, Tsai YJ, Chang SY et al. Apportionment of the sources of high fine particulate matter concentration events in a developing aerotropolis in Taoyuan, Taiwan. Environ Pollut. 2016;214:273-281. https://doi.org/10.1016/j.envpol.2016.04.045 [ Links ]
28. Crilley LR, Lucarelli F, Bloss WJ, Harrison RM, Beddows DC, Calzolai G, et al. Source apportionment of fine and coarse particles at a roadside and urban background site in London during the 2012 summer ClearfLo campaign. Environ Pollut. 2017;220:766-778. https://doi.org/10.1016/j.envpol.2016.06.002 [ Links ]
29. Vossler T, Cernikovský L, Novák J, Williams R. Source apportionment with uncertainty estimates of fine particulate matter in Ostrava, Czech Republic using Positive Matrix Factorization. Atmos Pollut Res. 2016;7(3):503-512. https://doi.org/10.1016/j.apr.2015.12.004 [ Links ]
30. Gupta I, Salunkhe A, Kumar R. Source apportionment of PM10 by positive matrix factorization in urban area of Mumbai, India. Sci World J. 2012;2012:1-13. https://doi.org/10.1100/2012/585791 [ Links ]
31. Weber S, Salameh D, Albinet A, Alleman LY Waked A, Besombes JL, et al. Comparison of PM10 sources profiles at 15 french sites using a harmonized constrained positive matrix factorization approach. Atmosphere. 2019;10(6):1-22. https://doi.org/10.3390/atmos10060310 [ Links ]
32. Simon H, Beck L, Bhave PV Divita F, Hsu Y Luecken D, et al. The development and uses of EPA's SPECIATE database. Atmos Pollut Res. 2010;1(4):196-206. https://doi.org/10.5094/APR.2010.026 [ Links ]
33. Nyanganyura D, Makarau A, Mathuthu M, Meixner FX. A five-day back trajectory climatology for Rukomechi research station (northern Zimbabwe) and the impact of large-scale atmospheric flows on concentrations of airborne coarse and fine particulate mass. S Afr J Sci. 2008;104(1-2):43-52. [ Links ]
34. Stein AF, Draxler RR, Rolph GD, Stunder BJB, Cohen MD, Ngan F. Noaa's hysplit atmospheric transport and dispersion modeling system. Bull Am Meteorol Soc. 2015;96(12):2059-77. https://doi.org/10.1175/BAMS-D-14-00110.1 [ Links ]
35. Donnelly AA, Broderick BM, Misstear BD. The effect of long-range air mass transport pathways on PM10 and NO2 concentrations at urban and rural background sites in Ireland: Quantification using clustering techniques. J Environ Sci Health A. 2015;50(7):647-658. https://doi.org/10.1080/10934529.2015.1011955 [ Links ]
36. Draxler R, Stunder B, Rolph G, Stein A, Taylor A. HYSPLIT5 user's guide version 4 - Last revision: April 2020 [document on the Internet]. c2020 [cited 2020 Jul 07. Available from: https://www.arl.noaa.gov/documents/reports/hysplit_user_guide.pdf [ Links ]
37. Dall'Osto M, Querol X, Alastuey A, O'Dowd C, Harrison RM, Wenger J, et al. On the spatial distribution and evolution of ultrafine particles in Barcelona. Atmos Chem Phys. 2013;13(2):741-759. https://doi.org/10.5194/acp-13-741-2013 [ Links ]
38. Yu L, Wang G, Zhang R, Zhang L, Song Y Wu B, et al. Characterization and source apportionment of PM25 in an urban environment in Beijing. Aerosol Air Qual Res. 2013;13(2):574-583. https://doi.org/10.4209/aaqr.2012.07.0192 [ Links ]
39. Chen WN, Chen YC, Kuo CY Chou CH, Cheng CH, Huang CC, et al. The real-time method of assessing the contribution of individual sources on visibility degradation in Taichung. Sci Tot Environ. 2014;497-498(110):219-228. https://doi.org/10.1016/j.scitotenv.2014.07.120 [ Links ]
40. Tesfaye M, Sivakumar V Botai J, Mengistu Tsidu G. Aerosol climatology over South Africa based on 10 years of Multiangle Imaging Spectroradiometer (MISR) data. J Geophys Res Atmos. 2011;116(20):1-17. https://doi.org/10.1029/2011JD016023 [ Links ]
41. Okonkwo JO, Awofolu OR, Moja SJ, Forbes PCB, Senwo ZN. Total petroleum hydrocarbons and trace metals in street dusts from Tshwane Metropolitan Area, South Africa. J Environ Sci Health A. 2006;41(12):2789-2798. https://doi.org/10.1080/10934520600966920 [ Links ]
42. Squizzato S, Masiol M, Rich DQ, Hopke PK. A long-term source apportionment of PM25 in New York State during 2005-2016. Atmos Environ. 2018;192:35-47. https://doi.org/10.1016/j.atmosenv.2018.08.044 [ Links ]
43. Park M Bin, Lee TJ, Lee ES, Kim DS. Enhancing source identification of hourly PM25 data in Seoul based on a dataset segmentation scheme by positive matrix factorization (PMF). Atmos Pollut Res. 2019;10(4):1042-1059. https://doi.org/10.1016/j.apr.2019.01.013 [ Links ]
44. Zhao W, Hopke PK. Source apportionment for ambient particles in the San Gorgonio wilderness. Atmos Environ. 2004;38(35):5901-5910. https://doi.org/10.1016/j.atmosenv.2004.07.011 [ Links ]
45. Laskin A, Moffet RC, Gilles MK, Fast JD, Zaveri RA, Wang B, et al. Tropospheric chemistry of internally mixed sea salt and organic particles: Surprising reactivity of NaCl with weak organic acids. J Geophys Res Atmos. 2012;117(15):1-12. https://doi.org/10.1029/2012JD017743 [ Links ]
46. Kruger AC, Pillay DL, Van Staden M. Indicative hazard profile for strong winds in South Africa. S Afr J Sci. 2016;112(1-2), Art. #2015-0094. https://doi.org/10.17159/sajs.2016/20150094 [ Links ]
47. Adesina JA, Piketh SJ, Qhekwana M, Burger R, Language B, Mkhatshwa G. Contrasting indoor and ambient particulate matter concentrations and thermal comfort in coal and non-coal burning households at South Africa Highveld. Sci Tot Environ. 2020;699. https://doi.org/10.1016/j.scitotenv.2019.134403 [ Links ]
48. Hersey SP, Garland RM, Crosbie E, Shingler T, Sorooshian A, Piketh S, et al. An overview of regional and local characteristics of aerosols in South Africa using satellite, ground, and modeling data. Atmos Chem Phys. 2015;15(8):4259-l278. https://doi.org/10.5194/acp-15-4259-2015 [ Links ]
49. Statistics South Africa (Stats SA). Community survey 2016 statistical release-P0301. Pretoria: Stats SA; 2016. [ Links ]
 Correspondence:
Luckson Muyemeki
Email: lucksonmuyemeki@gmail.com
Received: 10 July 2020
Revised: 21 Nov. 2020
Accepted: 22 Nov. 2020
Published: 28 May 2021
Supplementary Data
The supplementary data is available in pdf: [ Supplementary Data ]
Editor: Yali Woyessa
Funding: South African Department of Environment, Forestry and Fisheries

