


Services on Demand
Article
 English (pdf)
 Article in xml format
 Article references
Indicators

Related links
-
 Cited by Google
 -
 Similars in Google
Share

 Permalink
South African Journal of Science
On-line version ISSN 1996-7489
Print version ISSN 0038-2353
S. Afr. j. sci. vol.117 n.5-6 Pretoria May./Jun. 2021
http://dx.doi.org/10.17159/sajs.2021/8399
RESEARCH ARTICLE
Orthopaedic device innovation in South Africa: A study of patenting activity
Faatiema Salie; Kylie de Jager; Tania S. Douglas*
Division of Biomedical Engineering, Department of Human Biology, University of Cape Town, Cape Town, South Africa
ABSTRACT
We assessed knowledge development and exchange among actors who patent orthopaedic devices in South Africa over the period 2000-2015. A social network analysis was performed on bibliometric data using co-inventorship on patents as an indicator of collaboration between different organisations, with a focus on the spatial and sectoral contexts. Network metrics and innovation system indices are used to describe knowledge development and exchange. The results show that university, healthcare and industry organisations have primarily been responsible for increased patenting over time. The key actors were a set of industry actors - a national actor and its US partner - who have patented many devices jointly. National universities were found to make a small contribution, and science councils were found to be absent, despite the efforts in the changing innovation landscape to encourage publicly financed research organisations to protect their intellectual property. The collaboration networks were found to be sparse and disjointed, with many actors - largely from the private healthcare sector - patenting in isolation.
SIGNIFICANCE:
• The considerable number of patents filed by private sector clinicians in orthopaedic device innovation in their personal capacity is highlighted.
• Few patents emanate from national universities, and science council actors are largely absent, despite the Intellectual Property Rights from Publicly Financed Research and Development Act to protect intellectual property emanating from public research organisations.
• Patenting networks are more fragmented than are scientific publication networks.
Keywords: social network analysis, patent, knowledge development, knowledge exchange, innovation system
Introduction
Medical devices have a key role to play in addressing South Africa's burden of disease. South Africa's medical device industry is made up of hundreds of small players yet is dominated by a handful of large multinational corporations, with approximately 90% of all products being imported.1 Of all the domestic medical device companies, 68% are solely distributing imported devices and 26% manufacture devices locally.2 Approximately 90% of the local manufacturers also act as distributors of imported devices, suggesting that it may be difficult to act as a local manufacturer (only) in the current South African market.2 Very little is known about the value of local manufacturing and the products of manufacturers.2 Of the top ten most imported groups of medical devices into South Africa for 2013, four groups were classified as orthopaedic devices, with a combined value of ZAR1.8 billion. Of the top ten most exported medical devices, only one group was classified as orthopaedic devices, with a value of ZAR50 million. These figures highlight the substantial value of orthopaedic devices imported into South Africa and show some local activity in the development of such devices by the domestic market. While manufacture exclusively for the local medical device market would not be represented in these figures, local manufacturing activity appears to be limited. Addressing this imbalance would require identifying opportunities that might exist to expand orthopaedic device innovation in South Africa, which in turn requires an understanding of the current activity in this area.
One way of assessing innovation activity is through the analysis of patents. Because patents must show novelty, they have been used as an economic indicator of the rate and direction of technological progress and innovation.3,4 The number of patents filed by an organisation or country has been adopted as a measure of the amount of technological knowledge produced.5,6
Fleming and Marx7 illustrated that collaborations recorded in patent data captured personal and professional ties between inventors. Co-inventors may have collaborated intensively over extended periods of time towards novel inventions.8 Patents, therefore, serve as tools indicative of a collaborative event9 and could be exploited to map social ties between inventors10. Several authors have used co-inventorship of patents as a proxy for collaboration. Balconi et al.9 linked co-inventors of patents in a network and derived implications for knowledge exchange, with a focus on technology transfer resulting from university-industry interactions. Patra and Muchie11 mapped the entrepreneurial and collaborative activity of South African universities using joint patents as an indicator of collaboration.
Literature applying social network analysis to data from scientific publications, patents, or a combination of both, is abundant. In the latter, the focus is often on the translation of basic science to commercialising technologies. Within this body of literature, work on medical device development is limited. One such study is that of Murray12, who investigated the communication between science and technology networks in cartilage tissue engineering. Additionally, the literature on medical device innovation is scant. One such study is by MacPherson13 who investigated the impact of academic linkages on the innovation performance of medical device manufacturers in New York City. A direct link was found between innovation propensity and the existence of both formal and informal academic linkages, with radical innovations more associated with academic linkages than incremental innovations. In-house research and development, however, was found to be the strongest factor for product development than any other; positive correlates for innovation were also found with investment in university partnerships, collaboration with other industry actors, proximity to university resources, and patent counts.
The scientific base for orthopaedic device innovation in South Africa was previously investigated in its spatial and sectoral contexts for the period 2000-2015.14 That study applied a technological innovation system (TIS) framework15 and explored scientific knowledge development and exchange among actors. Social network analysis on bibliometric data of scientific publications, where co-authorship was used as an indicator of collaboration between organisations, showed that scientific knowledge production increased over time; this knowledge production was due largely to activity by national university and national healthcare actors. Scientific collaboration networks were sparse, indicating barriers to knowledge exchange among actors in the network. One of the limitations of that study is that collaboration networks derived from scientific publications favour sectors that publish scientific output, i.e. universities and academic healthcare facilities. Outputs such as patents may better represent collaboration trends in the industry sector.
In this study, we further investigate knowledge development and exchange in the orthopaedic device TIS in South Africa by focusing on its technological knowledge base. The actors in the orthopaedic device innovation system are identified using bibliometric data from patents and are related using co-inventorship as a proxy for collaboration. Using social network analysis techniques, we quantify relationships between actors and characterise knowledge exchange in the networks. Our aim was to answer the following questions:
1. Who are the actors actively patenting within the orthopaedic device innovation system in South Africa?
2. From which sectors and countries do the actors come, and what is the nature of their inter-sectoral and international collaboration?
3. What overlap, if any, exists between the scientific and technological domains of orthopaedic device innovation in South Africa?
Methods
Data sources
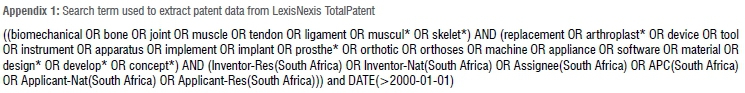
A definition developed for an orthopaedic medical device14 was adopted for this study to develop a search phrase (Appendix 1) used in TotalPatent from LexisNexis to elicit patents that demonstrate orthopaedic device innovation. The search was performed for patents with a priority date between 1 January 2000 and 31 December 2015.
Each patent retained in the data set had to show evidence of orthopaedic device development, with the primary inclusion criterion of at least one inventor listing a South African address. On patents, inventors are only required to provide a full name and an address, thus patent data do not link the inventors to their organisational affiliations. To overcome the biographical shortcomings of patents, a series of steps was followed to determine the affiliation of the inventor at the patent priority date and to extrapolate inventor data to organisational data:
1. The inventor name was cross-checked against names of authors in the scientific publication data set of Salie et al.14 If the inventor was also an author of a scientific publication published at the time of patenting, the affiliation listed on the scientific publication was used. This approach is similar to that of Tijssen16 who matched inventor names to authors of scientific publications in the Science Citation Index database and had success in finding affiliations for inventors who were active in science-based technical areas. 'At the time of patenting' refers to a 1-year window with the priority date at its centre.
2. A Google Scholar search of the inventor was performed. If the inventor had a Google Scholar profile listing their publications, the publications were screened to retrieve all affiliations within 1 year of the priority date of the patent.
3. A LinkedIn search of the inventor was performed. If the inventor had a LinkedIn profile, the 'Experience' section of the inventor's profile was viewed to establish their affiliation at the priority date of the patent.
4. A Google search of the inventor was performed. Google searches often resulted in links to social and academic networking platforms, including Facebook and ResearchGate. In the case of clinicians, often the clinician's practice would be found. In these instances, inventors were contacted (via email, social and academic networking messaging platforms, or phone calls) to confirm their affiliations at the priority date of the patent. While clinicians in South Africa may not be employed by private hospital groups, in this social network analysis, inventors were affiliated to these organisations if they practised therefrom.
5. Where multiple affiliations were retrieved per inventor in the above steps, all affiliations for that inventor were captured. This might result in links between multiple organisations due to the activity of one inventor.
A patent is applied for and granted at different times. Hinze and Schmoch17 suggest that the patent priority date be used in patent analysis as this date is most closely related to the time of invention. The patent family must also be considered in patent analysis. A patent family contains a set of patent documents that refer to the same technical topic.5 In this study, patent families were considered as a unit and inventor affiliations at the priority date recorded.
Drawing actor collaboration networks
Collaboration networks were generated using UCINet 6 (Version 6.573)18 and NetDraw (Version 2.152)19. Each node in the network is an organisation to which an inventor is affiliated; co-inventorship, at the organisational level, is indicated by an edge between nodes.
Each node was assigned to one of the following four sectors:
1. Healthcare, which includes hospitals, clinics and specialised healthcare facilities.
2. University, which includes higher education organisations such as universities, universities of technology, colleges, etc.
3. Science council, which includes research organisations other than universities.
4. Industry, which includes individuals and organisations whose goal is to take products to market, usually for profit.
Each organisation appearing on a patent has been counted only once, regardless of the number of inventors affiliated with that organisation. Where one inventor was affiliated with several organisations, a link was created between these organisations.
The networks have been drawn in overlapping 5-year moving windows, from 2000-2004 to 2011-2015; there are a total of 12 time frames in this period. This 5-year window period was adopted from Eslami et al.20, who assumed the lifespan of network links based on co-authorship to be 5 years, given that information exchange takes place for some time during a collaboration.
Network metrics
The degree centrality21 is calculated as the number of ties between a given node and other nodes in the network, including self-reflecting ties. Degree centrality serves as an indicator of how active the node is. In this study, normalised degree centrality is reported, as in Equation 1, where the node's degree, u(y), is divided by the maximum possible degree in the network, umax.

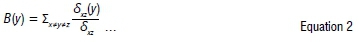
Betweenness centrality22 of a node is a measure of how influential that node is in transmitting information across the network. It indicates how often a node (y) lies on the shortest path (δxz(y)) between the paired combination of all other nodes (x and z) in the network, divided by the total number of node pairs, as shown in Equation 2.22
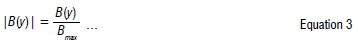
The normalised betweenness centrality is the node's betweenness centrality divided by the maximum possible betweenness of the network, and is reported as a percentage18, as in Equation 3:
Nationalisation index
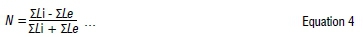
Binz et al.23 present metrics and typologies to analyse networks spatially. In this study, their nationalisation index, which measures the dominance of national over international ties, was calculated. It is based on the external-internal (E-I) index by Krackhardt and Stern24 and is defined as the ratio of links among actors inside one country to links with actors outside that country. The nationalisation index, N, is given by Equation 4, where the number of ties among South African actors, Li, is compared to the number of ties South African actors have with actors in other countries, Le.
If most actors are cooperating in a national context, the index would be positive and tend towards 1. If national and international cooperation are equally present, the index would be close to 0. If international cooperation is dominant, the index would be negative, and tend towards -1.
Sectorisation index
The sectorisation index14 is an adaptation of the Binz et al.23 nationalisation index. The sectorisation index compares the number of collaborations between South African actors within the same sector (i.e. universities, healthcare, industry or science councils), si, to that with South African actors outside the sector, se. This metric, shown in Equation 5, is calculated separately for each sector.

This index measures the dominance of intra-sectoral collaboration over inter-sectoral collaboration. If most actors are participating in intra-sectoral collaboration, the index would be positive and tend towards 1. If intra- and inter-sectoral collaboration are equally present, the index would be close to 0. If inter-sectoral collaboration is preferred, the index would be negative, and tend towards -1.
Results
The TotalPatent search yielded 1926 results. Patents were manually examined to extract those related to orthopaedic devices which had a priority date between 1 January 2000 and 31 December 2015, and at least one inventor with a South African address. A total of 73 patents met all these criteria and were retained.
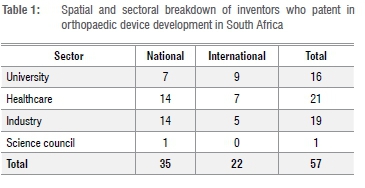
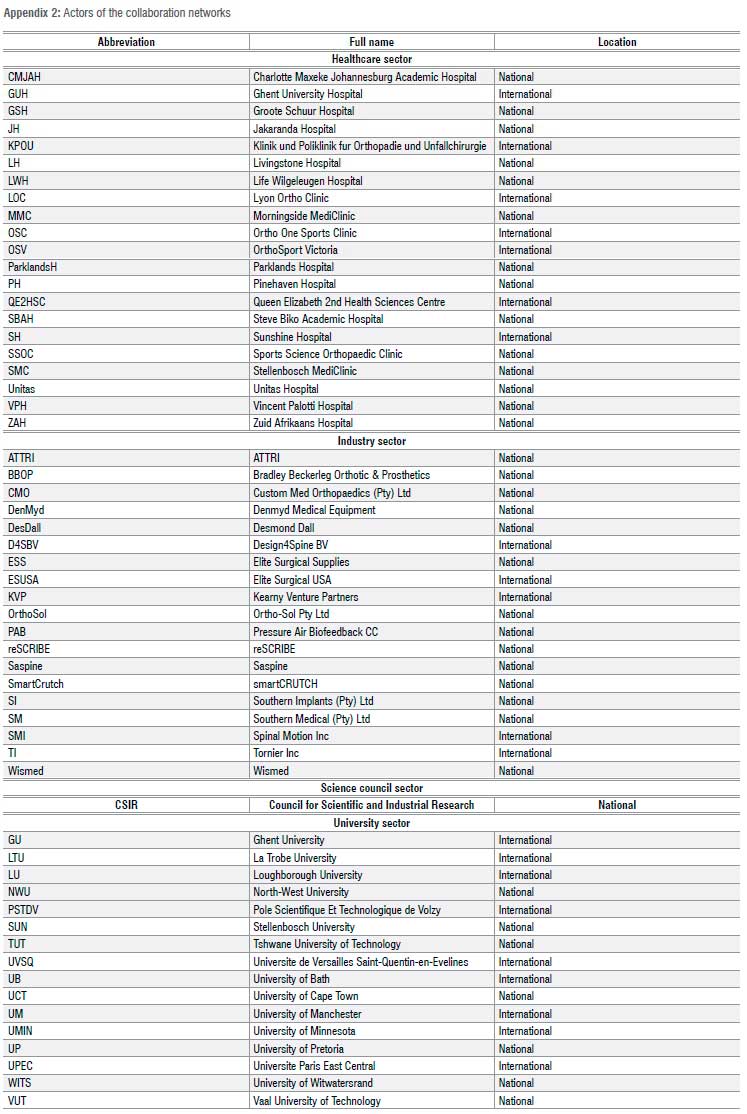
Inventor affiliation data for 11 of the 73 patents could not be established. For some inventors, no Internet presence was found. For some patents, affiliation data for some of the inventors, but not all, were obtained. These patents were excluded from the data set. The results reported in this study are from 62 patents filed between 2000 and 2015. A total of 57 organisational actors were identified; Table 1 presents a spatial and sectoral breakdown of the actors. Of these actors, 35(61%) are South African. The organisations are represented in fairly equal numbers from the university, healthcare and industry sectors. National and international university actors are represented in similar numbers. The number of national healthcare and industry actors present is twice that of their international counterparts.
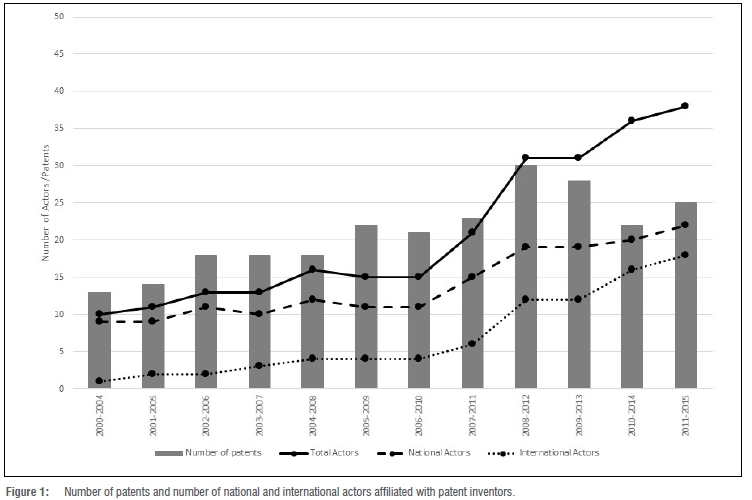
For the period 2000-2015, 12 overlapping time frames in 5-year moving windows were assessed, starting from 2000-2004 (first time frame) and ending at 2011-2015 (12th time frame). For each time frame, the number of national and international actors and the patents for that period were counted (see Figure 1). There is a gradual increase in the number of patents produced by actors as time progresses, peaking in the ninth (2008-2012) time frame. The total number of actors increases over time; the number of national actors is always greater than the number of international actors. There is a relatively large increase in the number of international actors from the eighth to the ninth time frame (2008-2012).
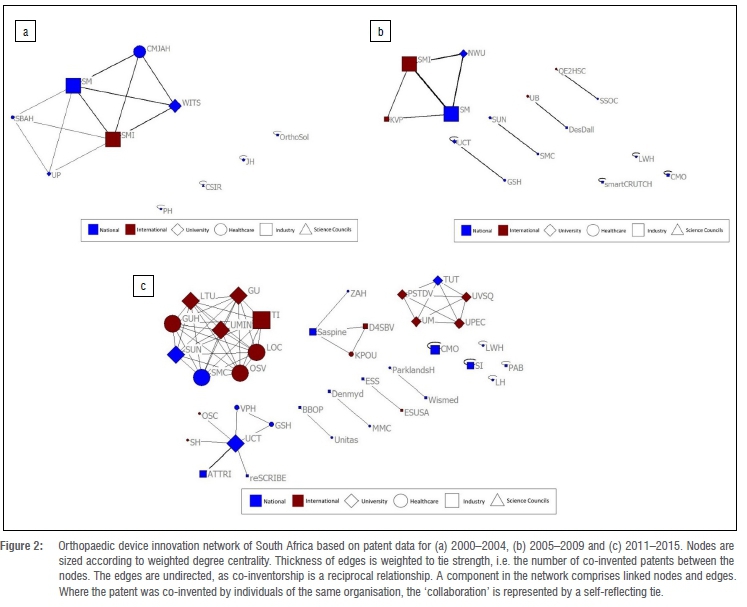
Selected time frames of the orthopaedic device innovation network are presented in Figure 2. Each actor is represented by a node in the network. Full names of the actors along with their abbreviations are presented in Appendix 2. The actor networks for all 12 time frames are available in the supplementary material to this article.
In the 2000-2004 time frame (Figure 2a), 13 patents were produced by inventors affiliated to 10 organisations. In this time frame, only one international organisation is present - Spinal Motion Inc. (SMI). SMI was, at the patent priority date, an US partner to domestic company Southern Medical (SM). The network component to which SMI and SM belong was largely involved in the development of spinal disc arthroplasty. The other components in the first time frame represent patents arising from individual organisations without collaborators. In the 2005-2009 time frame (Figure 2b), 22 patents were produced by inventors affiliated with 15 organisations. The SM/SMI component has evolved - some previous actors have disappeared, and new actors appear. The patents of this component comprise inventions in spinal fusion devices and disc and lower-arm arthroplasty. The rest of the network comprises either single-node or two-node groups, in which the inventors were either from a single organisation or from two different organisations, or a single inventor was affiliated with two organisations. An example is the UCT/GSH component, where the (single) inventor is affiliated to both the University of Cape Town (UCT) and one of its academic hospitals, Groote Schuur Hospital (GSH). The 2011-2015 time frame (Figure 2c) comprises 25 patents from inventors affiliated with 38 organisations. CMO (Custom Med Orthopaedics), which appears as a single node, has multiple patents for orthopaedic instrumentation. Three components in this network have greater international than national presence - inventor(s) from Saspine are collaborating with inventors affiliated with international healthcare and international industry organisations; inventor(s) from Tshwane University of Technology (TUT) are collaborating with inventors affiliated with international universities; and inventors from Stellenbosch University (SUN) and Stellenbosch MediClinic (SMC) are collaborating with inventors affiliated with international universities, healthcare facilities and industry organisations. While UCT appears to have a central role in this network, it is largely in that position because of the dual affiliations of its inventors.
Across all time frames, there are inventors who chose to patent in isolation. Apart from the Council for Scientific and Industrial Research (CSIR), these inventors are largely from the national healthcare and national industry sectors. These isolated inventors from the national healthcare sector are almost exclusively affiliated with private healthcare facilities, including Netcare Jakaranda Hospital (JH), Life Wilgeleugen Hospital (LWH), Netcare Pinehaven Hospital (PH), Netcare Parklands Hospital (ParklandsH), Netcare Unitas Hospital (Unitas) and Zuid-Afrikaans Hospital (ZAH). The network contains many actors who have patented only once. On the other end of the spectrum, there are a few actors who have patented many inventions. SM/SMI contributed to 21 of the 62 patents (34%); their parent company, Southern Implants (SI), contributed to a further three patents. CMO contributed to six patents. This is consistent with Balconi et al.9, who found that very few inventors produce a high number of patents, most producing just one.
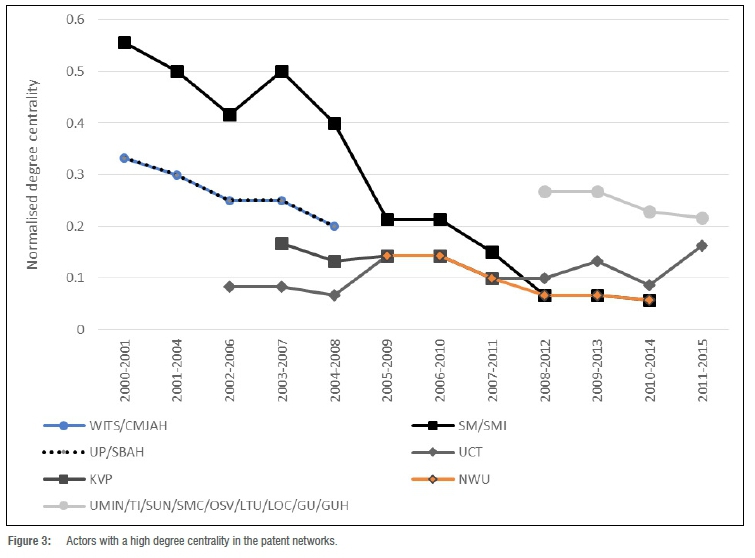
Figure 3 presents the evolution of high degree centrality actors of the patent network over the 12 time frames. If an actor's degree was among the top three in any time frame, its degree centrality over all 12 time frames is reported. In some cases, pairs/groups of actors are presented because in some instances the nodes are solely due to the dual affiliations of the inventors, as in the case of WITS/CMJAH and UP/ SBAH, or in other cases, inventors have worked together on multiple patents and some have dual affiliations. This is the case for SM/SMI. SM/SMI are high degree actors for the first eight time frames, with their degree centrality decreasing over time. WITS/CMJAH and UP/SBAH are high degree actors in the first five time frames. Their degree centrality values are identical and decreasing. These pairs are only present in the first five time frames and result from university-affiliated clinicians who have co-invented patents with the SM/SMI pair. Nine actors - UMIN, TI, SUN, SMC, OSV, LTU, LOC, GU and GUH - are high degree actors in the last four time frames. They collaborated on a 2013 patent for a set of femoral implants for knee prosthesis and form the largest number of co-inventors listed on a patent in the data set.
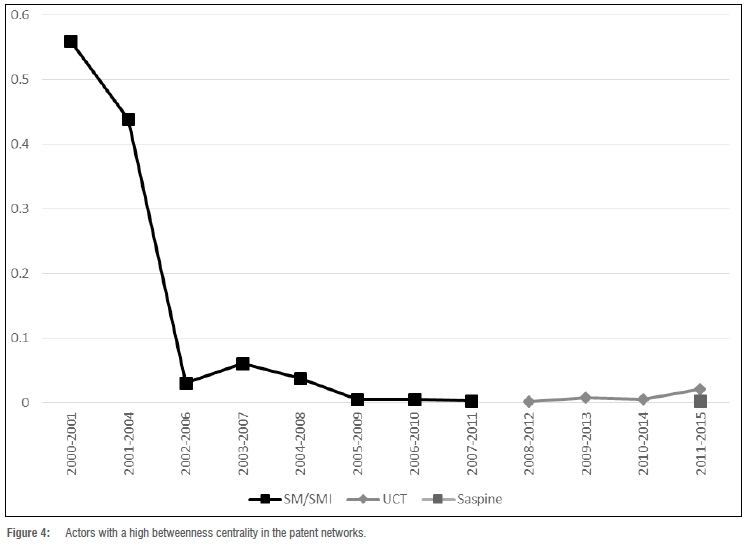
Figure 4 presents the evolution of actors having high betweenness centrality. In the entire period, only four actors have betweenness centrality. This includes the SM/SMI pair, UCT and Saspine. The potential of these actors to influence the network is limited to the component in which they operate; the networks remain fragmented across all time frames, limiting knowledge flow.
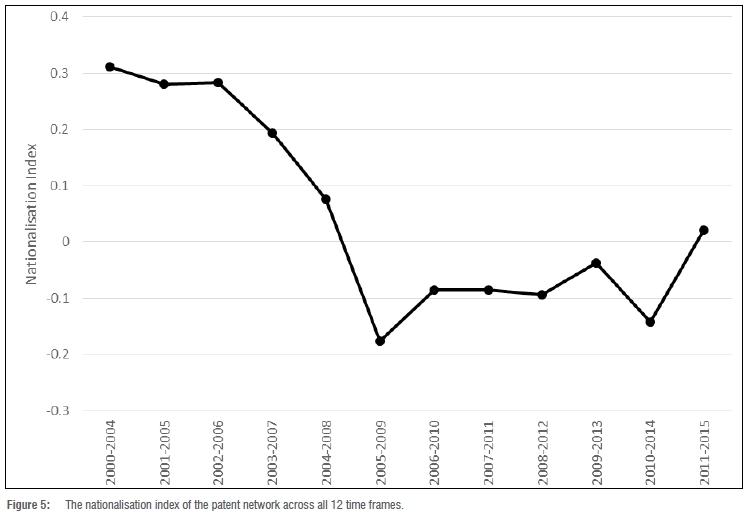
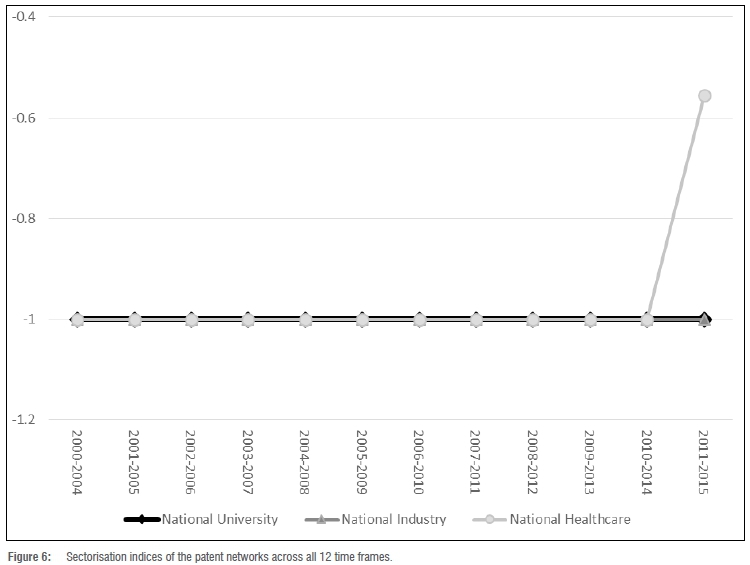
The nationalisation index of the patent network is presented in Figure 5. The nationalisation index is positive for the first Ave time frames, but it is ever decreasing. As the network grows, the collaborations become more internationalised, with a negative index between the sixth (2005-2009) and the 11th (2010-2014) time frames. Beyond the fifth time frame, the index increases to zero, and then eases into the positive, suggesting that collaborations become nationalised again. However, the index is very close to zero beyond the seventh time frame, suggesting that the collaborating actors do not show any preference between national and international collaborations. The sectorisation index is presented in Figure 6. Overall, collaborating actors from the national university and industry sectors are largely involved in inter-sectoral collaboration with other national organisations. Across all time frames, the national university and industry actors do not participate in intra-sectoral collaboration with other national actors. This is also the case for the national healthcare sector, except in the very last time frame, where there is a link between two national healthcare actors, GSH and VPH.
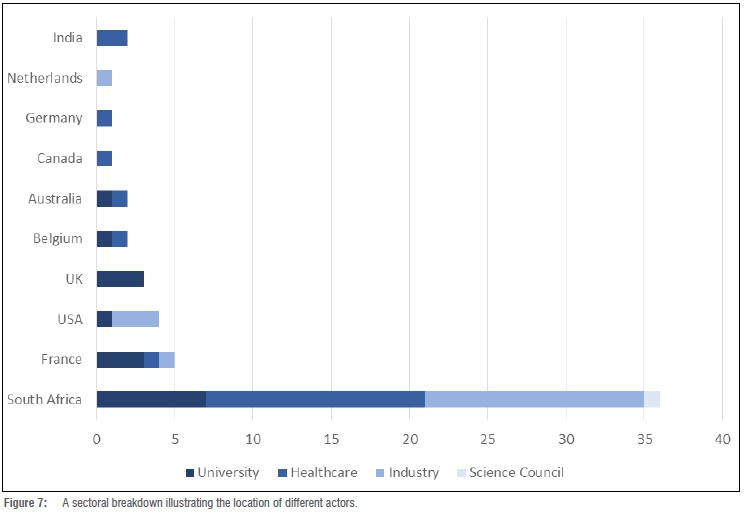
Figure 7 illustrates the countries of origin of the actors from different sectors. The actors are from nine different countries, namely France, the United States of America, the United Kingdom, Belgium, Australia, India, Canada, Germany, and the Netherlands.
Discussion
In this study, we have investigated technological knowledge development in the orthopaedic devices TIS in South Africa using patent bibliometric data, identified the actors who are patenting orthopaedic devices, and explored knowledge exchange dynamics by drawing collaboration networks using co-inventorship as a proxy for collaboration. The university, healthcare and industry actors were found to be present in almost equal amounts overall; however, closer examination (Figure 7) reveals that at a geographic level there is greater distinction between actors from different sectors.
Only one science council actor, the CSIR, appears early in the network, contributing to a single patent. Seven national university actors appear in the patent networks. However, the number of inventors affiliated with national universities in any given time frame is very low - the highest number being four. Patenting from national universities prior to the Intellectual Property Rights from Publicly Financed Research and Development Act was low, with a total of only 24 patents emanating from national universities in 2008.25 By 2015, universities accounted for 14% of the South African portfolio of patents.11 In contrast, national university actors have produced many scientific publications related to orthopaedic device development.14 Academics may not be incentivised to patent as they are incentivised to produce scientific publications. Academics would be listed as inventors on university patents and earn royalties therefrom. Incentives available to produce scientific publications may bring more immediate gain, in the form of promotion and the publishing subsidy in the Research Output Policy of the Department of Higher Education and Training (DHET). The DHET has changed the incentive structure, effective in the 2021-22 financial year, to give equal weighting to patents and scientific publications as recognised research outputs for which universities may earn subsidies.26
During our period of study, another change occurred in the institutional landscape for innovation in South Africa in the form of the Intellectual Property Rights from Publicly Financed Research and Development Act, Act 51 of 2008. This Act led to the establishment of the National Intellectual Property Management Office (NIPMO) and the Intellectual Property Fund in South Africa. The Act provides for more efficient utilisation of intellectual property resulting from publicly financed research and development, and for the establishment of technology transfer offices (TTOs) at publicly financed research organisations (e.g. universities and science councils).
Public organisations like universities, academic hospitals and science councils are bound by the Act, while the Act does not apply to private sector actors from the healthcare and industry sectors. In a study be Ncube et al.27, one university warned that provisions in the Act would result in a loss of industry-contracted research due to requirements for permissions from NIPMO and the uncompetitive nature of the full-cost model, while another university considered the full-cost model a necessary approach to university-industry collaboration. According to the full-cost model, if a private entity or organisation covers the full cost (both direct and indirect) of research and development in collaboration with a public research organisation, the project is not considered to be publicly financed, and the provisions of the Act no longer apply.28
The Act and its Regulations have been criticised for their approach to IP protection, which may present obstacles to scholarly publishing.29 Rapid publication of new research relating to potentially patentable inventions may be delayed to prevent compromising the novelty requirement for patentability; routine delays may affect scientific publication rates, making South African academics less competitive in open knowledge exchange.27 The effects of the Act appear (as yet) to not have increased knowledge production in the innovation system. It may, however, have changed actor behaviour. As an example, university-affiliated clinicians (from UP/SBAH and WITS/CMJAH) who collaborate in the SM/SMI components, had their pre-2008 patents assigned to the SM/SMI conglomerate. These patents may not have been affected by initiatives undertaken by universities to promote patenting. The inventors who have gone through national university channels to patent, i.e. where the university was the assignee on the patent, include those from SUN, VUT, TUT and UCT. All these patents have been filed since 2008. These examples suggest that the full effects of the Act may yet become visible in the South African university environment, with university-affiliated inventors responding to incentives to patent, and more patents, which may have been assigned to industry collaborators in earlier times, being assigned to universities. While conflicts between patenting and scholarly publishing are anticipated, Patra and Muchie11 showed that those national universities who are actively publishing, are also actively patenting. However, patenting was at a lesser degree, with South African universities accounting for 90% of scientific publications emanating from South Africa but for only 14% of South Africa's patent portfolio.
In addition, inventors make up a small proportion of academics30 and a large proportion of university research is not performed with commercialisation in mind25,31.
Each of the national university actors has formalised structures for the protection of IP emanating from university research. In the UCT component, the UCT/GSH link is due to university-affiliated clinicians who have patented in their own capacity, even though the clinician was affiliated with both organisations. This presents an opportunity for university TTOs to identify inventions by university employees, create an entrepreneurial culture among university-affiliated clinicians (and the university at large), and encourage employees to disclose inventions to the university and pursue university IP processes. Owen-Smith and Powell32 found that a crucial first step in the university environment is creating an entrepreneurial culture among academics and convincing academics to disclose their potentially valuable innovations to the TTOs. In South African universities, successful technology transfer efforts lie in proactive engagement by the TTOs with inventors25 and effective and trustworthy relationships between TTO staff and inventors33.
The number of clinicians from the private healthcare sector in the orthopaedic device innovation system who patent in their own capacity is noteworthy. Of the 14 national healthcare actors present in the network, 10 are from the private healthcare sector. The private healthcare sector inventors largely operate on their own, or with one other actor, and contribute to the large number of components in the network (SMC is the exception). These inventors are largely from the three big private healthcare providers in South Africa, i.e. Netcare Group, Life Healthcare and Mediclinic. Medical practitioners are not employed by the private healthcare groups in South Africa.34 Yet opportunities may exist for private healthcare groups to facilitate and serve as partners in innovations by clinicians affiliated with the private healthcare group.
In the patent networks, 14 national industry actors (11 not previously identified in the scientific publication network) and five international industry actors (four not previously identified in the scientific publication network) were identified. These national industry actors are largely Small, Medium and Micro Enterprises; two of these are university spin-outs, both from UCT. Of the international industry actors, Tornier Inc. (TI), now merged with Wright Medical Group to form Wright Medical Group N.V.35, is the only large corporation.
The sectorisation index shows that, of those actors who do co-invent, national intra-sectoral collaboration is absent. Intra-sectoral collaboration takes place between national and international actors in the patent network, but not within South Africa. The presence of intra-sectoral collaboration at an international scale, and not a national scale, suggests some benefit offered by international ties within the same sector over national ties. These could include access to foreign markets, access to different patient demographics, access to specialised infrastructure and resources, and access to patenting expertise. Patra and Muchie11 found that approximately 20% of South African university patents were collaborative. Approximately 40% of these collaborative patents were with national science council actors, and approximately 17% were with international multinational companies. Joint patents with national industry actors were very low. Because knowledge is a localised phenomenon, knowledge exchange among the same set of co-located actors loses value over time as information and the recombination thereof fades36; collaboration with outside partners becomes important to prevent over-embeddedness37. As Breschi and Lenzi37 caution, patent data capture only a subset of links relevant to knowledge exchange, although the network of collaborators is the most immediate and influential environment from which inventors draw ideas and information.
A total of 23 organisations appear in both the scientific publication14 and the patent networks - 8 from the healthcare sector, 1 science council, 11 universities and 3 from the industry sector. Many, but not all, organisations that appear in both networks, have the author and inventor as the same person. This suggests some translation of scientific knowledge to commercial applications, which is demonstrated in the presence of some patent-paper pairs in the networks, i.e. the same idea described in different ways, resulting in a patent and journal paper.12 The paper would usually describe experimental results, whereas the patent would define utility and claims of inventiveness. Examples of such pairs from the university sector include a paper and a patent of the TUT component on a mechatronic system for assisting an individual to attain a standing position. In the scientific network, some of these TUT component inventors co-author a series of papers on the biomechanics of knee and ankle trajectories. The inventors of a patent in this network by the SUN/SMC pair on the method for designing a knee prosthesis, are co-authors of several papers on the development and testing of patient-specific knee implants. There are several such examples, and it is evident that the orthopaedic device innovation network arises from the interaction between the science and technology spheres. Murray12 showed that, for cartilage tissue engineering, a few key scientists produced both publications and patents, and that industry actors had limited participation in scientific publications. Interviews conducted for Murray's12 study, highlighted overlap between scientific publication and patent networks, not captured in bibliometric data. Reasons for this overlap included the involvement of key scientists in technology development, forming start-up companies, consulting, mentoring and providing informal advice. Through these activities, scientists become active participants in both the scientific and the technical community. Nonetheless, our patent network analysis has identified actors, especially those in the industry sector, who were not identified in the publication network14, including key contributors to the technological knowledge base.
Limitations
Of the 73 patents identified, 11 were omitted from the analysis as a result of incomplete inventor affiliation data. This means that many organisational actors may not have been identified. The second limitation of this study is that the organisational affiliations associated with each inventor relied on the methodology described. The multiple affiliations of the inventor captured at the priority date may not have been associated with work carried out at all of those organisations; this may result in the network presenting collaborative ties where there were none, or where there were no formal ties. In the absence of a more robust system of establishing affiliation from patent bibliographic data, the methodology presented here is a start to understanding these collaborative activities at an organisational level.
Patenting only reveals a subset of activity towards technological development.10 Supportive investigations such as case studies would reveal other collaborative activity, might clarify organisational affiliations of actors, and could contribute to a more comprehensive picture of knowledge development and exchange toward technological development for orthopaedic device innovation.
Conclusion
The goal of any innovation system is to develop, apply and diffuse new technological knowledge. In this study, the organisations contributing to the technological knowledge base through patenting of orthopaedic devices in South Africa, and the sectors to which they belong, have been identified and the nature of the relations among them have been characterised. While patenting in the TIS has increased over time, knowledge exchange among actors in the network is limited.
The patent network complements the scientific publication network described by Salie et al.14 Notable differences between the two networks is the small patenting contribution of national university actors, who were the main contributors of scientific knowledge production, as well as the significant contribution made by private healthcare actors patenting in isolation. The results presented in this study would be enhanced by further exploration of the knowledge functions to capture the factors that promote and hinder knowledge exchange in the TIS and the ties that are not expressed through patent co-inventorship. One such avenue for investigation may be the strength of inter-sectoral ties as expressed, for example, through licensing of university inventions to industry (both local and international). Another avenue to explore is the institutional support for healthcare actors, who have proven to be worthy contributors to both scientific and technological knowledge production in the TIS but are outliers in the innovation system.
Acknowledgements
This work was supported by the Community Engagement Programme of the South African National Research Foundation (NRF; grant no. 82624) and the South African Research Chairs Initiative of the Department of Science and Innovation and the NRF (grant no. 98788).
Competing interests
We declare that there are no competing interests.
Authors' contributions
All authors contributed to conceptualisation of the project. T.S.D. led and managed the project. F.S. and K.d.J. developed the methodology. F.S. collected and analysed the data and wrote the initial draft. All authors contributed to the writing of the final manuscript.
References
1. Deloitte. Research to guide the development of strategy for the medical devices sector of South Africa - Prepared in Partnership with the dti [document on the Internet]. c2014 [cited 2020 Feb 09]. Available from: http://www.samed.org.za/DynamicData/LibraryDownloads/60.pdf [ Links ]
2. Trade & Industrial Policy Strategies. The Johannesburg Health Cluster [document on the Internet]. c2018 [cited 2019 May 30]. Available from: http://www.tips.org.za/research-archive/trade-and-industry/item/3530-the-johannesburg-health-cluster [ Links ]
3. Andersen B. Paradigms and trajectories of technological opportunities 18901990. In: Moed H, Glanzel W, Schmoch U, editors. Handbook of quantitative science and techology research - The use of publication and patents statistics in studies of S&T systems. Dordrecht: Kluwer Academic Publishers; 2004. p. 133-162. [ Links ]
4. Park G, Park Y On the measurement of patent stock as knowledge indicators. Technol Forecast Soc Change. 2006;73:793-812. https://doi.org/10.1016/j.techfore.2005.09.006 [ Links ]
5. Organisation for Economic Co-operation and Development (OECD). Special issue on new science and technology indicators [document on the Internet]. c2001 [cited 2020 May 15]. Available from: https://www.oecd.org/sti/37124998.pdf [ Links ]
6. Lach S. Patents and productivity growth at the industry level: A first look. Econ Lett. 1995;49:101-108. https://doi.org/10.1016/0165-1765(94)00618-C [ Links ]
7. Fleming L, Marx M. Managing creativity in small worlds. Calif Manage Rev. 2006;48(4):6-27. https://doi.org/10.2307%2F41166358 [ Links ]
8. Singh J. Collaborative networks as determinants of knowledge diffusion patterns. Manage Sci. 2005/51(5):756-770. https://doi.org/10.1287/mnsc.1040.0349 [ Links ]
9. Balconi M, Breschi S, Lissoni F. Networks of inventors and the role of academia: An exploration of Italian patent data. Res Policy. 2004;33:127-145. https://doi.org/10.1016/S0048-7333(03)00108-2 [ Links ]
10. Breschi S, Lissoni F. Knowledge networks from patent data: Methodological issues and research targets. In: Moed H, Glanzel W, Schmoch U, editors. Handbook of quantitative science and techology research - The use of publication and patents statistics in studies of S&T systems. Dordrecht: Kluwer Academic Publishers; 2004. p. 613-643. [ Links ]
11. Patra SK, Muchie M. Research and innovation in South African universities: From the triple helix's perspective. Scientometrics. 2018;116:51-76. https://doi.org/10.1007/s11192-018-2764-0 [ Links ]
12. Murray F. Innovation as co-evolution of scientific and technological networks: Exploring tissue engineering. Res Policy. 2002;31:1389-1403. https://doi.org/10.1016/S0048-7333(02)00070-7 [ Links ]
13. MacPherson A. The contribution of academic-industry interaction to product innovation: The case of New York State's medical devices sector. Pap Reg Sci. 2002;81:121-129. https://doi.org/10.1007/s101100100102 [ Links ]
14. Salie F, De Jager K, Dreher C, Douglas T. The scientific base for orthopaedic device development in South Africa: Spatial and sectoral evolution of knowledge development. Scientometrics. 2019;119(1):31-54. https://doi.org/10.1007/s11192-019-03041-y [ Links ]
15. Hekkert MP Suurs RAA, Negro SO, Kuhlmann S, Smits REHM. Functions of innovation systems: A new approach for analysing technological change. Technol Forecast Soc Change. 2007;74:413-432. https://doi:10.1016/j.techfore.2006.03.002 [ Links ]
16. Tijssen R. Measuring and evaluating science-technology connections and interactions. In: Moed H, Glanzel W, Schmoch U, editors. Handbook of quantitative science and techology research - The use of publication and patents statistics in studies of S&T systems. Dordrecht: Kluwer Academic Publishers; 2004. p. 694-715. [ Links ]
17. Hinze S, Schmoch U. Opening the black box: Analytical approaches and their impact on the outcome of statistical patent analyses. In: Moed H, Glanzel W, Schmoch U, editors. Handbook of quantitative science and techology research - The use of publication and patents statistics in studies of S&T systems. Dordrecht: Kluwer Academic Publishers; 2004. p. 215-235. [ Links ]
18. Borgatti S, Everett M, Freeman L. Ucinet for Windows: Software for social network analysis. Harvard, MA: Analytic Technologies; 2002. [ Links ]
19. Borgatti S. Netdraw software for network visualisation. Lexington, KY: Analytic Technologies; 2002. [ Links ]
20. Eslami H, Ebadi A, Schiffauerova A. Effect of collaboration network structure on knowledge creation and technoogical performance: The case of biotechnology in Canada. Scientometrics. 2013;97(1):99-119. https://doi.org/10.1007/s11192-013-1069-6 [ Links ]
21. Hanneman R, Riddle M. Introduction to social network methods. Riverside, CA: University of California; 2005. [ Links ]
22. Batool K, Niazi M. Towards a methodology for validation of centrality measures in complex networks. PLoS ONE. 2014;9(4):1-14. https://doi.org/10.1371/journal.pone.0090283 [ Links ]
23. Binz C, Truffer B, Coenen L. Why space matters in technological innovation systems - Mapping global knowledge dynamics of membrane bioreactor technology. Res Policy. 2014;43:138-155. https://doi.org/10.1016/j.respol.2013.07.002 [ Links ]
24. Krackhardt D, Stern R. Informal networks and organizational crises: An experimental simulation. Soc Psychol Q. 1988;51(2):123-140. https://doi.org/10.2307/2786835 [ Links ]
25. Alessandrini M, Klose K, Pepper MS. University entrepreneurship in South Africa: Developments in technology transfer practices. Innovation. 2013;15(2):205-214. http://doi.org/10.5172/impp.2013.15.2.205 [ Links ]
26. South African Department of Higher Education and Training. Ministerial statement on university funding: 2019/20 - 2020/2021 [document on the Internet]. c2018 [cited 2019 Jun 14]. Available from: http://www.dhet.gov.za/SiteAssets/18%2012%2007%20Ministerial%20Statement.pdf [ Links ]
27. Ncube C, Abrahams L, Akinsanmi T. Effects of the South African IP regime on generating value from publicly funded research: An exploratory study of two universities. In: De Beer J, Armstrong C, Oguamanam C, Schonwetter T, editors. Innovation and intellectual property: Collaborative dynamics in Africa. Cape Town: UCT Press; 2013. p. 282-315. [ Links ]
28. NIPMO. NIPMO interpretation note 13: Everything you need to know about full cost [document on the Internet]. c2019 [cited 2020 Oct 04]. Available from: https://nipmo.dst.gov.za/uploads/files/NlN13_Fullcost_6-Aug-19.pdf [ Links ]
29. Gray E. National environmental scan of South African scholarly publishing [document on the Internet]. c2009 [cited 2020 Oct 04]. Available from: https://open.uct.ac.za/bitstream/handle/11427/29095/Position_Paper_2_National_environmental_scan_of_So.pdf?sequence=1&isAllowed=y [ Links ]
30. Breschi S, Lissoni F, Montobbio F. University patenting and scientific productivity: A quantitative study of Italian academic inventors. Eur Man Rev. 2008;5:91-109. https://doi.org/10.1057/emr.2008.9 [ Links ]
31. Simelane T. The innovation landscape of South Africa under new intellectual property management policy. Innovation Summit Journal. 2013:40-45. [ Links ]
32. Owen-Smith J, Powell W. To patent or not: Faculty decisions and institutional success at technology transfer. J Technol Transf. 2001;26:99-114. https://doi.org/10.1023/A:1007892413701 [ Links ]
33. Sibanda M. Intellectual property, commercialisation and institutional arrangements at South African public research institutions. In: The economics of intellectual property in South Africa. Geneva: WIPO; 2009; p. 113-145. [ Links ]
34. Health Professions Council of South Africa. Policy document on business practices [document on the Internet]. c2016 [cited 2020 Feb 18]. Available from: https://www.hpcsa.co.za/Uploads/PSB_2019/Policy_on_Business_Practices_final%20-%202016.pdf [ Links ]
35. Haelio. Wright Medical and Tornier announce merger [webpage on the Internet]. c2014 [cited 2020 Oct 04]. Available from: https://www.healio.com/news/orthopedics/20141028/wright-medical-and-tornier-announce-merger [ Links ]
36. Boschma R, Frenken K. The spatial evolution of innovation networks. A proximity perspective. In: Boschma R, Martin R, editors. Handbook of evolutionary geography. Cheltenham: Edward Elgar Publishing Ltd; 2010. p. 120-135. [ Links ]
37. Breschi S, Lenzi C. The role of external linkages and gatekeepers for the renewal and expansion of US cities' knowledge base, 1990-2004. Reg Stud. 2015;49(5):782-797. http://dx.doi.org/10.1080/00343404.2014.954534 [ Links ]
 Correspondence:
Faatiema Salie
Email: slxfaa002@myuctac.za
Received: 28 May 2020
Revised: 04 Oct. 2020
Accepted: 11 Nov. 2020
Published: 28 May 2021
Supplementary Data
The supplementary data is available in pdf: [Supplementary Material]
* Deceased 20 March 2021
Editor: Jenni Case
Funding: South African National Research Foundation (grant no. 82624), South African Department of Science and Innovation/National Research Foundation (grant no. 98788)

