


Servicios Personalizados
Articulo
 Inglés (pdf)
 Articulo en XML
 Referencias del artículo
Indicadores

Links relacionados
-
 Citado por Google
 -
 Similares en Google
Compartir

 Permalink
South African Journal of Science
versión On-line ISSN 1996-7489
versión impresa ISSN 0038-2353
S. Afr. j. sci. vol.117 no.3-4 Pretoria mar./abr. 2021
http://dx.doi.org/10.17159/sajs.2021/7712
RESEARCH ARTICLE
Patterns of persistence among engineering students at a South African university: A decision tree analysis
Annah V. BengesaiI; Jonathan PocockII
ITeaching and Learning Unit, University of KwaZulu-Natal, Durban, South Africa
IISchool of Engineering, University of KwaZulu-Natal, Durban, South Africa
ABSTRACT
Globally, there is growing concern about student progression in most higher education institutions. In this study, we examined patterns of persistence among students who began their engineering degree at the University of KwaZulu-Natal (UKZN) in 2012 and 2013. The sample was restricted to 1370 incoming students who were tracked to 2019, allowing for a 7-year graduation period for the initial cohort. The data were analysed using descriptive statistics as well as the decision tree approach - a highly visual data-mining technique which helps identify subgroups and relationships that are often difficult to detect through traditional statistical methods. The results from these analyses indicate that up to 50% of students enrolled in the School of Engineering had chosen engineering as their first choice. Approximately 40% had persisted in engineering, 50% had withdrawn by the time of this survey, while the remaining 10% were still registered in the engineering programme. Departure from engineering occurs most in the first year, while graduation most likely occurs after 5 years of registration. Student persistence in engineering can also be classified based on first-year accumulated credits, admission point scores, race, and financial aid, of which first-year accumulated credits is the most critical factor. Overall, our study suggests that understanding failure in the first year might be the missing link in our understanding of student persistence in engineering.
SIGNIFICANCE:
• The study makes several contributions to the field. First, the issue of student persistence is of concern to higher education institutions, not only in South Africa but globally. For institutions to improve student outcomes, they need to understand the reasons behind attrition. Second, in our analysis, we separate students who withdraw from the university and those who switch to other programmes within the same university. Most studies on student progression treat withdrawing students as a single population, which might lead to inaccurate prediction of student outcomes. Third, we draw on data-mining methods and present an interesting way of classifying students using both enrolment data as well as the rules derived from each node of the classification tree. The classification tree analysis method is highly visual and helps identify subgroups and relationships, which might be difficult to detect through traditional statistical methods. The information derived from the classification trees can be used to identify students who might be at risk of failing timeously and come up with interventions that will support them.
Keywords: graduation, engineering education, major switching, data mining, classification algorithms
Introduction
Science, technology, engineering, and mathematics (STEM) graduates are critical for economic growth and sustainable development, especially in a developing country like South Africa.1-3 South African higher education institutions are aware of this, and great strides have been made to increase the number of enrolments across all disciplines, specifically in STEM majors.4 The shift in focus from elitism to the 'massification' of higher education has also resulted in a diverse student body with a wide range of social, cultural and educational backgrounds2 for which institutions are not prepared.5 Consequently, the widening of access has proved to be a double-edged sword characterised by high dropout rates and increasing calls to improve the quality of education.5,6 The student protests of 2015/2016, which called for, among other things, the decolonisation of the curriculum are also reminders that higher education institutions must continue to invest in both access and student success.7
The concern with student retention and non-completion is not unique to South Africa. It has been the subject of research for many years, with studies consistently showing that it is a significant problem in most institutions globally.8-10 Most of this research, which is dominated by the USA, has investigated the trends as well as the various factors that influence student retention, attrition and persistence.11,12 For instance, in the USA, it is estimated that the 8-year graduation rate at public universities is 60%, although this varies by institution and degree programme.9 Similar trends have also been observed in the Organisation for Economic Co-operation and Development (OECD) countries, where female students and students of colour were also found to have lower graduation rates than their male and/or white counterparts.10,13 The Council of Higher Education reported that approximately 50% of all first-time students entering South African higher education institutions are likely to leave without obtaining a degree.4 In a review of the progression and non-completion rates in engineering at a South African university, Pocock14 found that completion rates in the region of 50-72% of entering students were not uncommon, while attrition in the first year of study was approximately 15-20%. The Engineering Council of South Africa's throughput study also found that between 10% and about 45% of students completed their engineering degrees in minimum time at different institutions, while total completion rates ranged between 35% and 60%.15
Clearly, these earlier studies have provided numerous insights into the nature of student persistence both globally and in South Africa. However, and especially in South Africa, most of the earlier studies on student persistence have used indicators which are often overstated, without accounting for the complexity in student progression.
For instance, it is possible that a student might enrol for a particular major at an institution, persist for a few years before switching to another major. Yet, most studies on student retention and dropout in South Africa do not pay attention to student enrolment changes. Second, of the quantitative studies that have sought to understand factors associated with persistence, most have relied on descriptive work with fewer or no controls6,14,15, as well as traditional regression analyses16-18. While regression methods have many benefits in predictive analysis, one of their weakness is the inability to capture non-monotonic relationships as well as unspecified patterns across factors19, which can be resolved through classification methods.
The main aim of this study, therefore, was to add to the scholarship by providing a longitudinal examination of the patterns of selecting, persisting in, switching and leaving majors among students enrolled in the School of Engineering at the UKZN, South Africa. A student is considered to have persisted in an engineering major if they continue their studies from one year to the next and ultimately graduate in their initially registered specialisation. We use the term 'major' to refer to a specific engineering field or specialisation. Those who did not re-register within 2 years from the time of their initial departure to the time of the survey are considered to have withdrawn from the engineering major.
We acknowledge that student progression in higher education is rarely straightforward and can take many pathways beyond what we have included in our analysis. Students who leave a particular qualification might transfer to another institution. It is also not uncommon for students to return to their qualification after a couple of years - a phenomenon referred to as stop-out in the literature.12,14 However, data on institutional transfer are rare, and tracking stop-outs might require interviewing the students who withdrew to understand their reasons for leaving, which was beyond the scope of this study.
Our study also seeks to make a specific contribution to the scholarship by utilising a classification (decision) tree approach to data analysis. Decision tree analysis is a data-mining approach which has the potential to identify hidden as well as simplify complex patterns and relationships found in a data set.20,21 Unlike other discriminatory models such as regression analysis, a decision tree is a highly visual and transparent model which makes explicit all the possible outcomes and patterns in a data set.20 While decision tree algorithms are increasingly being used in many fields such as medicine and public health22, they remain less common in higher education research, although an emerging body of literature23-25 is showing their potential in identifying hidden patterns in institutional data.
Factors influencing student persistence
Past studies have identified several factors that influence student persistence at university.11,12 The conclusion from these studies is that the determinants of student persistence are numerous and complex and perhaps even context dependent. Factors that have been identified in South Africa include school-level factors26; career counselling27; high-school grades, especially for Mathematics and Science28,29; high-school rank; as well as institutional factors such as financial aid and academic support17,30. While some of these factors are generic to all academic disciplines, some are more specific to STEM degree majors such as engineering.
School-level factors steering students in or out of university in South Africa are well documented.26,31,32 The consensus is that the schooling system does not adequately prepare students and has become a 'dominant learning-related cause of the poor performance patterns in higher education'32. Related to this is the school ranking system which divides schools into five quintiles based on socio-economic status. Quintile 1 is the most disadvantaged and found in rural communities, while Quintile 5 is the most advantaged.33 This dualistic nature of the education landscape is also apparent in the large performance gap between students from Quintile 5 schools and those from the rest of the education system.34,35 Some scholars have further identified the poor quality of science and maths teaching, language underpreparedness and lack of resources, especially in rural schools, as other factors impacting on student outcomes.29,32 Maree27 also criticised the lack of career counselling at high schools (particularly in lower quintile schools), where it has been placed in the Life Orientation curriculum at the National Senior Certificate level. Both the extent of career counselling (20% of the curriculum) and the lack of specialist training for teachers in the subject were highlighted as areas that needed improvement. Maree27 further argues that the traditional approach to career counselling at the university level fails many first-generation students as it leads them into inappropriate field choices, with the consequence of higher dropout rates.
Several studies have also investigated the role of some of these factors in determining student success in engineering programmes in South Africa.14,17,18,26,30,36 Pocock14 interviewed students at a South African university who had not re-registered to complete their engineering degrees 18 months post-leaving. He found that, in combination with other factors, financial support was one of the primary reasons for leaving for 48% of the students. Zewotir et al.18 benchmarked success rates across all faculties of the same university against a variety of factors and separated dropout statistics into students failing or choosing to leave. For engineering students, the significant findings were wide-ranging, with students with a lower Mathematics score at high school found to be more likely to leave, and Indian South Africans more likely to leave than white South African students. In terms of the economics of continuation, the probability of persisting was higher for students with financial aid than those without, although different patterns of persistence were found among students with different forms of financial aid. Additional to this, those without a place in university residence were more likely to fail than those in residence. Bengesai and Paideya17 found that students who pass 75% of their first-year course credits were up to eight times more likely to persist in engineering and graduate in regulation time or regulation time plus one year. Other factors peculiar to engineering - but not well researched in South Africa - include stereotypes about gender, lack of role models, course workloads as well as attitudinal characteristics that are harder to determine but might lead to weeding out.37
Choosing a major at UKZN
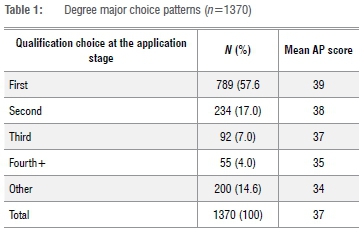
Applications to study engineering programmes at UKZN (along with all programmes of study) are handled centrally through a Central Admissions Office. On application, prospective undergraduate students specify their preferred major as well as other majors that they would like to be considered for admission as first to sixth choices on the application. Pre-selection of students for admission is carried out at the middle to end of the year prior to their potential admission. Prospective students are offered places conditional on their high-school (National Senior Certificate) grades meeting specified levels upon their matriculation from high school. Once final school results are available, firm offers are made to those scholars who have met the conditions, including students who have met the requirements but were not necessarily given the first-choice conditional offer. Once first choices are exhausted, should there be places still available, these would then be offered to students who meet the minimum requirements but might have specified the major as a second or third choice etc. While this does lead to a dynamic system of offers being made, taken or declined, in most of the engineering majors, the scholars selected for admission have chosen a specified engineering field as their major (e.g. Chemical Engineering, Mechanical Engineering) prior to admission. In two of the engineering disciplines (Agricultural Engineering and Computer Engineering), there are occasions where students have chosen these as a second or third choice after other engineering majors. In a few cases, scholars have chosen Medical School (which has the most competitive entry requirements) as a first choice, with an engineering major as a second choice.
Table 1 shows the degree choice patterns among students who were enrolled in the School of Engineering at UKZN in 2012 and 2013. As can be seen from Table 1, the majority (58%, n=789) of the students chose engineering as a major, including the specialisation they eventually registered for, as their first choice. In comparison, 17% (n=234), 7% (n=92) and 4% (n=55) were enrolled in their second, third and fourth choices, respectively. Approximately 15% (n=200) of the enrolled students chose engineering as a fifth or sixth choice at the application stage. The average admission point (AP) score for students who chose an engineering major, including the specialisation, as a first choice was 39, while the average AP score for all students in the sample was 37.
Materials and methods
The data used in this analysis were obtained from the cohort data archived in the Department of Institutional Intelligence at UKZN. This data set captures students' biographical information (race, gender), AP scores, academic performance in the first year, as well as information about financial aid and whether the student resides on the university campus. The sample used in the descriptive analysis consisted of 1370 first-time entry students who began their academic year in 2012 or 2013, thus allowing for a 6-year graduation rate for the latter cohort. For the decision tree method, we excluded 116 students who were still enrolled in their initially declared major. The following research questions guided this study:
1. What are the patterns of selecting, persisting and switching qualifications among a cohort of engineering students?
2. Do gender, race, AP scores, school quintile, first-year accumulated credit load, financial aid and campus residence influence persistence in an engineering major?
3. Which of these factors (in Question 2) can efficiently classify students' likelihood of persisting in an engineering major?
To understand students' persistence patterns, we considered the students' initial registered engineering specialisation, and tracked them through graduation, withdrawal or any subsequent majors in which they enrolled. The conceptual model is shown in Figure 1.
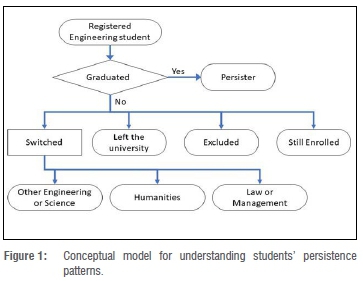
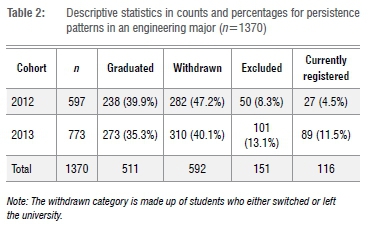
The starting point of this model is students registered in an engineering major. Students who graduated from the initially registered engineering specialisation were defined as 'persisters'. The next step was to look at those students who had not graduated and to track their pathways of leaving the initially registered qualification (that is, withdrawal from the engineering specialisation, exclusion or still enrolled). In our analysis, we first present the analysis of students who switched to other programmes and those who left the university as one category, 'withdrawn' (Table 2 and Figure 2), and then as the specific subcategories (Figure 3 and Table 4). Finally, we built the decision tree model in SPSS v. 26 to classify student persistence according to the given set of variables specified below.
Outcome variables
Our main outcome variable of interest was persistence to graduation (1=yes; 0=other). This was a measure of a student's persistence in the engineering specialisation in which they initially registered at the beginning of their studies, and was used in both the descriptive and classification tree analyses.
Explanatory variables
Gender was categorised as male (=0) or female (=1) and race as black South African (=0) or 'Other' (=1), with 'Other' being a combination of coloured, Indian and white students. We collapsed race into two categories due to the small sample sizes of two of the race categories (white, 85 and coloured, 18). We acknowledge that this categorisation has the potential to mask significant heterogeneity as it does not differentiate between all racial groups. However, given the data limitations, we worked on the plausible assumption that the academic performance of black South African students has been shown to fall behind that of students from other racial groupings.4,6,15 We also rationalised that race is only a factor in South Africa because people have been historically disadvantaged based on race, with black South Africans suffering the extreme consequences.38 Moreover, black South African students constitute more than 70% of the student population.39 Therefore, comparing their persistence patterns relative to a composite race category seemed reasonable as it would at least give us information about this particular risk group.
Financial aid is increasingly important in South Africa given the growing enrolments of students from disadvantaged backgrounds.40 In fact, financial aid is so important that the 2015/2016 #FeesMustFall student protests that took the nation by storm highlighted its influence on student persistence.41 Thus, we also considered whether a student had financial aid (0=no; 1=yes) as a proxy for socioeconomic status.
The students' AP scores were coded as a four-category variable (0=alternative; 1=30-35; 2=36-39; 3=40 and above). We derived this classification from the patterns detected in the enrolment data for the various engineering specialisations. For instance, specialisations such as Agricultural and Civil Engineering tend to have a majority of students with AP scores between 36 and 39, while those with AP scores above 40 tend to enrol in Chemical Engineering programmes. Students who achieve a grade of between 90% and 100% in a National Senior Certificate subject are awarded 8 points; hence, the maximum possible AP score for six National Senior Certificate subjects is 48. We categorised students who wrote a different school leaving examination from the National Senior Certificate written in government-funded schools as 'alternative'. Nine of the students in our sample had inaccurate AP scores (below 20). To avoid bias in our analysis, we decided to treat this group as a missing or floating category21 that would intuitively merge with its most similar AP scores category.
At UKZN, students across all engineering specialisations follow a generic first year consisting of 13 courses in mathematics, chemistry, physics and engineering drawing, with one exception for the Chemical Engineering students who take a different chemistry course. This structure of introductory courses is common in most engineering programmes globally and is designed to provide students with an overview of and the basic skills required in subsequent engineering courses. However, there is a common perception in the literature that these courses often act as gatekeepers, weeding out students who cannot perform at the expectations of faculty.37 For this reason, we also included first-year accumulated credits (FYAC) as an indicator of the student's academic performance in the first year.
To progress in a major at UKZN, a student must achieve a minimum number of credits per semester of study from a fixed curriculum. Should a student fail to achieve 75% of their maximum expected credit load at each level of study, they are coded as being at risk.42 This assignation is based on the assumption that students who pass at least 75% of their accumulated credit load are on track for degree completion in regulation time or regulation time plus one year. Thus, the classification lays the benchmark for acceptable performance levels as well as early identification of underperforming students.42 Following the same logic predetermined in the data set, we accordingly coded FYAC as: <75=1; >75=2. We had 62 students whose FYAC was difficult to determine in the data set due to a break taken in the middle of their first year of study. As with AP scores, we opted to treat this group as a missing or floating category21 that would merge with its most comparable FYAC category. Other covariates included in our model were university residence (0=no; 1=yes) and school quintile (1-5 for Quintiles 1-5).
Decision tree model building
Although there are several statistical algorithms that can be used to build classification trees, in this study, we opted for the decision tree algorithm due to its ability to map hierarchical decisions in an easily interpretable flowchart diagram.20 Given our focus was more on description, classification and interpretation, we opted to use the chi-square automatic interaction detector (CHAID), which uses the chi-square test to stop tree growth.21,43
The decision tree approach aims to create a model that can be used to classify predictor variables using simple decision rules inferred from existing data (also called training data).21,22 Building a decision tree model starts with a single node or root node whose outcome has a known class, for instance, persistence (yes/no). This node has the highest discriminative power and represents a choice that will result in the partitioning of all cases in the data into two or more mutually exclusive subsets.19,20 The decision tree algorithm also uses a recursive technique to further partition cases from the root node into branches or subtrees until they cannot be split further, resulting in a leaf or terminal node. A unique feature of the CHAID decision tree approach is that it uses p-values with a Bonferroni correction as a splitting criterion.19 Thus the stopping rules applied in this method automatically account for statistical significance.19
Once the tree has been constructed, the performance of the model can be evaluated.20 SPSS allows for two validation approaches: k-fold cross-validation and the split-sample validation.43 In this study, we opted for the k-fold cross-validation technique, which divides a data set into several 'n' subsets of equal size; in our case, we chose 10 folds. The decision tree algorithm iteratively classifies each of these subsets using 90% of the data as training data, while 10% is treated as the test sample. In other words, each of the 10% subsets is used once as the test data set, and nine times as part of the training sample, while the rules derived from the 90% training sample are applied to the 10% test sample. A misclassification error is estimated for the training data, while the overall cross-validation risk is calculated as an average of the risk across the 10 test subsamples.40,41
Results
Table 2 presents the descriptive statistics of the distribution of outcome variables. The results show that 40% (n=238) and 35% (n=273) of the students from the 2012 and 2013 cohorts, respectively, graduated. Between 40% (n=310; 2013) and 47% (n=282; 2012) withdrew from an engineering major, while 8% (n=50) and 13% (n=101) were excluded due to underperformance. Approximately 5% (n=27; 2012) and 12% (n=89; 2013) of the students were still registered in the engineering programme in which they initially registered.
Research has shown that the two groups of students with low throughput rates in STEM degrees are likely to be female and black South African students.17,18Figure 2 presents two-way histograms for graduation (our persistence variable), withdrawal and exclusion according to these demographic factors. From Figure 2, we can see that for both gender and race, graduation is most likely to occur in year 5, followed by year 4 and year 6 in that order. This shows that the majority of students who graduate from the engineering major do so in regulation time plus one year. However, while the histograms for both male and female students, as well as black South Africans and the 'Other' race category, follow a similar pattern, it is also clear that female and black South African students are less likely to graduate in minimum time than are male students or their peers from the 'Other' race category.
Regarding departure, Figure 2 indicates that most students who leave an engineering major do so at the end of the first year. There are no significant differences between male and female students in the first year. At the same time, black South African students have a higher propensity for dropping out at this level than students from the 'Other' race category. In terms of exclusion, female and Black South African students are more likely to be excluded at the end of the first year than their male and 'Other' peers. This pattern changes in the second year, with more male than female students being excluded, while for race, there is a small difference in the rate of exclusion.
Having ascertained the proportion of students who graduate and drop out, as well as the timing of these events, the next step in our analysis was to explore the trajectories of those who dropped out from the engineering major.
Figure 3 reveals that 69% (407) of the students did not register for any subsequent qualifications. In the absence of additional information on stop-out, these students are taken as dropouts from UKZN. Therefore only 31% (185) of the students registered for alternative qualifications. This translates to 13.5% of the whole sample. We refer to the students who registered for alternative qualifications at the same university as 'switchers'. Tables 3 and 4 present descriptive statistics for (1) withdrawal from an engineering major and (2) switching by gender and race.
Table 3 shows that there was no difference in the withdrawing pattern between male and female students. However, regarding race, 47% (n =330) of the black South African students withdrew from the engineering major relative to 39% (n=260) of their peers from the 'Other' race groups.
From Table 4, we notice that 53% (n=71) of the male students and 56% (n=28) of the female students switched to science-related fields such as health sciences, agriculture and chemistry. Likewise, 49% (n=48) of black South African students and 59% (n=52) of the 'Other' students also moved to science-related fields. A greater percentage of black South African students switched between engineering majors (40%, n=39) compared with 'Other' students (6%, n=5). Similarly, male students were more likely to switch between engineering majors (26%, n=35) than their female counterparts (18%, n=9).
Approximately 27% (n=24) of students in the 'Other' race category switched to a Law or Management Studies major relative to 8% (n=8) of black South African students, while 16% (n=22) and 20% (n=10) of the male and female students, respectively, also switched to major in Law or Management Studies. Only a few of the switching students subsequently enrolled in a Humanities major (less than 10% for both gender and race categories). Of the 185 switchers we had in our sample, 20% (n=37) were excluded from the subsequent qualifications in which they registered. The last column in Table 4 shows the disaggregation of the students excluded from the subsequent qualification by race and gender.
Decision tree analysis
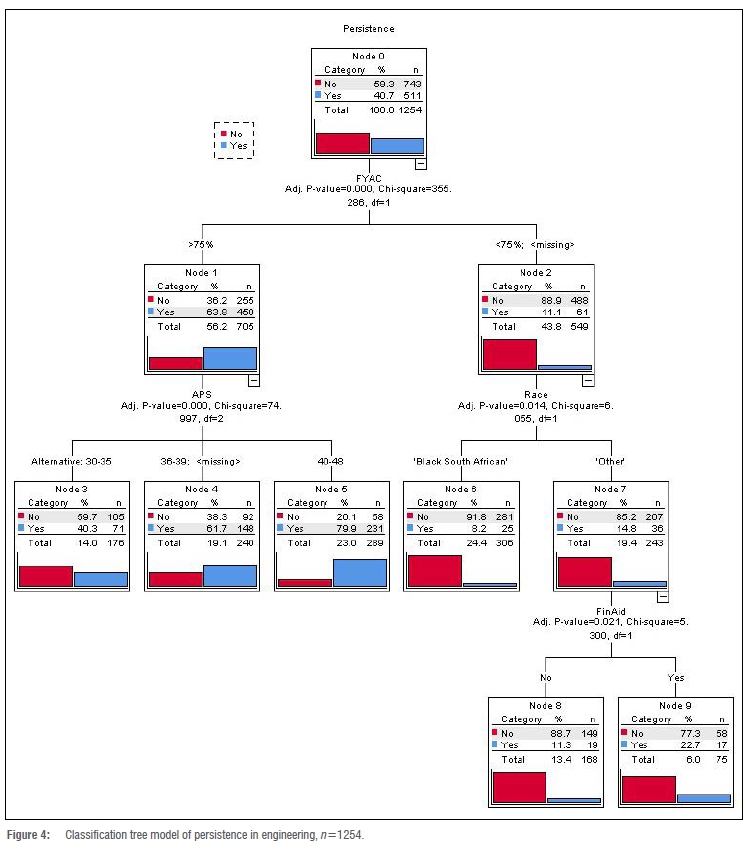
Figure 4 presents the results from the decision tree analysis using the CHAID growing method. Figure 4 shows that all the cases were partitioned into nine subgroups from the root node to terminal nodes. The findings can be summarised as follows:
• FYAC is the most critical indicator of persistence amongst the engineering cohort (Nodes 1 and 2). Students who took a break in the middle of their first year of study were also intuitively merged with the category (FYAC=>75=2), while those with inaccurate AP scores were combined with the category 36-39 AP scores.
• Among students who passed 75% of their FYAC, 63.8% persisted, relative to only 11.1% of those who failed to acquire 75% of the FYAC or were in the floating category.
• Among students who passed at least 75% of their FYAC load and had AP scores in the range 40 and above, 79.9% persisted (Node 5).
• Among students who passed at least 75% of their FYAC load and had AP scores in the range 36-39 or missing, 61.7% persisted in their first declared engineering major (Node 4).
• Among students with 75% of FYAC and alternative AP scores or AP scores in the range 30-35, only 40.3% persisted (Node 3).
• For those students who did not achieve 75% of their FYAC load or had taken a break in the middle of their first year of study, and were coded as 'Other', 14.8% persisted (Node 7).
• Among students who did not achieve 75% of their FYAC load or had taken a break in the middle of their first year of study, and were black South Africans, only 8.2% persisted (Node 6).
• Among students coded as 'Other', who failed to achieve at least 75% of the FYAC load or had taken a break in the middle of their first year of study, and had financial aid, 22.7% persisted (Node 9) relative to only 11.3% (Node 8) with the same characteristics but who did not have financial aid.
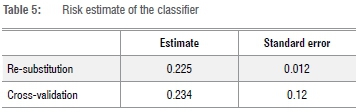
Table 5 presents the risk error estimates of the CHAID model. The training or re-substitution error, which is a measure of how well the classifier adapts to the training data, was 0.225 (22.5%). This error is generally considered to be optimistically biased and likely to underestimate the misclassification error because it uses only the training data to evaluate the model.44 Hence, it should be interpreted with care. On the contrary, the cross-validation approach, which uses a resampling approach, estimates the true prediction error in assigning group membership in the model.44 As shown in Table 5, the cross-validation risk error for our model was 0.234 (23.4%), suggesting that the average risk of misclassifying students (based on all 10 sub-samples using 10-fold cross-validation) was 23%. In other words, our model performed reasonably well in classifying students' persistence patterns.
Discussion
We tracked a cohort of students beginning in 2012 or 2013 over 7 or 6 years, respectively, to examine their persistence patterns. Our results show that approximately up to 40% of the students persist in the engineering specialisation in which they initially registered. Of those who persisted, the majority graduated after 5 years, which is regulation time plus one year, while withdrawal from an engineering major was most likely to occur in the first year. Thus, our results from the descriptive analysis confirm those of earlier studies which have shown similar persistence trends in South Africa.4,14-17 We also found that most of the students who left the engineering programme did not register for any subsequent degrees at the same institution, at least within the 6-7-year period under investigation. While there is a possibility that these students might have transferred to other institutions, in the worst-case scenario, they might have been lost to higher education altogether. Of those that switched majors, the majority took up studies in other science-related fields while switching into the humanities was a relatively infrequent occurrence.
Research has shown that switching courses is a natural process for most undergraduate students who are often at the stage of finding the right fit for their academic studies45 and is more pronounced in STEM disciplines such as engineering44,45. For instance, analyses from the USA suggest that 30% of students do not persist in their first declared major9 and that switching is highest amongst female and African-American students37,45-47. However, our findings suggest that, while a significant proportion of students does not persist in engineering, switching is less common, at least within the same institution, as only 13.5% of our sample switched to other majors. There is a need for further research investigating what happens to the majority of students who depart from an engineering major.
Our results from the CHAID analysis suggest that FYAC and AP scores, race and financial aid status were the most important variables associated with persistence. Gender, school quintile and campus residence were not used in building the tree, suggesting that these factors had the least discriminative power in classifying students at risk of not persisting. Of all our input variables, FYAC load was the most critical factor in determining persistence, reinforcing prior studies which have shown that the first year is critical for on-track graduation.17,26 For engineering students, the first year is especially important and serves as an initial roadblock to persistence for several reasons. First, the engineering degree is more sequential and structured, such that failure in the first year can derail a student completely, threatening their chances of completing the degree on time.17,37 Second, first-year introductory science and mathematics courses that provide the background needed for an engineering major hold the distinction of gatekeepers.37,46 King comments that this weed-out culture 'suggests that grades are used to send a message to low achieving students that they do not belong in the major'46. Hence, students respond by either leaving or switching to other programmes.
The role of AP scores in determining success in university has been a subject of much debate in South Africa26,28,29 with some studies suggesting that they are an unreliable indicator of future success, and others showing the opposite. However, our findings suggest that students who pass 75% of their FYAC load and have high AP scores (above 40) have the most favourable outcomes. Put differently, our findings suggest that the higher the AP score, the better the chance of persisting. Given that the majority of the students enrolled in the engineering programmes at UKZN have AP scores below 40, underpreparedness might be a norm rather than an exception.
Although prior studies have documented an achievement gap in STEM subjects between black South African students and their peers from other racial groups4,6,15, the decision tree method in our analysis suggests that this effect is more important for those students who fail to acquire at least 75% of their FYAC load. Similarly, we also found that financial aid was an important factor for non-black South African students who did not achieve 75% of their FYAC loads. Thus, our findings suggest that the relationship between race, financial aid and persistence is not as straightforward as often reported in previous studies16,17; instead, these factors interact with first-year performance in a critical way. Put differently, focusing on race or access to financial aid without taking into account the whole student experience, can disguise potential disparities that might distinguish students, especially in the first year of study.
The finding that financial aid (Nodes 8 and 9) explained persistence more for students in our composite race category than for black South Africans was rather unexpected. This is because financial aid is one of the strategies that has been put in place to redress past inequalities which have disproportionately affected the black South African students, both in terms of access and success.40 Hence, we would have expected that financial aid would be an important factor for these students. However, from a methodological perspective, and considering that black South African students make up the majority of financial aid recipients47, it is highly possible that the algorithm might have been sensitive to the data distribution. Thus, it would not have been a good discriminator of their performance. Again, there is also the possibility of noise in the terminal nodes (8 and 9) as they contain only a few of the remaining cases.48 In other words, financial aid is the least informative factor in our model, and hence, caution should be taken when interpreting this finding.
Limitations
Although this study advances the way we should think about student persistence, there are some limitations which might affect how the results should be interpreted. The first limitation relates to our choice of covariates. Our analysis was limited to only the covariates that were found in the data we used. Other factors that might influence student persistence, such as family background or language, were not explored. Second, we did not consider a departure from engineering due to transfer to other institutions. It is possible that some of the students who did not re-register in other programmes at UKZN might have enrolled in other institutions. While tracking transfer-outs is currently a challenge, the growing use of institutional data and the recent growth in institutional research and data analytics suggest that this will soon be possible. Potential improvements in the data analysis might also include more predictors to lower the risk of misclassifying students. Third, our study presents a case study of one school in a single institution. Hence, while the results can be informative for other schools within and outside UKZN, we do not claim generalisability beyond the School of Engineering at UKZN. Therefore, context should be taken into consideration when interpreting these results.
Despite these limitations, our findings reinforce the argument that not all students who depart from an academic programme are lost to higher education. Some do switch to other programmes. This study has also shown that performance in the first year can be extremely helpful in identifying students at risk of not persisting to graduation. Thus, academic support should be strongest in the first year of registration and universities should not wait until the end of the first year to assist these students.
Overall, while our study confirms the findings of earlier studies, our main contribution is in showing the viability of decision tree analysis as an alternative way to understand patterns of persistence amongst a cohort of engineering students. Specifically, our analysis revealed that by using machine-learning algorithms such as decision trees, researchers can detect the specific combinations of factors that influence student persistence. Such a model can be used to classify students using both enrolment data as well as the rules derived from each node of the classification tree. For instance, for Node 5, the rules can be written as follows:
If FYAC='>75%' and AP score='40+' THEN outcome='persist'. This information can then be used to timeously identify students who might be at risk of failing and come up with interventions that will support them.
Competing interests
We declare that there are no competing interests.
Authors' contributions
A.V.B. undertook the initial conceptualisation. J.P provided critical feedback on the conceptualisation, which led to a revised focus. A.V.B. devised the methodology and performed the analysis. Both authors discussed the results and contributed to the final manuscript. A.V.B. took the lead in the write-up of the manuscript, with support from J.P. Both authors provided critical feedback on the literature review, analysis and the discussion.
References
1. Clark JV. Introduction. In: Clark JV editor. Closing the achievement gap from an international perspective: Transforming STEM for effective education. London: Springer; 2014. p.3-6. [ Links ]
2. Grayson D, Collier-Reed B, Pearce H, Shay S. A curriculum framework for flexible engineering degrees in South Africa. Paper presented at: Enhancement and Innovation in Higher Education Conference; 2013 June 11-13; Glasgow, UK. p.343-352. [ Links ]
3. Fisher G, Scott I. The role of higher education in closing the skills gap in South Africa. Background paper 3 for 'Closing the skills and technology gap in South Africa'. Washington DC: The World Bank; 2011. [ Links ]
4. Council on Higher Education (CHE). A proposal for undergraduate curriculum reform in South Africa: The case for a flexible curriculum structure. Pretoria: CHE; 2013. [ Links ]
5. Shay S. Educational investment towards the ideal future: South Africa's strategic choices. S Afr J Sci. 2017;113(1/2), Art. #2016-0227. http://dx.doi.org/10.17159/sajs.2017/20160227 [ Links ]
6. Scott I, Yeld N, Hendry J. A case for improving teaching and learning in South African higher education. Higher Education Monitor no. 6. Pretoria: Council on Higher Education; 2007. Available from: http://www.che.ac.za/documents/d000155/index.php [ Links ]
7. Costandius E, Nell I, Alexander N, McKay M, Blackie RM, Setati E. #Feesmustfall and decolonising the curriculum: Stellenbosch university students' and lecturers' reactions. S Afr J High Educ. 2018;32(2):65-85. https://doi.org/10.20853/32-2-2435 [ Links ]
8. Ost B. The role of peers and grades in determining major persistence in sciences. Econ Edu Rev. 2010;29(6):923-934. https://doi.org/10.1016/j.econedurev.2010.06.011 [ Links ]
9. McFarland J, Hussar B, Zhang J, Wang X, Wang K, Hein S, et al. The condition of education 2019 (NCES 2019-144). Washington DC: National Center for Education Statistics, US Department of Education; 2019. Available from: https://nces.ed.gov/pubsearch/pubsinfo.asp?pubid=2019144 [ Links ]
10. Weedon E, Riddell S Higher education in Europe: Widening participation. In: Shah M, Bennett A, Southgate E, editors. Widening higher education participation: A global perspective. Kidlington: Chandos Publishing; 2016. p. 49-62. [ Links ]
11. Pascarella ET, Terenzini PT. How college affects students: Findings and insights from twenty years of research. San Francisco, CA: Jossey-Bass; 1991. [ Links ]
12. Tinto V. Dropout from higher education: A theoretical synthesis of recent research. Rev Educ Res. 1975;45:89-125. http://dx.doi.org/10.3102/00346543045001089 [ Links ]
13. Organisation for Economic Co-operation and Development (OECD). Education at a glance: OECD indicators. Paris: OECD Publishing; 2017. https://doi.org/10.1787/eag-2017-en [ Links ]
14. Pocock J. Leaving rates and reasons for leaving in an engineering faculty in South Africa: A case study. S Afr J Sci. 2012;108(3-4), Art. #634. http://dx.doi.org/10.4102/sajs.v108i3/4.634 [ Links ]
15. Fisher G. Improving throughput in the engineering bachelor's degree: Report to the Engineering Council of South Africa [document on the Internet]. c2011 [cited 2020 Jul 07]. Available from: https://www.ecsa.co.za/about/pdfs/091211_ECSA_Throughput_Report.pdf [ Links ]
16. Murray M. Factors affecting graduation and student dropout rates at the University of KwaZulu-Natal. S Afr J Sci. 2014;110(11/12), Art. #20140008. https://doi.org/10.1590/sajs.2014/20140008 [ Links ]
17. Bengesai AV Paideya V. An analysis of academic and institutional factors affecting graduation among engineering students at a South African university. Afr J Res Math Sci Technol Educ. 2018;22(2):137-148. https://doi.org/10.1080/18117295.2018.1456770 [ Links ]
18. Zewotir T, North D, Murray M. Student success in entry-level modules at the University of KwaZulu-Natal. S Afr J High Educ. 2011;25(6):1233-1244. [ Links ]
19. Antipov E, Pokryshevskaya E. Applying CHAID for logistic regression diagnostics and classification accuracy improvement. J Target Meas Anal Mark. 2010;18:109-117. https://doi.org/10.1057/jt.2010.3 [ Links ]
20. Breiman L, Friedman JH, Olshen RA, Stone CJ. Classification and regression trees. Belmont, CA: Wadsworth Inc.; 1984. [ Links ]
21. Ritschard G. CHAID and earlier supervised tree methods. In: McArdle JJ, Ritschard G, editors. Contemporary issues in exploratory data mining in behavioral sciences. New York: Routledge; 2013. p.48-74. [ Links ]
22. Uddin S, Khan A, Hossain M, Moni MA. Comparing different supervised machine learning algorithms for disease prediction. BMC Med Inform Decis Mak. 2019;19:281. https://doi.org/10.1186/s12911-019-1004-8 [ Links ]
23. Kirby NF, Dempster ER. Using decision tree analysis to understand foundation science student performance. insight gained at one South African university. Int J Sci Educ. 2014;36(17):2825-2847. https://doi.org/10.1080/09500693.2014.936921 [ Links ]
24. Nudelman Z, Moodley D, Berman S. Using Bayesian networks and machine learning to predict computer science success. In: Kabanda S, Suleman H, Gruner S, editors. ICT education. SACLA 2018. Communications in computer and information science. Cham: Springer; 2019. p. 207-222. https://doi.org/10.1007/978-3-030-05813-5_14 [ Links ]
25. Delen D. Predicting student attrition with data mining methods. J Coll Stud Ret. 2011;13(1):17-35. https://doi.org/10.2190/CS.13.Lb [ Links ]
26. Jawitz J. Performance in first- and second-year engineering at the University of Cape Town. S Afr J High Educ. 1995;9:101-108. [ Links ]
27. Maree JG. Career counselling in the 21st century: South African institutions of higher education at the crossroads. S Afr J High Educ. 2009;23(3):436-458. [ Links ]
28. Naidoo P, Motala N, Joubert R. Matriculation scores as an indicator of academic success in an occupational therapy education programme. S Afr J Occup Ther. 2013;43(1):21-25. [ Links ]
29. Mthimunye KDT, Daniels FM. Performance in grade 12 mathematics and science predicts student nurses' performance in first-year science modules at a university in the Western Cape. Curationis. 2017;40(1), Art. #1776. https://doi.org/10.4102/curationis.v40i1.1776 [ Links ]
30. Bengesai A. Engineering students' experiences of supplemental instruction: A case study. Alternation. 2011;18(2):59-77. [ Links ]
31. Case J, Marshall D, Grayson D. Mind the gap: Science and engineering education at the secondary-tertiary interface. S Afr J Sci. 2013;109(7/8), Art. #2012-0113. http://dx.doi.org/10.1590/sajs.2013/20120113 [ Links ]
32. Monnapula-Mapesela M. Students' perception of own preparedness for higher education. Int J Educ Sci. 2015;9(2):255-264. https://doi.org/10.1080/09751122.2015.11890315 [ Links ]
33. South Africa. Amended national norms and standards for school funding. Government Gazette 31496(1087). Pretoria: Government Printers; 2008. [ Links ]
34. Spaull N. Schooling in South Africa: How low-quality education becomes a poverty trap. In: De Lannoy A, Swartz S, Lake L, Smith C, editors. South African child gauge. Cape Town: Children's Institute, University of Cape Town; 2015. p. 34-40. [ Links ]
35. Van der Berg S. How effective are poor schools? Poverty and educational outcomes in South Africa. Stud Educ Eval. 2008;34:145-154. https://doi.org/10.1016/j.stueduc.2008.07.005 [ Links ]
36. Pocock J, Bengesai AV, Moodley M. Barriers to progression: A longitudinal study of an access programme for engineering. Proceedings of the SASEE Conference. Stellenbosch: SASEE; 2011. p. 164-173. [ Links ]
37. Sanabria T, Penner A. Weeded out? Gendered responses to failing calculus. Soc Sci (Basel). 2017;6(2):47. https://doi.org/10.3390/socsci6020047 [ Links ]
38. Keswell M. Education and racial inequality in post-apartheid South Africa. In: Attewell P Newman KS, editors. Growing gaps: Educational inequality around the world. Oxford: Oxford University Press; 2010. p. 82-104. [ Links ]
39. University of KwaZulu-Natal. UKZN at a glance [document on the Internet]. c2017 [cited 2020 Jul 07]. Available from: https://www.ukzn.ac.za/wp-content/uploads/2017/10/At-a-Glance-2017.pdf [ Links ]
40. Sehoole C, Adeyemo KS. Access to, and success in, higher education in post-apartheid South Africa: Social justice analysis. J High Educ Afr. 2016;14:1-18. [ Links ]
41. Naidoo A, McKay TJM. Student funding and student success: A case study of a South African university. S Afr J High Educ. 2018;32:158-172. http://dx.doi.org/10.20853/32-5-2565 [ Links ]
42. University of KwaZulu-Natal. University of KwaZulu-Natal: Academic monitoring and exclusions policy and procedures [webpage on the Internet]. c2009 [cited 2020 Jul 07]. Available from: http://registrar.ukzn.ac.za/Libraries/policies/Academic_Monitoring_Exclusion_Policy_Procedure_-_CO06041209.sflb.ashx [ Links ]
43. IBM Corporation. IBM SPSS Decision Trees 25. New York: IBM Corporation; 2015. [ Links ]
44. Berrar D. Cross-validation. Encyclopedia of bioinformatics and computational biology. 2018;1:542-545. https://doi.org/10.1016/B978-0-12-809633-8.20349-X [ Links ]
45. Astoni-Figari C, Speer JD. Drop out, switch majors, or persist? The contrasting gender gaps. Econ Lett. 2018;164:82-85. https://doi.org/10.1016/j.econlet.2018.01.010 [ Links ]
46. King B. Changing college majors: Does it happen more in STEM and do grades matter? J Coll Sci Teach. 2015;44(3):44-51. [ Links ]
47. Geisinger BN, Raman D. Why they leave: Understanding student attrition from engineering majors. Int J Eng Educ. 2013;29:914-925. [ Links ]
48. Perner P How to interpret decision trees? In: Perner P editor. Advances in data mining: Applications and theoretical aspects. ICDM 2011. Lecture Notes in Computer Science. Berlin/Heidelberg: Springer; 2011. p. 40-55. [ Links ]
 Correspondence:
Annah Bengesai
Email: bengesai@ukzn.ac.za
Received: 10 Dec. 2019
Revised: 07 July 2020
Accepted: 28 July 2020
Published: 29 Mar. 2021
Editor: Jennifer Case
Funding: None

