


Services on Demand
Article
 English (pdf)
 Article in xml format
 Article references
Indicators

Related links
-
 Cited by Google
 -
 Similars in Google
Share

 Permalink
South African Journal of Science
On-line version ISSN 1996-7489
Print version ISSN 0038-2353
S. Afr. j. sci. vol.117 n.3-4 Pretoria Mar./Apr. 2021
http://dx.doi.org/10.17159/sajs.2021/7911
RESEARCH ARTICLE
Evaluating South African Weather Service information on Idai tropical cyclone and KwaZulu-Natal flood events
Mary-Jane M. BopapeI; Ezekiel SebegoI; Thando NdaranaII; Bathobile MasekoI; Masindi NetshilemaI; Morne GijbenI; Stephanie LandmanI; Elelwani PhaduliI; Gift RambuwaniI; Louis van HemertI; Musa MkhwanaziI
ISouth African Weather Service, Pretoria, South Africa
IIDepartment of Geography, Geoinformatics and Meteorology, University of Pretoria, Pretoria, South Africa
ABSTRACT
Severe weather events associated with strong winds and flooding can cause fatalities, injuries and damage to property. Detailed and accurate weather forecasts that are issued and communicated timeously, and actioned upon, can reduce the impact of these events. The responsibility to provide such forecasts usually lies with government departments or state-owned entities; in South Africa that responsibility lies with the South African Weather Service (SAWS). SAWS is also a regional specialised meteorological centre and therefore provides weather information to meteorological services within the Southern African Development Community (SADC). We evaluated SAWS weather information using near real-time observations and models on the nowcasting to short-range forecasting timescales during two extreme events. These are the Idai tropical cyclone in March 2019 which impacted Mozambique, Zimbabwe and Malawi resulting in over 1000 deaths, and the floods over the KwaZulu-Natal (KZN) province in April 2019 that caused over 70 deaths. Our results show that weather models gave an indication of these systems in advance, with warnings issued at least 2 days in advance in the case of Idai and 1 day in advance for the KZN floods. Nowcasting systems were also in place for detailed warnings to be provided as events progressed. Shortcomings in model simulations were shown, in particular on locating the KZN flood event properly and over/underestimation of the event. The impacts experienced during the two events indicate that more needs to be done to increase weather awareness, and build disaster risk management systems, including disaster preparedness and risk reduction.
SIGNIFICANCE:
This paper is relevant for all South Africans and the SADC region at large because it provides information on:
• the weather forecasting processes followed at the South African Weather Service,
• available early warning products in South Africa and for the SADC region made possible through the public purse,
• the performance of nowcasting and modelling systems in the case of predicting two extreme weather events that had adverse impacts on southern African society, and
• the dissemination of warnings of future extreme weather events.
Keywords: weather extremes, early warnings, floods, Idai, weather forecasting
Introduction
Weather affects our daily lives from the manner in which we dress, whether we host an event outdoors or indoors, the traffic we experience and our electricity consumption.1-3 Impacts of weather can also be severe to a point of causing damage to property, injuries and even death. According to the Emergency Events database (EM-DAT), of the total number of people affected by weather-related disasters during the period 1995 to 2015, 56% were affected by floods, 26% by droughts, 16% by storms and 2% by extreme temperatures.4 When adhered to, timeous, accurate and detailed weather forecasts can reduce impacts associated with adverse weather events.5 The task to issue weather forecasts and warn the public is usually given to meteorological services, which are mostly state owned and follow the World Meteorological Organization (WMO) guidelines. Weather forecasting requires large investments in observations, as well as computational and human resources primarily financed by the public purse.6
The South African Weather Service (SAWS) is one such organisation that has a mandate to provide weather and climate information, products, services and solutions that contribute to the safety of life and property in the air, land and sea over South Africa and adjacent oceans. The organisation is a public entity in terms of the SAWS Act (No. 8 of 2001), as amended in 2013. In addition, SAWS is a recognised WMO regional specialised meteorological centre (RSMC) and therefore provides weather products to meteorological services within the Southern African Development Community (SADC) region. Extreme events that are experienced over the SADC region are as a result of tropical, subtropical as well as mid-latitude systems.7 Analyses of 30 years (1974 to 2003) of data on natural disasters in Africa, show that droughts and floods are the most frequently occurring natural hazards in southern Africa.8 The South African Department of Environmental Affairs' Long Term Adaptation Strategy indicated that the most common weather-related disasters in South Africa are floods, droughts, fires and large storms, as reported in the period 1900 to 2014.9
A variety of synoptic situations may be conducive to convective storm formation over South Africa. Tropical-temperate troughs10 associated with northwest-southeast aligned cloud bands were found to be responsible for a high proportion of heavy rainfall days - 30 of 52 extreme rainfall events analysed during the period 1979-1999.11 Cut-off lows, which are closed low-pressure systems in the upper air, were found to be associated with some of the extreme rainfall events. During spring and autumn, cut-off lows bring thunderstorms to the southern parts of the subcontinent.12 Land-falling tropical cyclones can also cause heavy rainfall which can result in flooding. Tropical cyclones contribute to more than 50% of multi-day heavy rainfall events that occur in the Limpopo river basin.13
According to EM-DAT data, floods have resulted in the highest economic cost of damages, while droughts have affected a larger proportion of the country's population.4 The total damage due to the four most common weather-related disasters is approximately USD3.5 billion, with floods amounting to approximately USD1.3 billion (in the period 1900-2014). It may be noted that the events reported by EM-DAT do not account for all disasters because of the strict criteria followed on the determination of which events are listed. Improvements in weather forecasting and greater awareness of risks have reduced impacts associated with adverse weather events in the USA since the 1990s.5,14
In March 2019, tropical Cyclone Idai caused floods over Mozambique, Malawi and Zimbabwe, resulting in more than 1000 deaths, a cholera outbreak with over 4000 confirmed cases and an estimated damage of at least USD2 billion.15,16 In April 2019, the coastal province in the east of South Africa, KwaZulu-Natal (KZN), experienced floods which led to 71 deaths, more than 1400 people displaced and an estimated damage of about USD71 million.17,18 These impacts were felt in the very recent past despite the availability of weather information disseminated through mobile apps, television and radio stations, and social media. The available weather information is produced using state-of-the-art infrastructure and observations. SAWS uses numerical weather prediction models, satellite, radar and lightning detection data, and ground observations (discussed in the next section) to generate its forecasts and warnings. As an RSMC, SAWS also provides services to forecasters in the SADC region for the production of local warnings and alerts.
A successful weather-related early warning system requires (1) a good observation network used as input to the forecasting process, (2) state-of-the-art numerical models that can provide reliable forecasts with a long enough lead time, (3) skilled forecasters who understand how to interpret observations and model output, (4) relevant dissemination channels, and (5) response. The WMO recommends a move from providing information on what the weather will be to providing impact-based forecasting, which requires information on vulnerability and hazard scenarios.19-21 Challenges in any of the areas will limit the value and effectiveness of the early warning systems.
In this study, we evaluated the weather information (what the weather will be) issued by SAWS for both the Idai tropical cyclone and the KZN floods. Our main objectives were to determine (1) if models were able to capture the location and intensity of the events; (2) how far in advance models were able to provide guidance on the events; (3) if forecasters issued reliable warnings and (4) if information needed to update the warnings as informed by near real-time observations was available. An understanding of the performance of aspects of the early warning system value chain will assist those involved to understand what works well and what needs attention.
Data and methods
SAWS provides weather and climate information across a range of timescales, from nowcasting which is defined as 0-2 h, short-range forecasting (up to 3 days), medium range (up to 2 weeks) to seasonal and multi-decadal timescales. The focus of this study was on the nowcasting and short-range early warning systems.
Nowcasting systems
A weather radar (Radio Detection and Ranging) provides a three-dimensional view of the atmosphere in near real time.22 SAWS operates 10 S-band Doppler radars, with one dual-polarised (placed in Bethlehem), and two mobile X-band radars. The radar information is received every 6 min and extrapolations of storm position up to 2 h ahead are made using the TITAN (Thunderstorm Identification, Tracking, Analysis and Nowcasting) software.23 Quantitative precipitation estimates are also produced from the radar data for South Africa for stratiform and convective rainfall.24
SAWS receives satellite data from the Meteosat Second Generation (MSG) which provides 12 channels every 15 min across the whole of Africa. SAWS uses the nowcasting and very short-range forecasting Satellite Application Facility developed in Spain, Europe, which was first installed at SAWS in 2014 to produce the Rapidly Developing Thunderstorms (RDT) product. The RDT product uses data from the geostationary MSG satellite and Numerical Weather Prediction (NWP) models (discussed later) to provide information on significant convective systems. The RDT product distinguishes different phases of the thunderstorm, namely, growing, mature and decaying.25 SAWS also uses satellite-based quantitative precipitation estimations namely the Hydroestimator and the Convective Rainfall Rate which is a product of the nowcasting Satellite Application Facility. These products are combined with the stratiform rainfall field from the NWP model running at SAWS to produce a comprehensive rainfall field.
Rainfall estimates from radar as well as from satellite are used as input towards the South African Flash Flood Guidance System (SAFFGS).26 The satellite estimates are used when radar data are not available over South Africa. The Southern African Region Flash Flood Guidance System (SARFFGS) is available for SADC and uses only rainfall estimates from satellite data. For forecasting up to 6 h ahead, both the SAFFGS and SARFFGS employ NWP data described below.
Numerical weather prediction
To be able to issue forecasts or predictions beyond the nowcasting timescale, SAWS uses numerical models that are either run at SAWS or by other international meteorological organisations. The main operational NWP model that is utilised by SAWS is the Unified Model (UM) of the United Kingdom Met Office.27,28 The model is run across most of SADC with a grid spacing of 4.4 km (UM_SA4), producing up to 72-h forecasts, and across the whole of South Africa with a grid spacing of 1.5 km (UM_SA1p5), up to 36 h ahead. The UM forecasts are updated four times a day at 00h00 UTC, 06h00 UTC, 12h00 UTC and 18h00 UTC. The simulations are made on the SAWS CRAY XC30 high-performance computing system. The UM_SA4 is used as input to the SARFFGS and SAFFGS for purposes of forecasting possible flash floods over river basins. Beyond 3 days up to 10 days, SAWS purchases data from the European Centre for Medium-Range Weather Forecasts (ECMWF)29, where a deterministic forecast with a grid spacing of 16 km is provided for selected variables for South Africa.
Other observations
The description of the event is based on the ERA5 data set, which is the fifth major global reanalysis produced by ECMWF, and it covers the period 1950 to the present.30 ERA5 was developed through the Copernicus Climate Change Service and has a grid spacing of approximately 31 km globally. The re-analyses were produced using 4D-Var data assimilation in the ECMWF's Integrated Forecast System. Atmospheric data are available on the surface or single level as well as on pressure, potential temperature and potential vorticity levels.
The rainfall simulations were also compared with the Integrated Multi-satellitE Retrievals for GPM (Global Precipitation Measurement) (IMERG) which is the unified US algorithm that provides the multi-satellite precipitation product for the US GPM team.31 The precipitation estimates from the various precipitation-relevant satellite passive microwave sensors comprising the GPM constellation were computed using the 2017 version of the Goddard Profiling Algorithm, then gridded, intercalibrated to the GPM Combined Ku Radar-Radiometer Algorithm product, and merged into half-hourly 0.1°x0.1° (roughly 10x10 km) fields.
The rainfall simulations were also compared with the Tropical Applications of Meteorology using SATellite data and ground-based observations (TAMSAT). TAMSAT produces daily rainfall estimates for all of Africa at a 4-km grid length.32 The TAMSAT data are available from 1983 to the present. Data from SAWS automatic weather stations and automatic rainfall stations over KZN were also used to study the KZN floods.
Objective verification
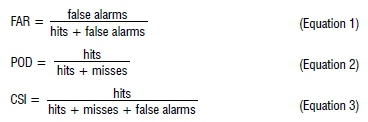
An objective verification analysis was performed on the UM simulations for the KZN flood case based on three contingency table statistics. The UM simulations are coarse-grained from 4.4 km and 1.5 km to the GPM grid length of 0.1°, with GPM used as the observation. The three measures that were used are the False Alarm Ration (FAR)(Equation1), the Probability of Detection (POD) (Equation 2) and Critical Success Index (CSI) (Equation 3).33 FAR gives the fraction of the predicted events that did not occur; a perfect score for FAR is 0, while a value of 1 shows no skill. POD is a measure of the fraction or percentage of the predicted events that occurred, while CSI provides the fraction of observed and forecasted events that were correctly predicted. A perfect score for POD and CSI is given by a value of 1, while 0 means there is no skill.
Forecasts and dissemination
Dissemination and effective communication of SAWS services is critical for the safety of lives and property. Weather forecasts that are communicated to the media are issued by the Disaster Risk Reduction Centre which was previously known as the National Forecasting Centre. The Disaster Risk Reduction Centre is based at the SAWS head office in Pretoria and is responsible for national guidance on potentially hazardous weather. In order to alert or warn the public, the DRR centre cooperates with the National Disaster Management Centre and the flood forecasting service of the South African Department of Water and Sanitation.9 Regional forecasting offices at the major airports are responsible for the detailed forecasts and warnings within their regions and they also liaise with the Provincial and Municipal Disaster Management Centres. SAWS also issues warnings through Facebook (@WeatherServic) and Twitter (@SAWeatherServic) accounts, and a WeatherSMART mobile app. As an RSMC, SAWS makes its forecast products available through the password controlled RSMC Pretoria website (http://rsmc.weathersa.co.za)34 for meteorological services within SADC.
Results
Idai tropical cyclone
Event description
Tropical cyclone Idai is reported to have impacted Mozambique, Madagascar, Malawi and Zimbabwe.35 The cyclone started developing on 4 March 2019, initially as a tropical depression, which made landfall on the same day over the north of Quelimane as shown in Figure 1a. The system caused heavy rainfall over southern Malawi and some provinces of Mozambique for a period of 4 days (Figure 1b). The system then moved back over the Mozambique channel on 9 March (Figure 1c). Figure 1d shows a now intensified and mature tropical cyclone on 12 March over the Mozambique channel. Warm waters provide the needed energy to strengthen and sustain tropical cyclones because of increased latent heat fluxes.36 The system moved towards the west and made landfall on 14 March in the northern vicinity of Beira as an intense tropical cyclone.
The ERA5 reanalysis shows that the minimum pressure over the area between 14° and 24° south and 32° to 44° east, was recorded on 14 March. The maximum wind speed and rainfall over the same area were also recorded on the same day. The highest hourly rainfall total (21 mm) occurred at 20h00 UTC according to ERA5 reanalysis. Figure 2 shows the observed/estimated rainfall from ERA5, GPM, Convective Rainfall Rate and TAMSAT on 15 March. Although the amount and rainfall pattern associated with each of the data sets are different, all the observations indicate that heavy rainfall was received over Mozambique and the eastern parts of Zimbabwe on 15 March. All the observations except TAMSAT show rainfall amounts exceeding 200 mm over at least one area in Mozambique. A study that compared TAMSAT with other rainfall estimations showed that TAMSAT generally underestimated rainfall over Southern Africa.37 Convective Rainfall Rate, which is a combination of the estimated Convective Rainfall Rate from MSG and stratiform rainfall from the UM, shows rainfall peaks over the outskirts of the storm. The peaks are similar to those found in the UM simulations.
Idai moved inland and caused heavy rainfall over central Mozambique, and the eastern and central parts of Zimbabwe, while weakening at the same time. Tropical cyclones generally weaken and dissipate over land due to different surface properties which include topography, and the surface heat, moisture and momentum fluxes compared to those over the ocean.38 The rainfall associated with Idai and its remnants continued over the next few days and its remnants finally dissipated on 21 March. The World Bank estimated the direct economic losses from Cyclone Idai amounted to about USD622 million, including damage to infrastructure, properties, crops and livestock.39 The World Bank approved USD72 million to help with recovery needs of those affected in Zimbabwe; USD70 million in Malawi40, and USD130 million for Mozambique for both Idai and Kenneth41.
Numerical weather prediction - Idai
According to WMO, the reversing of the system back towards the Mozambican coastline was suggested by the European ensemble forecast from 6 March 2019.35 The track forecast uncertainty is reported to have reduced by 12 March, indicating that Idai would hit Beira. The WMO further reports that forecasters in the Mozambique National Meteorology Institute (INAM) have access to the NWP products through global centres such as the ECMWF, the UK Met Office, and the RSMC La Reunion. INAM also runs an inhouse Weather Research and Forecasting model with a grid spacing of 14 km. As already discussed, Figure 2 shows 24-h rainfall totals on the 15 March from different observations, representing a full day of torrential rainfall following landfall the night before. There is general agreement that a large amount of rainfall was received between 32° and 35° east and 18° to 21° south, with some differences across the observations.
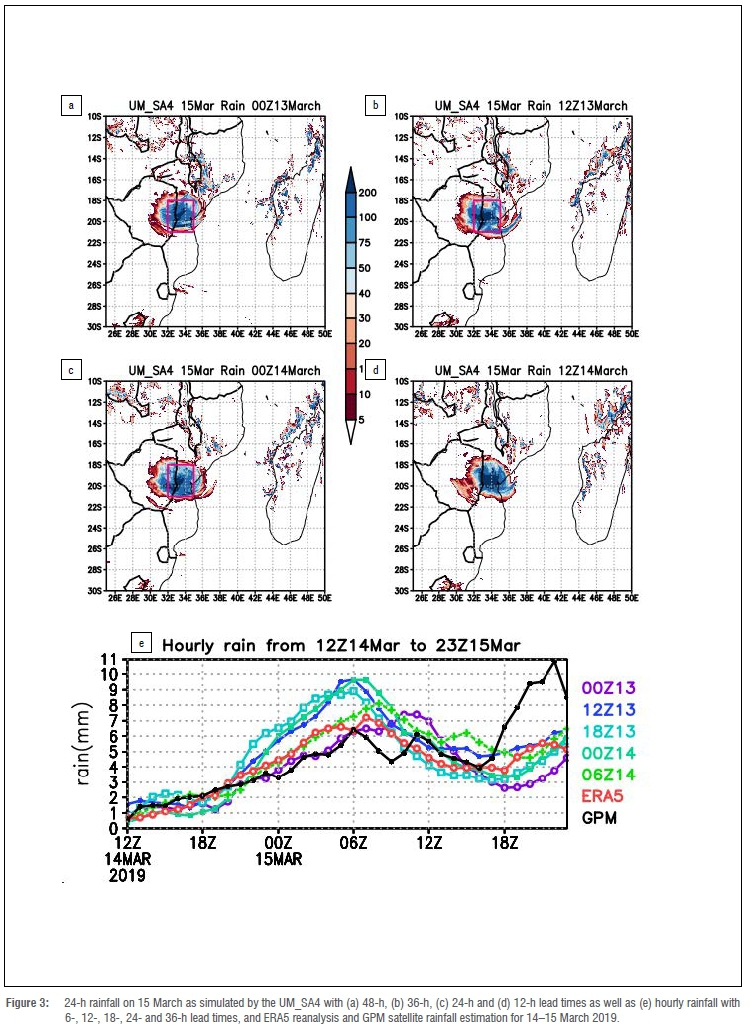
SAWS does not have a mandate to issue warnings directly to the public of neighbouring countries; however, as an RSMC, SAWS made NWP products from the UM produced locally available through the RSMC Pretoria website. Figure 3a-d shows UM simulations with different lead times ranging from 48 h to 12 h. A lead time represents the amount of time between the time at which the forecast is made to the forecast period. All the simulations agree on the area where Idai made landfall, and the position did not change as the lead time decreased. Figure 3e shows UM simulations of hourly area-averaged rainfall in the rectangle shown over Mozambique from 12h00 UTC on 14 March to 23h00 UTC on 15 March, with ERA5 (red) and GPM (black) data which represent observations. The rainfall curve from ERA5 follows a similar pattern to all the UM simulations with a rainfall maximum around 06h00 on 15 March. Generally, an improvement in skill is expected as the lead time reduces42; however, in this case, the UM simulations do not seem to change with the lead time. The consistency in the forecast with different lead times provides confidence to the forecasters and it also means the forecast statements did not need to be altered significantly when forecasts were updated. The first peak in GPM rainfall estimates occurs around 06h00, similar to the simulations; however, the rainfall is overestimated in the simulations, except in the 13 March 00Z which has the longest lead time of all the simulations. GPM shows a second peak at 11h00 that is not captured by the majority of the simulations except the 13 March 00Z forecast which has a later peak. The amount of rainfall as estimated by GPM increased significantly from around 17h00 on 15 March; however, this is not shown in the ERA5 reanalyses nor in any of the simulations.
Nowcasting to very short-range forecasting
Near real-time observations are essential for forecasters to be able to warn the public in real time as the event is occurring. Radar is considered the most important tool for nowcasting purposes22; however, there is currently no working radar in Mozambique. According to WMO, INAM has two radars which were installed in 2004 at Xai Xai and Beira35; however, these have not been operational for many years. Satellite data are also used for nowcasting purposes; INAM has access to satellite data from EUMETSAT and various data and products broadcast by EUMETSAT through EUMETCast.
INAM and other meteorological services within southern Africa have access to SARFFGS information, which relies on the Hydroestimator produced at SAWS (i.e. satellite data rainfall estimation). The SARFFGS uses the quantitative rainfall estimates from satellites to determine the amount of rain needed over a basin to cause flooding.26 The SARFFGS uses the UM rainfall data to provide very short-range forecasts for the river basins. Figure 4 shows an example of output from SARFFGS produced on 15 March 06h00, for 1-h, 3-h and 6-h lead times for Mozambican basins. The availability of the figure shows that the system was available to forecasters in the SADC region to warn officials with specific information on basins at risk of flooding in a few hours. The SARFFGS shows that smaller amounts of rainfall were needed to flood Beira and sounding areas. The amount needed to flood most of Mozambique reduces by forecast hour 6. The information provided by the SARFFGS can help resource managers make decisions quicker, and prioritise basins with a high probability of flooding sooner. The SARFFGS was available during the Idai tropical cyclone, but according to the WMO report, it was not used.35
Dissemination
SAWS issued a media release on the tropical cyclone on 12 March 2019, where the location of the tropical cyclone within the Mozambique channel was described together with the expected impact. The media release indicated that the tropical cyclone would move in a southwesterly direction and make landfall over the Mozambican coast. The media release referred to the La Reunion tropical cyclone RSMC forecast, which indicated that the cyclone would make landfall around Beira in the following 48-60 h (around Thursday night - 14 March 2019). The information provided included the expected rainfall, flooding and damaging winds. The locations that were likely to be impacted were mentioned, namely the Sofala and Manica provinces in Mozambique, extreme eastern parts of Zimbabwe and the southern parts of Malawi. SAWS continued to keep the public updated on the event using its Facebook and Twitter accounts, as well as through interviews requested by the media.
SAWS provides information through the WMO Severe Weather Forecasting Demonstration Project, and SARFFGS to meteorological services in the region. Figure 5 shows information provided by RSMC Pretoria for 15 March with different lead times. The green line shows areas where heavy rainfall/ flooding was expected. The 4-day and 3-day lead times indicated that heavy rainfall exceeding 50 mm was expected over the areas where the tropical cyclone made landfall. The forecast issued on 14 March increased this amount from 50 mm to 100 mm. The area covered by the green line started out smaller with a 4-day lead time, and increased to also cover the eastern parts of Zimbabwe when the forecast was issued the following day. This indicates that there was enough information provided days in advance of Idai making landfall. This information was available to all meteorological services in the region.
KZN floods
Event description
Due to its location, South Africa usually experiences mid-latitude systems that move towards the east. The cut-off lows can result in heavy rainfall flooding over parts of South Africa depending on their location. One such event occurred in April 2019 and resulted in widespread rainfall over a large part of the country, with heavy rainfall and flooding over KZN. The floods were devastating to the extent that the President of South Africa, Mr Cyril Ramaphosa, visited the affected areas, and the floods were declared as a provincial disaster. Figure 6 shows the ERA5 reanalysis rainfall overlaid with the geopotential height at 500 hPa level. On 20 April, there was a perturbation south of the country, with some rainfall over parts of the Northern Cape, and Free State provinces (Figure 6). The perturbation extended further into the country, and resulted in widespread precipitation which affected seven of South Africa's nine provinces at different levels. By 22 April 2019, a closed low is visible and located over the Northern Cape with large amounts of rainfall east of the centre of the system. The SAWS synoptic chart of the day shows that there was an associated ridging high which transported moisture from the Indian ocean overland.43 The moisture increase coupled with strong uplift due to the cut-off low resulted in large amounts of rainfall that caused flooding.
Large amounts of rainfall are shown over the southern parts of the KZN province and northern parts of the Eastern Cape province (Figure 6d, e). Fourteen weather stations in the southern parts of KZN reported over 100 mm of rainfall on 22 April (Figure 7a), with four of them continuing to report over 100 mm of rainfall the following day on 23 April. The Durban Kenneth Steinbank station reported 326 mm of rainfall, while Paddock reported 235 mm. The closed low persisted on 23 April, and caused more rainfall over the southern parts of KZN. By 24 April, the closed low was located over the eastern parts of the Western Cape and parts of the Eastern and Northern Cape. The largest amount of rainfall now fell over the ocean. The ERA5 reanalysis agrees with SAWS observations (Figure 7a), which can also be viewed on monthly or 10-day intervals on the SAWS website for the whole country.44
Numerical weather prediction
Figure 7 (b-i) shows the simulated precipitation from the UM with a grid spacing of 1.5 km and 4.4 km with different lead times, as well as from the ECMWF Integrated Forecast System model with a grid spacing of 16 km. The ECMWF provides the longest lead time and is plotted here up to a 4-day lead time. The ECWMF was able to capture the likelihood of the occurrence of the event well in advance, and this can be seen with the 4-day lead (Figure 7i); however, the amount of rainfall is underestimated.
As the forecast time approaches, the amount of rainfall that is predicted increases. The longest lead time for a full 24-h total precipitation that we can obtain from the UM_SA4 running locally is 48 h. The UM was able to capture the likelihood of the occurrence of large amounts of rainfall at this 2-day lead time; however, the forecast of heavy rainfall extended further north along the coast of KZN. This behaviour persisted and can also be seen with a 6-h lead time. The longest lead time that can be provided by the UM_SA1p5 for a full-day total precipitation is 12 h. The performance of the UM_SA1p5 is similar to that of UM_SA4, with both extending the heavy rainfall along the whole KZN coast.
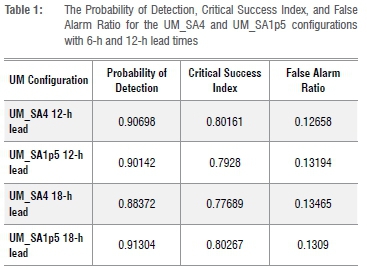
Table 1 shows three statistical measures, namely POD and CSI which range from 0 to 1, with 0 indicating no skill and 1 indicating a perfect score, as well as FAR which has the same range, with 0 indicating a perfect score and 1 no skill. The scores were calculated for the UM_SA4 and UM_SA1p5 for simulations with 12-h (12h00 initialisation on 21 April) and 6-h (18h00 initialisation on 21 April) lead times. The measures are calculated against GPM satellite rainfall estimates, and the model data were coarse-grained to the satellite data resolution. The UM_SA4 scores suggest that the 12-h lead simulation performed slightly better than the 6-h lead simulation, across all three scores. The opposite is true for the UM_SA1p5 simulation, where the simulation with the shorter lead time of 6 h performed slightly better. When comparing different resolutions, the UM_SA4(UM_SA1p5) performed slightly better than the UM_SA1p5 (UM_SA4) with a 12-h lead (6-hour lead). These results confirm the results shown in Figure 7 that the performance across the two UM configurations with different lead times is similar. All the UM configurations extended the heavy rainfall amounts across the whole of the KZN coast. If forecasters only relied on the UM rainfall to issue warnings, they would have extended the heavy rainfall warning across the whole of the KZN coast, which would have been a false alarm in the northern parts. These results show that shortcomings remain in models, and as a result, models need to be improved further with data assimilation, improved physics, and dynamics.
Nowcasting products
SAWS systems for nowcasting are based on radar, satellite and the lightning detection network. The RDT is based on satellite data and shows the location and phase of the storms, as well as the direction in which the storm is moving. Figure 8a shows an example of the RDT output which was made available to forecasters for 17h00 UTC on 22 April 2019. Figure 8a shows a large storm which is growing and expected to move southwards over KZN. These images are updated every 15 min, which is the baseline provided by MSG. It may be noted that countries that develop satellites receive updates more frequently than the African continent. For example, MSG provides updates every 5 min for Europe using rapid scanners.45
In South Africa, radar provides updates much quicker than satellite, every 6 min. Figure 8b shows output from a storm tracking system (TITAN), where the position of the storm and the direction the storm will take are indicated. The intense cells are captured much more easily by radar compared to the RDT satellite product. The red lines show the storm direction of these intense storms, and therefore provide forecasters with far more detailed information to use for issuing warnings in real time. This shows that it is important that radars remain operational and are maintained to provide the necessary information that can reduce the impact of severe weather events. Many African countries do not have radar systems and therefore rely on satellite data. The SAFFGS was also available for SAWS forecasters to use to provide relevant officials with information on river basins most at risk of flooding. For South Africa, the rainfall estimate is provided by radar when available.
Dissemination
The SAWS Disaster Risk Reduction Centre is responsible for issuing forecasts which include watches, alerts and warnings. Figure 9 shows a forecast that went out on 21 April 2019 in the afternoon (around 14h00 UTC) to the media for the following day. Figure 9 shows that SAWS issued a warning for parts of KZN and the Eastern Cape that experienced large amounts of rainfall. The warning was not extended across the whole KZN coast as was predicted by the UM simulations, but only showed for areas indicated by the ECMWF model. Those who watch the weather forecast on television stations that broadcast forecasts/warnings from SAWS would have seen this warning the day before the event occurred. As the event was taking place, SAWS continued to communicate with the public through its Twitter and Facebook accounts.
As with this event, SAWS has also noticed that despite warnings going out in advance, impacts of adverse weather events continue to ravage the country. SAWS is working actively to increase its reach in South Africa by using different platforms. One of these platforms is a WeatherSmart app, which is a free mobile app that shows the location of the storm and direction in which the storm is moving. Information on storm movements that is provided by the app is based on radar information. Further, SAWS is also embarking on a project to reach a larger listenership across South Africa. The number of community radio stations receiving information from SAWS increased from 30 in the 2016/2017 financial year to 86 during 2017/2018. This number further increased to 140 community radio stations during the last quarter of the 2018/2019 financial year. This indicates an increase in listenership from 984 000 in 2017/2018 to 4 326 000 in the first quarter of 2019.
Summary and conclusions
In this study, we evaluated the availability and performance of SAWS weather information during the Idai tropical cyclone which resulted in over 1000 deaths, as well as the floods that took place in KZN province in April 2019, resulting in over 70 fatalities. We have looked at output from NWP models as well as nowcasting systems. With the Idai tropical cyclone, we show that there was confidence in the forecasts 2 days before Idai made landfall over Mozambique to the extent that a media release was issued by SAWS. The UM, which is the main NWP model of SAWS, was consistent with its forecast, and the forecast did not change much as the lead time changed. The RSMC Pretoria issued warnings which should have been available for all forecasters in the SADC region to see to issue warnings within their countries. We also showed output from the SARFFGS which provides flash flood guidance for river basins which was also available to be used by forecasters in countries affected by Idai.
We also discuss the Durban floods that were caused by a cut-off low which encouraged uplift, accompanied by a ridging high-pressure system which transported moisture from the Indian Ocean into the country. We show that warnings were issued and communicated to the local media at least a day in advance. The UM and the ECMWF were both able to capture the event; however, the ECMWF captured the location of the heavy rainfall better. Neither model was able to capture the actual rainfall amounts associated with the event, and this shows that models need further improvement. In terms of dissemination of information, we discuss the radar and satellite products that are used for the nowcasting timescale, and which forecasters use and communicate with the media as well as the disaster risk management centres at different levels (i.e. national, provincial and local). We also discuss the WeatherSmart app which uses radar information as input and which the community can use to check storm occurrence. To reach more South Africans, SAWS is also increasing the number of community radio stations that receive weather information.
The study shows that more needs to be done to improve models further, to increase community weather awareness and to reduce community vulnerability to extreme weather events. Suarez46 pointed to the underutilisation of the available science by humanitarian organisations and people at risk, with extreme events being allowed to become deadly events due to a failure to act. This he attributed to humanitarian organisations not being able to build institutional and stakeholder capacity to use the available tools, and he recommended a transition from action-based to knowledge-based entities that can effectively use newly available tools. De Perez47 developed a forecast-based finance system that can trigger action based on weather/climate forecasts or observations, while accounting for the possibility of false alarms. In their classification of African countries' Disaster Risk Management policies, Tall48 classified both South Africa and Mozambique as disaster averters (best category of 3); however, the two events described in this paper show that more needs to be done to improve disaster preparedness and reduce risk in both countries.
Acknowledgements
We acknowledge SAWS for supporting this study as well as the anonymous reviewers who helped improve the paper. This work was also partially supported through the Climate Research for Development (CR4D) Postdoctoral Fellowship CR4D-19-11 implemented by the African Academy of Sciences (AAS) in partnership with the United Kingdom's Department for International Development (DfID) Weather and Climate Information Services for Africa (WISER) programme and the African Climate Policy Center (ACPC) of the United Nations Economic Commission for Africa (UNECA).
Competing interests
We declare that there are no competing interests.
Authors' contributions
M.M.B.: Conceptualisation, data collection, data analysis, writing. E.S., B.M.: Conceptualisation, data collection. T.N.: Conceptualisation, design of the study, writing. M.N., E.P: Data collection and analysis. M.G., S.L., G.R., L.v.H., M.M.: Data collection.
References
1. De Carli M, Olesen BW, Zarrella A, Zecchin R. People's clothing behaviour according to external weather and indoor environment. Build Environ. 2007;42(12):3965-3973. https://doi.org/10.1016/j.buildenv.2006.06.038 [ Links ]
2. Akin D, Sisiopiku VP Skabardonis A. Impacts of weather on traffic flow characteristics of urban freeways in Istanbul. Procedia-Soc Behav Sci. 2011;16:89-99. https://doi.org/10.1016/j.sbspro.2011.04.432 [ Links ]
3. Staffella I, Pfenninger S. The increasing impact of weather on electricity supply and demand. Energy. 2018;145:65-78. https://doi.org/10.1016/j.energy.2017.12.051 [ Links ]
4. Centre for Research on the Epidemiology of Disasters (CRED). The human cost of weather related disasters 1995-2015 [document on the Internet]. c2015 [cited 2020 Jun 09]. Available from: https://reliefweb.int/sites/reliefweb.int/files/resources/COP21_WeatherDisastersReport_2015_FINAL.pdf [ Links ]
5. Lubchenco J, Karl TR. Predicting and managing extreme weather events. Physics Today. 2012;65(3):31. https://doi.org/10.1063/PI3.1475 [ Links ]
6. Pielke R, Carbone RE. Weather impacts, forecasts, and policy. Bull Amer Meteor Soc. 2002;83:393-406. https://doi.org/10.1175/1520-0477(2002)083<0393:WIFAP>2.3.CO;2 [ Links ]
7. Tyson PD, Preston-Whyte RA. The weather and climate of southern Africa. 2nd ed. Cape Town: Oxford University Press; 2000. [ Links ]
8. Lukamba MT. Natural disasters in African countries: What can we learn about them. J Transdiscip Res South Afr. 2010;6(2):478-495. https://doi.org/10.4102/td.v6i2.266 [ Links ]
9. South African Department of Environmental Affairs (DEA). Climate information and early warning systems for supporting the disaster risk reduction and management sector in South Africa under future climates. In: Munzhedzi SM, Khavhagali VP Midgley GM, de Abreu P Scorgie S, Braun M, et al., editors. Long-Term Adaptation Scenarios Flagship Research Programme. Pretoria: DEA; 2016. p. 31-43. Available from: https://www.environment.gov.za/sites/default/files/reports/ltasbook2of7_climateinformationandearlywarningsystemsforsupportingtheDRR.pdf [ Links ]
10. Harrison MSJ. A generalized classification of South African summer rain-bearing synoptic systems. J Climatol. 1984;4:547-560. https://doi.org/10.1002/joc.3370040510 [ Links ]
11. Hart NCG, Reason CJC, Fauchereau N. Cloud bands over southern Africa: Seasonality, contribution to rainfall variability and modulation by the MJO. Clim Dyn. 2013;41:1199-1212. https://doi.org/10.1007/s00382-012-1589-4 [ Links ]
12. Favre A, Hewitson B, Tadross M, Lennard C, Cerezo-Mota R. Relationships between cut-off lows and the semiannual and southern oscillations. Clim Dyn. 2011;38:1473-1487. https://doi.org/10.1007/s00382-011-1030-4 [ Links ]
13. Malherbe J, Engelbrecht FA, Landman WA, Engelbrecht CJ. Tropical systems from the southwest Indian Ocean making landfall over the Limpopo River Basin, southern Africa: A historical perspective. Int J Climatol. 2012;32:1018-1032. https://doi.org/10.1002/joc.2320 [ Links ]
14. Changnon SA, Pielke RA, Changnon D, Sylves RT, Pulwarty R. Human factors explain the increased losses from weather and climate extremes. Bull Amer Meteor Soc. 2000;81:437-442. https://doi.org/10.1175/1520-0477(2000)081<0437:HFETIL>2.3.CO;2 [ Links ]
15. Shapiro A, Jonathan L. He thought his city was prepared for big storms. Then Cyclone Idai hit. NPR. 2019 April 10. Available from: https://www.npr.org/sections/goatsandsoda/2019/04/10/711576607/he-thought-his-city-was-prepared-for-big-storms-then-cyclone-Idai-hit [ Links ]
16. Al Jazeera and New Agencies. Death toll from devastating Cyclone Idai rises above 1000. Aljazeera Media Network. 2019 April 10. https://www.aljazeera.com/news/2019/04/death-toll-devastating-cyclone-Idai-rises-1000-190410155136406.html [ Links ]
17. BBC News. South Africa floods: Death toll after Durban rains rises to 60. BBC. 2019 April 24. https://www.bbc.com/news/world-africa-48036252 [ Links ]
18. Singh O. Killer KZN floods declared a provincial disaster. TimesLive. 2019 May 02. https://www.timeslive.co.za/news/south-africa/2019-05-02-killer-kzn-floods-are-declared-a-provincial-disaster/ [ Links ]
19. Sai F, Cumiskey L, Weerts A, Bhattacharya B, Khan R. Towards impact-based flood forecasting and warning in Bangladesh: A case study at the local level in Sirajganj district. Nat Hazard Earth Sys. 2018:1-20. https://doi.org/10.5194/nhess-2018-26 [ Links ]
20. Weyrich P, Scolobig A, Bresch DN, Patt A. Effects of impact-based warnings and behavioral recommendations for extreme weather events. Weather Clim Soc. 2018;10:781-796. https://doi.org/10.1175/WCAS-D-18-0038.1 [ Links ]
21. Silvestro F, Rossi L, Campo L, Parodi A, Fiori E, Rudari R, et al. Impact-based flash-flood forecasting system: Sensitivity to high resolution numerical weather prediction systems and soil moisture. J Hydrol. 2019;572:388-402. https://doi.org/10.1016/j.jhydrol.2019.02.055 [ Links ]
22. Browning KA. The role of radar in weather forecasting. Phys Technol. 1983;14(3):140. https://doi.org/10.1088/0305-4624/14/3/I03 [ Links ]
23. Dixon M, Wiener G. TITAN: Thunderstorm Identification, Tracking, Analysis, and Nowcasting - A radar-based methodology. J Atmos Oceanic Technol. 1993;10:785-797. https://doi.org/10.1175/1520-0426(1993)010<0785:TTITAA>2.0.CO;2 [ Links ]
24. Becker EH. Application of a quantitative precipitation estimation algorithm for the S-Band radar at Irene, South Africa [MSc dissertation]. Durban: University of KwaZulu-Natal; 2014. http://hdl.handle.net/10413/12795 [ Links ]
25. De Coning E, Gijben M, Maseko B, Van Hemert L. Using satellite data to identify and track intense thunderstorms in South and southern Africa. S Afr J Sci. 2015;111(7/8), Art. #2014-0402, 9 pages. http://dx.doi.org/10.17159/SAJS.2015/20140402 [ Links ]
26. De Coning E, Poolman E. South African Weather Service operational satellite based precipitation estimation technique: Applications and improvement. Hydrol Earth Syst Sci. 2011;15:1131-1145. https://doi.org/10.5194/hess-15-1131-2011 [ Links ]
27. Davies T, Cullen MJP, Malcolm AJ, Mawson MH, Staniforth A, White AA, et al. A new dynamical core for the MetOffice's global and regional modelling of the atmosphere. Quart J R Meteorol Soc. 2005;131:1759-1782. https://doi.org/10.1256/qj.04.101 [ Links ]
28. Landman S, Engelbrecht FA, Engelbrecht CJ, Dyson LL, Landman WA. A short-range weather prediction system for South Africa based on a multimodel approach. Water SA. 2012;38(5):765-774. http://www.scielo.org.za/scielo.php?script=sci_arttext&pid=S1816-79502012000500016 [ Links ]
29. Haiden T, Janousek M, Bidlot J-R, Buizza R, Ferranti L, Prates F, et al. Evaluation of ECMWF forecasts, including the 2018 upgrade. ECMWF Technical Memoranda. 2018. https://doi.org/10.21957/ldw15ckqi [ Links ]
30. Hersbach, H, Dee D. ERA5 reanalysis is in production. ECMWF Newsletter 147. Reading: ECMWF; 2016. Available from: https://www.ecmwf.int/en/newsletter/147/news/era5-reanalysis-production [ Links ]
31. Huffman GJ, Stocker EF, Bolvin DT, Nelkin EJ, Jackson T. GPM IMERG final precipitation L3 half hourly 0.1 degree x 0.1 degree V06 [data set]. Greenbelt, MD: Goddard Earth Sciences Data and Information Services Center (GES DISC); 2019 [cited 2020 Jun 09]. https://doi.org/10.5067/GPM/IMERG/3B-HH/06 [ Links ]
32. Maidment R, Grimes D, Black E, Tarnavsky E, Young M, Greatrex H, et al. A new, long-term daily satellite-based rainfall dataset for operational monitoring in Africa. Sci Data. 2017;4, Art. #170063. https://doi.org/10.1038/sdata.2017.63 [ Links ]
33. Jolliffe IT, Stephenson DB. Forecast verification. A practitioner's guide in atmospheric science. Hoboken, NJ: John Wiley & Sons Ltd.; 2003. [ Links ]
34. South African Weather Service (SAWS). Regional Specialized Meteorological Centre (RSMC) [webpage on the Internet]. No date [cited 2020 Jun 09]. Available from: http://rsmc.weathersa.co.za [ Links ]
35. World Meteorological Organization. Reducing vulnerability to extreme hydro-meteorological hazards in Mozambique after Cyclone IDAI. WMO mission report following tropical Cyclone IDAI (29 April - 7 May 2019) [webpage on the Internet]. c2019 [cited 2020 Jun 09]. Available from: https://public.wmo.int/en/resources/library/reducing-vulnerability-extreme-hydro-meteorological-hazards-mozambique-after [ Links ]
36. Gao S, Jia S, Wan Y Li T, Zhai S, Shen X. The role of latent heat flux in tropical cyclogenesis over the western North Pacific: Comparison of developing versus non-developing disturbances. J Mar Sci Eng. 2019;7:28. https://doi.org/10.3390/jmse7020028 [ Links ]
37. Seyama S, Masocha M, Dube T. Evaluation of TAMSAT satellite rainfall estimates for southern Africa: An inter-product comparison study. Phys Chem Earth A/B/C. 2019;112:141-153. https://doi.org/10.1016/j.pce.2019.02.008 [ Links ]
38. Wong ML, Chan JC. Tropical cyclone motion in response to land surface friction. J Atmos Sci. 2006;63:1324-1337. https://doi.org/10.1175/JAS3683.1 [ Links ]
39. Verner D. Restoring Zimbabwe's livelihoods, infrastructure after Cyclone Idai [webpage on the Internet]. c2019 [cited 2020 Jun 09]. Available from: https://www.worldbank.org/en/news/feature/2019/09/16/restoring-zimbabwes-livelihoods-infrastructure-after-cyclone-idai [ Links ]
40. Nabeta L. World Bank helps Malawi recover from Cyclone Idai [webpage on the Internet]. c2019 [cited 2020 Jun 09]. Available from: https://www.worldbank.org/en/news/press-release/2019/06/06/world-bank-helps-malawi-recover-from-cyclone-idai [ Links ]
41. Saute R. World Bank injects $130 million in support of recovery efforts in cyclones affected communities [webpage on the Internet]. c2019 [cited 2020 Jun 09]. Available from: https://reliefweb.int/report/mozambique/world-bank-injects-130-million-support-recovery-efforts-cyclones-affected [ Links ]
42. Stern H, Davidson NE. Trends in the skill of weather prediction at lead times of 1-14 days. Q J R Meteorol Soc. 2015;141:2726-2736. https://doi.org/10.1002/qj.2559 [ Links ]
43. South African Weather Service. Synoptic weather map [document on the Internet]. c2019 [cited 2020 Jun 09]. Available from: http://www.weathersa.co.za/Documents/Publications/20190422.pdf [ Links ]
44. South African Weather Service. Historical rain [webpage on the Internet]. c2020 [cited 2020 Jun 09]. Available from: http://www.weathersa.co.za/home/historicalrain [ Links ]
45. Gallucci D; Romano F, Cimini D, Di Paola F, Gentile S, Larosa S, et al. Improvement of hourly surface solar irradiance estimation using MSG rapid scanning service. Remote Sens. 2019;11:66. https://doi.org/10.3390/rs11010066 [ Links ]
46. Suarez P Linking climate knowledge and decisions: Humanitarian challenges. Boston, MA: Boston University Frederick S. Pardee Center for the Study of the Longer-Range Future; 2009. Available from: http://www.bu.edu/pardee/publications/pardee-paper-007-climate [ Links ]
47. De Perez EC, Van den Hurk B, Van Aalst MK, Jongman B, Klose T, Suarez P Forecast-based financing: An approach for catalyzing humanitarian action based on extreme weather and climate forecasts. Nat Hazard Earth Sys. 2015;15:895-904. https://doi.org/10.5194/nhess-15-895-2015 [ Links ]
48. Tall A, Patt A, Fritz S. Reducing vulnerability to hydro-meteorological extremes in Africa. A qualitative assessment of national climate disaster management policies: Accounting for heterogeneity. Weather Clim Extremes. 2013;1:4-16. https://doi.org/10.1016/j.wace.2013.07.007 [ Links ]
 Correspondence:
Mary-Jane Bopape
Email: mary-jane.bopape@weathersa.co.za
Received: 30 Jan. 2020
Revised: 09 June 2020
Accepted: 15 Oct. 2020
Published: 29 Mar. 2021
Editor: Yali Woyessa
Funding: Climate Research for Development (CR4D) Postdoctoral Fellowship (CR4D-19-11) of the African Academy of Sciences (AAS) in partnership with the UK Department for International Development (DfID) Weather and Climate Information Services for Africa (WISER) programme and the African Climate Policy Centre (ACPC) of the United Nations Economic Commission for Africa (UNECA)

