


Servicios Personalizados
Articulo
 Inglés (pdf)
 Articulo en XML
 Referencias del artículo
Indicadores

Links relacionados
-
 Citado por Google
 -
 Similares en Google
Compartir

 Permalink
South African Journal of Science
versión On-line ISSN 1996-7489
versión impresa ISSN 0038-2353
S. Afr. j. sci. vol.117 no.3-4 Pretoria mar./abr. 2021
http://dx.doi.org/10.17159/sajs.2021/7507
RESEARCH ARTICLE
Identifying potential protected areas in the Grassland Biome of South Africa
Hélen Prinsloo; Brian Reilly; Willem Myburgh
Department of Nature Conservation, Tshwane University of Technology, Pretoria, South Africa
ABSTRACT
South Africa is considered to be one of the most biologically diverse countries in the world. The conversion, degradation, and fragmentation of natural habitats have caused a loss of biodiversity in many areas. Grasslands have been widely recognised as important for both biodiversity and economic development. Many conservation efforts have in the past been theory driven, without actionable, feasible results. We hypothesised that correct implementation of the available data will indicate where conservation efforts should be focused to move closer to achieving targets for biodiversity conservation in the Grassland Biome in South Africa. We identified an area (near Heilbron and Petrus Steyn in the Free State) that is representative of the biodiversity in the region and is suitable for modern conservation efforts in the 'real world'. This approach provides a practical look at conservation in the modern era and a feasible result for conservation efforts.
SIGNIFICANCE:
• An area in the Free State Province was identified that has a high level of biodiversity representative of the Grassland Biome in South Africa. A subjective process was implemented to ensure that the area represents the factors that are considered important for conservation, land use and appropriate location in order to make the area a feasible target for conservation. The result therefore represents not only a theoretical finding that is based on data analysis, but also a practical approach to ensure that the findings can be implemented. This study is an effort to provide a baseline for a more modern approach to conservation, in which current land use, economic value and conservation value are all considered to achieve a sustainable result in terms of the conservation of biodiversity.
Keywords: biodiversity, conservation, ecosystem, services, focus areas, Heilbron-, Petrus Steyn Target Area
Introduction
The need for conservation
Grasslands have been widely recognised as important for both biodiversity and economic development. They occur within a range of climates from semi-arid (400 mm mean annual precipitation) to moist (1000 mm mean annual precipitation).1
The Grassland Biome is the second largest biome in South Africa and covers 29% of South Africa's land area (339 237 km2). It harbours many species of birds, mammals, reptiles and butterflies and it is the preferred habitat for South Africa's national bird, the blue crane (Anthropoides paradiseus), the critically endangered blue swallow (Hirundo atrocaerulea), oribi (Ourebia ourebi) and the vulnerable sungazer lizard (Smauggiganteus). Nearly half of South Africa's Red Listed butterfly species (28/60 = 46.7%) occur in the Grassland Biome.2 The Grassland Biome is considered to have extremely high species diversity, second only to the well-known Fynbos Biome, and includes many rare and threatened species, but is one of the most critically threatened southern African ecosystems.3
Grasslands provide essential ecosystem services that are necessary for economic development, but are in turn threatened by some of these developments.4 The major land uses of the Grassland Biome include urban development (South Africa's largest urban and industrial area of Gauteng is located entirely within the Grassland Biome), coal mining (mainly in Mpumalanga), plantation forestry (mainly in KwaZulu-Natal and Mpumalanga), as well as agriculture, including cultivation and livestock production. If these activities are located in the correct areas and managed appropriately, they offer opportunities to align development and conservation objectives. The intention of biodiversity or grassland conservation should therefore not be to prevent development, but to ensure that it is appropriately located and managed.5
Biodiversity conservation planning in South Africa
Since the 2000s, South Africa has attempted an outcome-based, modern approach to biodiversity conservation that has been fine-tuned and measured consistently and from different angles. This approach included the compilation and publication of various documents and plans such as the National Spatial Biodiversity Assessment - Terrestrial Component4, the National Protected Areas Expansion Strategy6, South Africa's Fourth National Report to the Convention on Biological Diversity5and South Africa's Fifth Annual Report to the Convention of Biological Diversity7.
Threats to biodiversity
The conversion, degradation, and fragmentation of native habitats are widely recognised among ecologists as the principal causes of biotic impoverishment.8,9 The loss and fragmentation of native habitats caused by agricultural development and conversion of agricultural lands into urban sprawl are generally considered the most serious modern threats to the conservation of biodiversity.10 Habitat loss, habitat degradation and invasive alien species are considered the greatest threat specifically, but not exclusively, to plant species.5 Activities such as agriculture, infrastructure, housing and industrial development, amongst others, require land clearance, which causes habitat destruction, fragmentation, disturbance of ecosystems and species loss.11-14
Biodiversity targets
The Fifth World Parks Congress in Durban, South Africa, announced in September 2003 that the global network of protected areas then covered 11.5% of the planet's land surface. This surpassed the 10% target proposed a decade earlier, at the Caracas Congress, for 9 of 14 major terrestrial biomes.15 Rodrigues et al.15 recognised the challenges with setting such uniform targets based on percentage of area that, at that stage, had become deeply embedded into national and international conservation planning. Although politically expedient, the scientific basis and conservation value of these targets were being questioned.15
Modern conservation efforts have started setting conservation targets by incorporating biodiversity priority areas, rather than a 'blind' percentage of available land. When biodiversity priority areas are identified, biodiversity has to be measured, biodiversity goals have to be set and methods for implementing those goals have to be applied.16
Even though vast amounts of data are available on the processes needed to achieve biodiversity conservation targets, the knowledge is not translating into action and providing the necessary benefits to biodiversity conservation. This led us to hypothesise that correct implementation of the available data will indicate where conservation efforts should be focused to move closer to achieving targets for biodiversity conservation in the Grassland Biome. This should be done using a 'real-world' approach incorporating reality into the data. To investigate this hypothesis, we formulated three key objectives:
1. Identify focus areas for conservation in the Grassland Biome.
2. Apply filters and assumptions to identify a case study area.
3. Identify the most suitable polygon within the study area to be the target for conservation efforts.
Methods
Over the last 25 years, South Africa has gradually changed its approach to conservation planning, moving away from the ad hoc method and towards the aim of establishing a functional network of biodiversity protection. While the initial focus was on getting the policies and legislation in place, South Africa has also developed strategies and plans that support the policies and legislation for biodiversity management. The National Spatial Biodiversity Assessment, completed in 2004, provides a spatial picture of the location of threatened and under-protected ecosystems. This largely informed the National Biodiversity Strategy and Action Plan, which was finalised after comprehensive stakeholder participation, and sets out a comprehensive long-term strategy for the conservation and sustainable use of South Africa's biodiversity. The National Biodiversity Framework distils the thematic and spatial priority actions from the National Biodiversity Strategy and Action Plan and National Spatial Biodiversity Assessment for the 5-year period from 2008 to 2013.5
The methodology of this study was based on that recommended by Bourgeron et al.17 It required:
1. Delineating a set of land units from which candidate areas were selected. In this case the Grassland Biome was chosen and all 'land units' within it were considered candidate areas.
2. Determining the suitability of these land units for conservation based on their ecological conditions. This was done by relying on the data that were collected and represented in the various available regional, provincial and municipal biodiversity conservation plans.
3. Selecting land units for inclusion in a conservation network. Many different iterations of selections were run according to the selection criteria described below to reach one primary target area.
Identify focus areas for conservation in the Grassland Biome
The available data sets on biodiversity at national, provincial and municipal scales were acquired from the South African National Biodiversity Institute (SANBi) Biodiversity Geographic Information Systems (BGIS) database or the provincial governments directly in the form of shapefiles. A full list of all the data sets incorporated can be obtained on request.
All the shapefiles were incorporated into ArcGIS 10.1 (hereafter referred to as GIS (Geographic Information Systems)) and a stepwise procedure was followed to run iterations to identify potential focus areas. The steps are described in order below.
The 'Grassland Biome' shapefile was isolated by importing the 'vegm2006 Biomes' shapefile as issued by Mucina and Rutherford18 and extracting all the polygons that had the 'Grassland Biome' attribute. All the provincial data sets were then clipped (using the Geoprocessing/ Clip tool in GIS) to the 'Grassland Biome' shapefile to select those polygons from all the shapefiles that fell within the Grassland Biome. The Grassland Biome outline was then dissolved to provide contiguous areas where applicable (using the Geoprocessing/Dissolve tool in GIS).
The individual provinces used different classification systems to attribute a biodiversity conservation value to the provincial polygons. All the categories used can be provided on request. All the categories from the provincial databases that related to protected areas were extracted per province. This extraction was done by selecting, by attribute, the relevant category in each of the provincial shapefiles and exporting these data to create a 'Protected Area' shapefile for each province. All of these shapefiles were then combined (using the Geoprocessing/Merge tool in GIS) with the 'SANBI Protected Areas' shapefile to create a 'Combined Protected Areas' shapefile. The categories in each province that related to Critical Biodiversity Areas (CBA), regardless of the subcategory (excluding protected areas), were then selected (using 'Select by category' in GIS) and exported to create a CBA shapefile for each province. These shapefiles were then combined (using the Geoprocessing/Merge tool in GIS) to form a CBA shapefile for the Grassland Biome. The categories in each province that related to Irreplaceable Critical Biodiversity Areas, were then selected (using 'Select by category' in GIS) and exported to create a 'CBA-Irreplaceable' shapefile for each province. These shapefiles were then combined (using the Geoprocessing/Merge tool in GIS) to form a 'CBA-Irreplaceable' shapefile for the Grassland Biome. The CBA-Irreplaceable shapefiles were dissolved to create contiguous areas where possible.
Apply filters and assumptions to identify a case study area
At this point a subjective method was implemented after investigating perceived biological and socio-economic factors to narrow down the case study area. The assumptions and subjective criteria used to identify a final case study area are described below.
Mpumalanga is the hub of coal mining in South Africa, causing a considerable threat to the grassland in this province. This can certainly be seen as a reason to prioritise conservation of grasslands in Mpumalanga. The grassland in Mpumalanga is as valuable to biodiversity as any other grassland and should not be discounted. However, the aim of the study was not only to identify areas that are important from a biodiversity aspect, but also to look at the easiest and most efficient way of attaining and managing these areas. A never-ending political war between conservation of biodiversity and the economic and social value of coal mining is considered impractical for achieving optimum results for conservation. The Mpumalanga Province was therefore discarded as a potential case study area.
For KwaZulu-Natal, the assumption was that very successful conservation efforts were already undertaken by Ezemvelo KZN Wildlife, and through the creation of the uKhahlamba Drakensberg Park and the Maloti-Drakensberg Park UNESCO World Heritage site (Maloti-Drakensberg Park), making this particular area already well represented in terms of conservation. Even though the formally protected areas still fall short of conservation targets, the percentage area that is protected is high in relation to other provinces and it was decided to exclude KwaZulu-Natal based on its adequate level of conservation success.
We assumed that the high population density in Gauteng Province would result in large, transformed areas, habitat fragmentation and a more complicated approach to management. Taking into consideration the rapid expansion of formal and informal settlements in the region in addition to the high level of habitat transformation, it was decided that, although important areas for conservation exist in the province, management of these areas will be a big challenge politically and practically. For the purpose of this study, that is combining scientific value with practical implication of conservation, it was decided to discard the Gauteng Province as a potential case study area.
Very small portions of the Grassland Biome occur in the Northern Cape and Western Cape Provinces with 412 873 ha in the Northern Cape and only 14 673 ha in the Western Cape. In the case of the Northern Cape, the sections of grassland occurring in the province are on the edge of the Grassland Biome. In the case of the Western Cape, the grassland sections are completely isolated and removed from the rest of the Grassland Biome. Based on these characteristics, the Northern Cape and Western Cape grassland patches were discarded as potential areas.
There was no obvious assumption for discarding any of the remaining three provinces - North-West, Eastern Cape and the Free State. No excessive development threat or habitat degradation occurred in any of the provinces and none of them proved to be well protected. We therefore based our decision on the level of current protection of the grasslands in the remaining provinces. The Free State Province was singled out as it has the lowest percentage of formally protected grasslands (0.91%). The Free State Province also contains a total of 10 914 757 ha of grassland, a larger area of Grassland Biome than any of the other provinces.
An overview of the protected areas occurring in the Free State showed that, even though only 28.83% of the Free State grasslands occurred in the mountainous region including the Drakensberg and Maloti mountain ranges, 55.65% of the protected grassland areas in the Province occurred in this area. Based on this, the mountainous region was discarded and only the non-mountainous area of the Free State Province was further evaluated as a potential case study area.
Identify the most suitable polygon to be the target
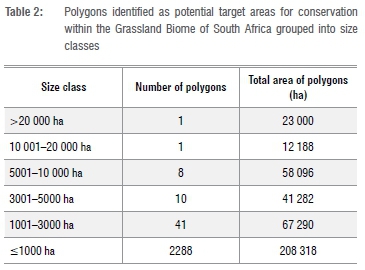
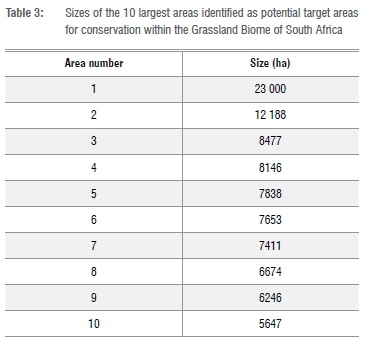
The remaining polygons were sorted according to size to determine which size classes would be feasible for further analysis. The 'real-world' idea here was that larger contiguous areas will be more practical for conservation management and it was decided to use the largest areas available for further analysis. Areas were grouped into the following categories: >20 000 ha, 10 001-20 000 ha, 5001-10 000 ha, 3001-5000 ha, 1001-3000 ha and <1000 ha. The 10 largest focus areas were singled out for further investigation in a shapefile called 'target_area_step_1'. A buffer zone of 1 km was established around each of the 10 areas that were selected in the previous step. Where this buffer zone overlapped with another target area that had already been identified, the overlapping areas were joined and a new buffer of 1 km was established around the joined areas. This approach continued until all the target areas and focus areas within 1 km of each other were identified and combined into 'Total Target Areas'.
Each target area was then evaluated according to percentage transformed, other vegetation types occurring, percentage road cover, distance to the edge of the Grassland Biome and percentage urban areas. 'Percentage transformed' was calculated using the data from the 2013-2014 National Land Cover map19 created by the South African Department of Environmental Affairs. All the transformed categories were selected and calculated for each target area. Because only imagery was available, and not shapefiles, the transformed area was estimated by consulting the map. Other vegetation types were estimated through analysis of data from the 2013-2014 National Land Cover19 map. This map showed that a large percentage of land contains more shrubland than grassland and these areas were also estimated. The percentage area under road coverage was calculated by adding a layer containing all the South African roads (obtained from the South African Department of Agriculture, Forestry and Fisheries). For primary roads (according to the shapefile), a width of 15 m was used. This was calculated using the SANRAL specifications20 stipulating the tarred width of a two-lane carriage way at 13.4 m. It was rounded up to 15 m to provide for an additional buffer of disturbance. The width of secondary roads was rounded to 10 m. This was assuming that the road width would be approximately the same as a primary road, but the shoulders (2.5 m on each side according to SANRAL20) would not be tarred. To incorporate minimisation of edge effects, the distance to the nearest edge of the Grassland Biome was measured for each target area. Percentage urban areas was then estimated using the imagery data from the 2013-2014 National Land Cover map.19
Results
Gross results
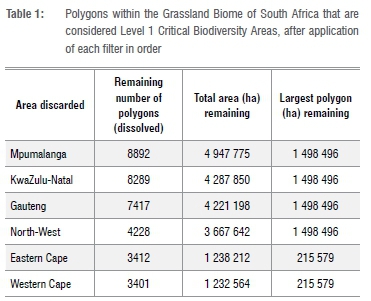
Table 1 provides the results after each assumption or filter was applied. After discarding Mpumalanga, 13.95% of the Grassland Biome remained. When the polygons from KwaZulu-Natal Province had been discarded, 12.09% of the Grassland Biome remained. Removal of the Gauteng Province polygons resulted in 11.9% of the Grassland Biome remaining. Further removal of the polygons from the North-West Province resulted in 10.34% of the Grassland Biome remaining. The polygons from the Eastern Cape and Western Cape were then removed, resulting in 3.49% and eventually 3.48% of the Grassland Biome remaining. Application of the final assumption resulted in polygons from the Free State highlands being discarded, leaving a total of 2349 polygons covering an area of 410 176.97 ha or 1.16% of the Grassland Biome. Tables 2 and 3 show the remaining areas sorted according to size, and finally the 10 largest areas that were selected for further analysis.
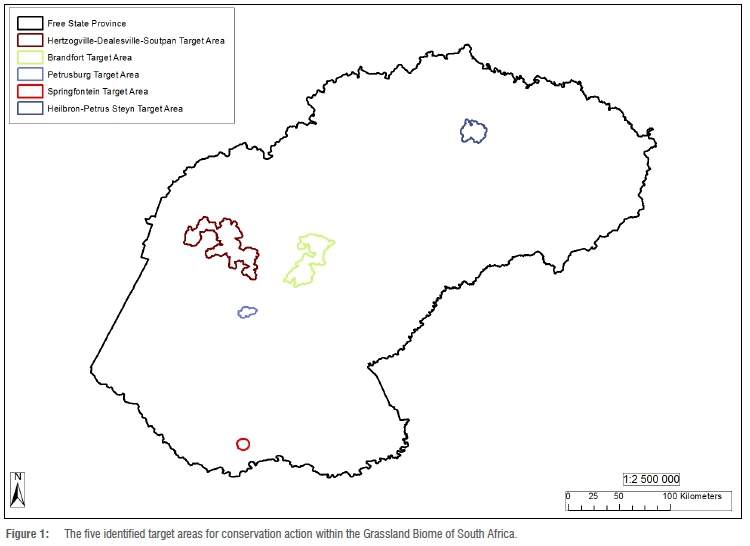
Implementation of the buffer zone resulted in the identification of five target areas (TA): one located in the northeastern Free State between Heilbron and Petrus Steyn, three located in the central Free State near the towns of Dealesville, Brandfort and Petrusburg, and one located in the southern Free State near Springfontein. The target areas were named for the towns and therefore were identified as Heilbron-Petrus Steyn TA (HP-TA), Hertzogville-Dealesville-Soutpan TA (HDS-TA), Brandfort TA (B-TA), Petrusburg TA (P-TA) and Springfontein TA (S-TA). The locations of these five target areas are shown in Figure 1. The sizes of the identified target areas are as follows:
HP-TA: 39 836 ha
HDS-TA: 171 847 ha
B-TA: 107 629 ha
P-TA: 12 723 ha
S-TA: 10 642 ha
Nett results - the ultimate target area
Determining the final target area for conservation action
After identifying five possible target areas for conservation, it was necessary to apply a 'real-world' approach to target any one of these areas. Even though shapefiles for land use and land cover were not available, these factors were included as estimates based on the 2013-2014 National Land Cover map.19 This provided estimates for transformed land and urban land. Transformed land refers to land that is no longer covered with indigenous vegetation as a result of cultivation, afforestation, mining, infrastructure development or any other consumptive land use. Urban areas, although according to definition also constituting transformed land, were given a separate category as they are deemed to have no value for conservation, while other transformed areas can still be conserved, depending on the land use and management practices. Table 4 shows the percentage land occurring in each of these categories for each target area.
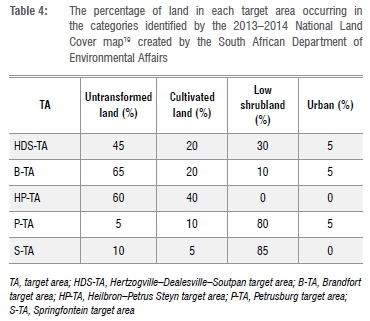
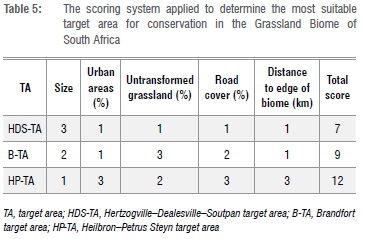
Due to the small amount of grassland still occurring in P-TA and S-TA and the domination of Karoo-type low shrubland, these target areas were not further considered as options for conservation for the purpose of this study. The percentage road cover for each area and the distance to the nearest edge of the Grassland Biome were incorporated for the remaining three target areas. A summary of the results of this section is given in Table 5 with each target area receiving a ranking of 1 (worst) to 3 (best) for each of the categories. Based on the results of the scoring in Table 5, the HP-TA was identified as the most suitable target area for conservation in the Grassland Biome.
The Heilbron-Petrus Steyn Target Area
Location
The HP-TA is located in the northeastern Free State between the towns of Heilbron (7 km to the north), Frankfort (39 km to the northeast), Tweeling (37 km to the east), Petrus Steyn (10 km to the south) and Edenville (25 km to the west). Its outermost co-ordinates are N: 27°21'14.81"S; 27°57'31.34"E, E: 27°26'20.27"S; 28°09'14.87"E, S: 27°33'56.67"S; 28°04'22.30"E, and W: 27°28'36.13"S; 27°54'13.04"E. The majority of the area lies within the Ngwathe Local Municipality and Fezile Dabi District Municipality, with a small section crossing into the Nketoana Local Municipality and Thabo Mofutsanyane District Municipality.
Climate
The area normally receives about 530 mm of rain per year, with most rainfall occurring during summer. It receives the lowest rainfall (0 mm) in July and the highest (94 mm) in January. The average midday maximum temperatures range from 16.2 °C in June to 27.1 °C in January. The region is the coldest during June, with average night-time temperatures of 0 °C21
Land type
The dominant land type for the area is Ea28 with a portion of Dc10 located in the west, Ca7 located in the north and Ca6 located in the south.22
Historic vegetation
According to Mucina and Rutherford18 the area contains mostly Frankfort Highveld Grassland (Vulnerable) with some Central Free State Grassland (Vulnerable) located in the western section, Eastern Free State Clay Grassland (Endangered) in the southeast and two very small portions of Northern Free State Shrubland (Least Threatened).
Discussion and recommendations
This study was not only a scientific exercise, but involved many subjective inputs. This approach constitutes a radical change in relation to previous conservation plans that lack subjective input for streamlining the possibility of implementation. Conservation planning has had very little targeted success, with large gaps between planning and implementing. The vast amount of data available are not being translated into action, rendering the data without purpose in the application of conservation. However, correct implementation of the data should have a sizeable benefit to conservation planning, necessitating the need for a modern approach. The subjective sections of this study were intended to minimise this gap between planning and implementation of conservation action, and to be as realistic as possible in terms of the feasibility of the area right from the onset of designing a conservation area. It is an effort at applying a new and modern approach and the accuracy of this approach can only be tested through concerted conservation efforts in the identified area.
It will now be of cardinal importance to design a modern approach to ownership and management of the identified area. Environmental legislation in South Africa is advancing at a rapid rate and informal protected areas and biodiversity offsets are becoming buzzwords in the conservation sector. For the identified area to be a conservation success, it will be critical that income streams are diverse and, rather than focusing on tourism alone, they should be based on the land use of the area, as well as unique opportunities that can be offered by the specific area. A major benefit of the HP-TA is that it provides habitat for native endemic species such as black wildebeest (Connochaetes gnou) and pure-bred blesbok (Damaliscus pygargus phillipsi). The area is also well known for its gamebird hunting, which provides an additional income stream that can be utilised.
In addition, conservation in the 21st century has the potential to be incredibly interesting and to redefine the norms of science and historical approaches to conservation. With the availability of funding and ideas through social media and crowd-funded potential, modern ideas for redesigning objectives are limitless. There are well-funded, scientific projects underway for re-establishment of extinct species through genetic engineering and selective breeding. One such project is focusing on reintroducing woolly mammoths (Mammuthus primigenius), or at least a mammoth-like hybrid, to the tundra and, through the habitat changes which would be facilitated in the process, drastically contribute to mitigation of climate change.23 In South Africa, we have the Quagga Project which has already produced at least six individuals that very closely resemble this extinct species in the Western Cape.24 The original quagga (Equus quagga quagga) was a plains species and would theoretically be very suitable for reintroduction in an area such as HP-TA. This sounds completely far-fetched, but in the modern era of connectivity and social media platforms, new and radical ideas are more available than ever before and their impact should be utilised for conservation just as it is utilised in any other industry.
One of the major areas to focus on, and perhaps more immediately achievable than bringing back the quagga from extinction, is the implication of biodiversity offsets. This concept is relatively new and unexplored in South Africa and it is a much-underutilised avenue. If biodiversity offsetting is applied intelligently, it could result in the desirable areas of the Grassland Biome directly benefitting from the destruction of areas where practical implementation of biodiversity conservation would not be feasible. The Grassland Biome is rapidly disappearing due to the pressures of mining, urbanisation and agriculture. If the actions responsible for the destruction of grassland could be utilised, through biodiversity offsetting, to benefit the ultimate conservation of grassland, this approach could be developed and used as a major source of securing land for conservation as part of the HP-TA.
Acknowledgements
We thank SANBI and all the data processors responsible for maintaining accurate and up-to-date information on BGIS - an incredibly helpful and valuable scientific tool. We also thank the provincial governmental departments that were involved in gathering the biodiversity data, including the provincial and/or municipal governments of Limpopo, KwaZulu-Natal, Gauteng, Eastern Cape, North-West, Mpumalanga, Free State, the Western Cape and the following district and local municipalities in the Western Cape: Namaqua District, Drakenstein, Stellenbosch, Knysna, Bitou, Central Karoo District, George, Breede Valley, Bergrivier, Cederberg, Kannaland and Oudtshoorn.
Competing interests
We declare that there are no competing interests.
Authors' contributions
H.P: Study design, research, writing of manuscript. B.R.: Study design and editing of manuscript. W.M.: Editing of manuscript.
References
1. O'Connor TG. Local extinction in perennial grasslands: A life-history approach. Am Nat. 1991;137(6):753-773. https://doi.org/10.1086/285192 [ Links ]
2. Henning GA, Terblanche RF, Ball JB. South African Red Data Book: Butterflies. Pretoria: SANBI; 2009. [ Links ]
3. Rutherford MC, Westfall RH. Biomes of Southern Africa: An objective categorization. 2nd ed. Memoirs of the Botanical Survey of South Africa. 1994;63:1-94. [ Links ]
4. Rouget M, Reyers B, Jonas Z, Desmet P Driver A, Maze K, et al. National Spatial Biodiversity Assessment 2004: Technical report. Volume 1: Terrestrial component. Pretoria: SANBI; 2004. [ Links ]
5. DEAT, SANBI. South Africa's fourth national report to the Convention on Biological Diversity. Pretoria: DEAT/SANBI; 2009. [ Links ]
6. DEAT, SANBI. National protected areas expansion strategy for South Africa. Draft for Mintech. Pretoria: DEAT/SANBI; 2008. [ Links ]
7. DEA. South Africa's fifth national report to the Convention on Biological Diversity. Pretoria: DEA; 2014. [ Links ]
8. Noss RF, LaRoe ET III, Scott JM. Endangered ecosystems of the United States: A preliminary assessment of loss and degradation. In: Biological report 28. Washington DC: National Biological Service; 1995. https://doi.org/10.2307/4089098 [ Links ]
9. Carroll CR, Meffe GK. Management to meet conservation goals: General principles. In: Carroll CR, Meffe GK. Principles of conservation biology. 2nd ed. Sunderland, MA: Sinauer Associates; 1997. p. 347-383. https://doi.org/10.1086/509465 [ Links ]
10. Main MB, Roka FM, Noss RF. Evaluating costs of conservation. Conserv Biol. 1999;13(6):1262-1272. https://doi.org/10.1046/j.1523-1739.1999.98006.x [ Links ]
11. Gibbons P Lindenmayer DB. Offsets for land clearing: No net loss or the tail wagging the dog? Ecol Manag Restor. 2007;8(1):26-31. https://doi.org/10.1111/j.1442-8903.2007.00328.x [ Links ]
12. Maron M, Hobbs RJ, Moilanen A, Matthews JW, Christie K, Gardner TA, et al. Faustian bargains? Restoration realities in the context of biodiversity offset policies. Biol Conserv. 2012;155:141-148. https://doi.org/10.1016/j.biocon.2012.06.003 [ Links ]
13. Secretariat of the Convention on Biological Diversity. Global biodiversity outlook 4. Montreal: UNEP; 2014. [ Links ]
14. WWF. Living planet report 2014: Species and spaces, people and places. Gland: WWF; 2014. [ Links ]
15. Rodrigues AS, Andelman SJ, Bakarr MI, Boitani L, Brooks TM, Cowling RM, et al. Effectiveness of the global protected area network in representing species diversity. Nature. 2004;428(6983):640-643. https://doi.org/10.1038/nature02422 [ Links ]
16. Margules CR, Pressey RL, Williams PH. Representing biodiversity: Data and procedures for identifying priority areas for conservation. J Biosciences. 2002;27(4):309-326. https://doi.org/10.1007/BF02704962 [ Links ]
17. Bourgeron PS, Humphries HC, Reynolds KM. Conducting large-scale conservation evaluation and conservation area selection using a knowledge-based system. Paper presented at: The 4th International Conference on Integrating GIS and Environmental Modelling (GIS/EM4); 2000 September 02-08; Alberta, Canada. [ Links ]
18. Mucina L, Rutherford MC. The vegetation of South Africa, Lesotho and Swaziland. In: Strelitzia19. Pretoria: SANBI; 2006. [ Links ]
19. DEA. 2013-14 National land-cover - 72 classes. Pretoria: DEA; 2015. [ Links ]
20. The South African National Roads Agency Ltd. (SANRAL). Design guidelines for single carriageway national roads. Pretoria: SANRAL; 2009. [ Links ]
21. Cedar Lake Ventures, Inc. Average weather in Heilbron [webpage on the Internet]. No date [cited 2013 May 06]. Available from: https://weatherspark.com/y/94192/Average-Weather-in-Heilbron-South-Africa-Year-Round [ Links ]
22. Land Type Survey Staff. Land types of South Africa: Digital map (1:250 000 scale) and soil inventory datasets. Pretoria: ARC-Institute for Soil, Climate and Water; 1972-2006. [ Links ]
23. Revive and Restore. The woolly mammoth revival [webpage on the Internet]. No date [cited 2016 Aug 23]. Available from: https://reviverestore.org/projects/woolly-mammoth/ [ Links ]
24. The Quagga Project. The quagga revival South Africa [homepage on the Internet]. c2008 [cited 2016 Aug 23]. Available from: https://quaggaproject.org/ [ Links ]
 Correspondence:
Hélen Prinsloo
Email: helen@bucandi.co.za
Received: 21 Oct. 2019
Revised: 22 June 2020
Accepted: 17 Aug. 2020
Published: 29 Mar. 2021
Editors: Teresa Coutinho, Salmina Mokgehle
Funding: None

