


Servicios Personalizados
Articulo
 Inglés (pdf)
 Articulo en XML
 Referencias del artículo
Indicadores

Links relacionados
-
 Citado por Google
 -
 Similares en Google
Compartir

 Permalink
South African Journal of Science
versión On-line ISSN 1996-7489
versión impresa ISSN 0038-2353
S. Afr. j. sci. vol.117 no.3-4 Pretoria mar./abr. 2021
http://dx.doi.org/10.17159/sajs.2021/8414
RESEARCH ARTICLE
Low nitrogen and phosphorus effects on wheat Fe, Zn, phytic acid and phenotypic traits
Brigitta TóthI; Makoena J. MoloiII; Lóránt SzökeI; Maryke LabuschagneII
IInstitute of Food Science, University of Debrecen, Debrecen, Hungary
IIDepartment of Plant Sciences, University of the Free State, Bloemfontein, South Africa
ABSTRACT
In sub-Saharan Africa, crops are often grown under low nitrogen (N) and low phosphorus (P) conditions, which may impact on the nutritional components of the grains. The aim of this study was to investigate the effect of low N and low P and a combination of the two on iron (Fe), zinc (Zn) and phytic acid content in two commercial South African spring wheat cultivars (PAN3497 and SST806). Phenotypic traits were also investigated. Although cultivar effects were not significant, treatment effects were highly significant for the phenotypic and nutritional traits. Low P stress increased Fe and Zn levels, whereas low N stress had the opposite effect. In addition, low P stress inhibited phytic acid accumulation the most, suggesting that under this treatment, Fe and Zn were more available because of less interaction with phytic acid. Compared to the low N treatment, the low P treatment led to lower reductions in the number of tillers, plant height, stem thickness, number of seeds, weight of seeds and dry weight for both cultivars. While low P had positive effects on the nutritional value of wheat, the combination of low N and P treatment had a negative impact on most of the measured characteristics. Low N conditions had more negative effects on all measured characteristics than low P conditions and was very detrimental to wheat nutritional value and yield.
SIGNIFICANCE:
• Results from this study emphasise the impact of fertilisation and the impact of insufficient nitrogen and phosphorus fertiliser on wheat productivity.
• Low nitrogen and phosphorus fertilisation impact grain microelement content and bioavailability which impact nutritional value.
Keywords: nutrient deficiency, phenotypic traits, plant height, dry weight, microelements
Introduction
Nitrogen deficiency is one of the major crop production constraints in the world.1 Plants require nitrogen (N) in large quantities to attain normal growth and development because N concentration is strongly related to photosynthetic rate and other photosynthetic parameters such as the electron transport rate and carboxylation capacity.2 The estimated world supply of nitrogen as ammonia will be 170 761 thousand tons by 2020, of which only 5.5% will be used in Africa.3 Statistics indicate that the sub-Saharan region utilises very low levels of N for grain crop production, at an average of 11 kg/ha/year despite the 90 to 120 kg/ha/year recommended rates.4
Phosphorus (P) is the most widely used fertiliser after N.5 Its deficiency affects about 40% of the cultivated land of the world and causes loss of productivity and quality.6 As most of the P is stored in the grain, harvesting grain crops leads to continuous removal of the P from the soil. Consequently, P fertiliser application is required to address soil P deficiencies. Both N and P are essential macronutrients required for vegetative and reproductive plant growth.7-9 Small-scale farmers in sub-Saharan Africa often do not have access to fertiliser, due mainly to the cost, leading to poor N and P status of soils.10 Artificial fertilisers mainly contain N, P and potassium (K) while microelements are present in natural organic fertilisers such as compost.11 Some industrial by-products and waste materials can be used as micro-fertilisers in case of iron (Fe) deficiency.12
Sub-optimal concentrations of Fe and zinc (Zn) in crops as well as in wheat grain cause micronutrient deficiencies in humans. Deficiency of Fe is a problem in most developing countries as a result of, amongst other things, inadequate intake, reduced absorption, and deficiency in the soil.13 Fe is a key component for infection resistance in humans.13 The World Health Organization (WHO) reported that 30% of the world population, specifically women and children, suffers from anaemia as a result of Fe deficiency.14 Furthermore, the WHO issued a statement that Zn deficiency ranks 11th among the 20 most important risk factors contributing to the burden of disease in the world.15 Zn deficiency is 5th among the 10 most important factors in developing countries, while Fe deficiency ranks 6th.16 Approximately 70-80% of the total P contained in cereal grains is in the form of phytate.17 The bioavailability of micronutrients for human uptake is limited by phytic acid concentration because it can make complexes with cations such as Zn2+, forming insoluble phytates (such as zinc phytate), which influence the bioavailability of Zn in grains.18 It has been reported that phytate content affects Fe bioavailability more than the total Fe content19, although this finding was contradicted by another study20.
Although studies on the effect of low N and P content in the soil have been conducted extensively, the main focus of these studies was on crop yields. Information on how these macronutrients affect micronutrients in wheat is not evident. Therefore, the aim of this study was to investigate the effect of low N and low P as well as a combination of the two on Fe, Zn and phytic acid content in two commercial South African spring wheat cultivars with excellent baking quality. The results of this study will shed light on the quality of these cultivars under low N, P and a combination of the two. The effects of these treatments on the phenotypic characteristics of the two wheat cultivars further elucidated how the cultivars responded under these conditions.
Materials and methods
Greenhouse trials
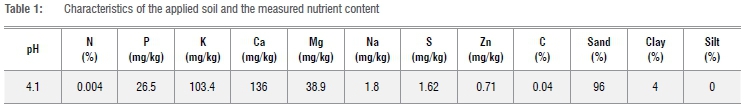
Two commercial, South African spring wheat cultivars with excellent baking quality, PAN3497 and SST806 (the commercial standard cultivar for spring wheat baking quality in South Africa), were sown in 2-L pots filled with 2 kg soil in a greenhouse. A randomised complete block design was used with two factors: treatment and cultivar. Soil from a depth of 1.5 m was obtained from Bainsvlei, Bloemfontein, South Africa (29.05° S, 26.11667° E). The soil had very low nutrient content as indicated in Table 1.
Four treatments were applied to the two cultivars, with three replications: 15 pots per replication in 2016 and 20 pots per replication in 2017. Each pot contained three plants. The trials were carried out from June to the end of October 2016 (winter time) and during the same time in 2017. Greenhouse temperatures were set to 18 °C at night (21:00-06:00) and 22 °C during the day. Low N and low P stress and a combination of the two were induced according to the protocol given in Table 2. These treatments were tested against an optimal control. The treatments were initiated at three-leaf stage. Before this, plants were irrigated with deionised water. Once a week, pots were flushed with deionised water to prevent salt build-up. Treatments were applied twice a week (250 mL nutrient solution per pot). The electrical conductivity was maintained at 1.5 mS/cm2 to tillering stage and at 1.80 mS/cm2 after tillering.
All treatments received the same micronutrient fertilisation as follows: 3.45 mg/L C10H13FeN2O8, 0.30 mg/L MnSO4, 0.13 mg/L ZnSO4, 0.62 mg/L H3BO3, 0.05 mg/L CuSO4, 0.02 mg/L Na2MoO4. After ripening, the seeds were harvested and milled into whole flour using a laboratory mill (IKA A10 Yellowline analysis grinder, Merck Chemicals Pty Ltd. Mountainview, CA, USA). These whole flour wheat samples were used for the determination of Fe, Zn and phytic acid.
Total iron and zinc analysis
Total Fe and Zn were extracted according to the dry-ashing method.21 Wheat flour (1 g) was placed in glazed, high-form porcelain crucibles and ashed in a furnace at 550 °C for 3 h. A few drops of HNO3 (55 %, v/v) were added to the samples for digestion. The samples were then placed on a hot sand-bath to completely dry, after which they were returned to the oven for 1 h at 550 °C for further ashing. After cooling, 10 mL of 1:2 HNO3 was added to the samples for further digestion. The samples were returned to the hot sand-bath until they became warm (100 °C). The samples were then transferred to 100-mL volumetric flasks and filled to the mark with distilled water. Mineral concentrations were measured in triplicate using an atomic absorption spectrophotometer (Agilent Technologies 300 Series AA).
Phytic acid determination
Phytic acid concentration was determined using a rapid colourimetric procedure based on the reaction between ferric acid and sulfosalicylic acid according to the method described by Dragicevic et al.22 with modifications. Ground flour samples (0.25 g) were placed in glass tubes containing 10 mL of trichloroacetic acid (TCA) (5 %, v/v) and placed on a mechanical shaker for 1 h, vortexed at 10-min intervals. The extract (5 mL) was transferred into 15-mL tubes and centrifuged at 12 000 g for 20 min. The supernatant (0.5 mL) was transferred into a clean glass tube and 1.5 mL WADE reagent (0.3%, w/v, FeCl3 + 6H2O; 3%, v/v, 5"-sulfosalicylic acid) was added. The samples were then centrifuged at 12 000 g for 10 min. Absorbance was read at 500 nm with a Helios gamma spectrophotometer (Erlangen, Germany). When phytate is present, the Fe ion present in the WADE reagent binds to the phosphate ester instead of reacting with sulfosalicylic acid, resulting in a decrease in pink colour intensity. The phytic acid concentration was calculated from the phytic acid standard.23
The phytic acid standard solution was made from phytic acid sodium salt hydrate from rice (Sigma-Aldrich, P-8810, molecular weight: 660.04 g/ mol). A series of standard phytic acid solutions was made from the stock standard solution by appropriate dilutions, with the addition of extraction solutions to simulate conditions similar to the ones in the samples. The concentrations of phytic acid in this series were as follows: 10, 50, 100, 150, 200, 250, 300, 350 and 400 μmol/100 mL.
Phytic acid:iron and phytic acid:zinc molar ratios
The contents of phytic acid, Fe and Zn were converted into moles by division through their molar mass or atomic weight (phytic acid: 660.04 g/mol, Fe: 55.85 g/mol, Zn: 65.4 g/mol). The molar ratios of phytic acid:Fe and phytic acid:Zn were calculated.
Phenotypic traits
The measured traits were recorded for each plant in a pot at maturity, and values were averaged. These traits included number of tillers per plant, plant height, length of the main ear, stem thickness (main tiller, measured by a ruler), seeds per plant, seeds per main ear, seed weight of main ear, aboveground dry weight and dry leaf area per plant (main stem).
Statistical analysis
Analyses of variance (ANOVA) were performed on the data for both genotypes, four treatments and two years as a three-factor analysis.24 ANOVA was also done for the two cultivars separately as well as for the two years combined, in order to determine the effects of treatments on the measured parameters within each cultivar. Differences were tested at a p<0.05 level of significance. The Tukey test and least significant difference test were used for means separation.
Results
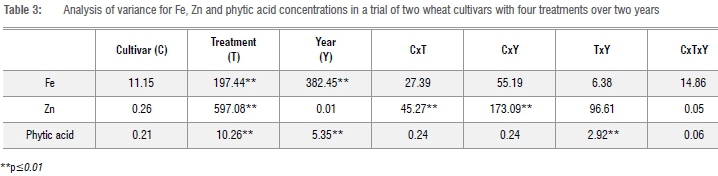
The ANOVA showed that cultivar effect was not significant for nutritional traits (Fe, Zn and phytic acid) (Table 3). The effect of treatment and year was highly significant for Fe, Zn and phytic acid contents. There was a highly significant interaction between cultivar and treatment, and cultivar and year for Zn, and between treatment and year for phytic acid.
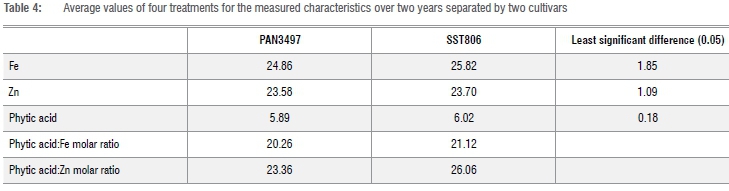
Although SST806 recorded higher values for all nutritional traits than did PAN3497, the two cultivars were not significantly different (Table 4).
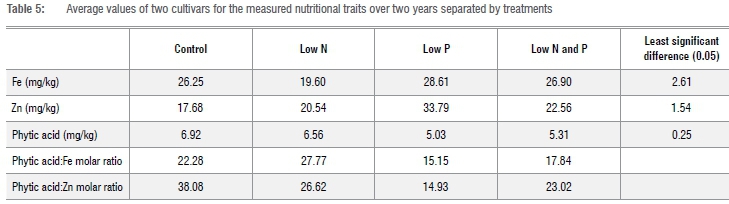
Under low N conditions, Fe concentration was significantly reduced, but under low P, as well as low N and P treatments combined, Fe content was not significantly higher than under control conditions (Table 5). Zn content increased significantly with low P inducing the highest (33.79 mg/kg) and low N inducing the lowest (20.54 mg/kg) increase. Phytic acid concentrations under both treatments were not significantly different from that of the control. The low P and combination of low N and P treatments produced significantly lower phytic acid content compared to the control, and low N with low P produced the highest reduction (5.03 and 5.31 mg/kg). The molar ratio of phytic acid:Fe was increased under low N conditions, but was significantly decreased under low P (7.13) and a combination of low N and P (4.43). The phytic acid:Zn molar ratio was decreased under low N, low P and a combination of the two but the effect was by far the highest under low P conditions with a 23.15 reduction, followed by that under a combination of low N and P (15.06).
For the two cultivars separately (Figures 1 and 2), PAN3497 Fe content was reduced in all treatments compared to the control. Low N treatment caused the most substantial reduction (21.13 mg/kg) compared to the low P and low N with P combination treatments. Similarly, for SST806, Fe content was reduced (18.08 mg/kg) under low N conditions. However, under low P and a combination of low N and low P stress, there were slight increases in Fe content compared to the control. The Zn content for PAN3497 increased in all treatments compared to the control, with the low P treatment inducing the most significant increase (35.37 mg kg).
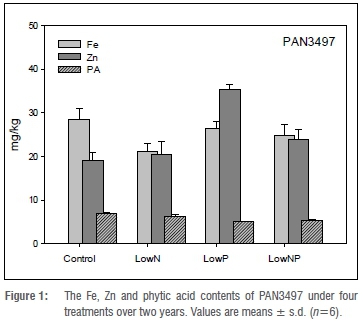
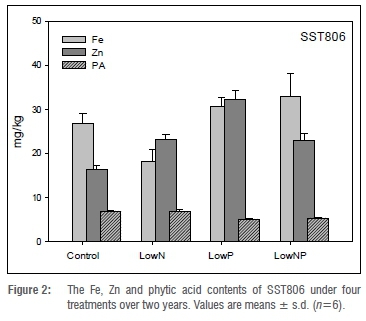
Although a similar pattern was observed for SST806, the low N treatment induced slightly higher Zn than that of PAN3497. Contrary to Fe and Zn, phytic acid content was similar for the two cultivars under the different treatments. In both cultivars, low P and a combination of low N and P caused a significant decrease in phytic acid.
The results of the ANOVA showed that cultivar effect (as seen from significance of F ratios of mean squares) was significant (p<0.05) for main ear, seeds number per main ear, seeds per plant, above ground dry weight and dry leaf area (Table 6). Furthermore, there was a large treatment contribution to variation in the case of plant height, main ear length, main stem thickness, seeds per main ear, seeds per plants and dry leaf area. Year contributed significantly to variation in seeds per main ear and number of tillers. Dry leaf area showed large cultivar x treatment and cultivar x treatment x year interactions.
To better understand the effect of treatment on morphological parameters without genotype playing a role, values were averaged for two cultivars (Tables 7 and 8). Cultivars did not differ significantly for measured phenotypic characteristics, but differences between treatments were significant. For both cultivars, the controls produced the highest values for all phenotypic characteristics and characteristics varied substantially between different treatments. Plants under the low P treatment had significantly higher numbers of tillers than those under low N and low N and P combined treatments for both cultivars. For both cultivars, plant height was reduced by all the treatments, where low N treatment led to the highest reduction in length. The main ear length, stem thickness and seeds per main ear were reduced the most under low N treatment, with low P having the least effect. Total seeds per plant were the least affected by the low P treatment for both cultivars although the weight was not significantly different from that under the low N and P combination for SST806. For the aboveground dry weight, both cultivars showed the largest reduction under the low N treatment. The low N treatment led to the lowest reduction in dry leaf area, but a combination of low N and P stress caused the highest reduction in this parameter for both cultivars, which was unexpected.
Discussion
Wide variation in Fe and Zn concentrations has been recorded in wheat grain.25-27 The average Fe concentration was reported to be between 30 mg/kg and 73 mg/kg 28, in contrast to this study where it was low - ranging between 19.6 mg/kg and 28.61 mg/kg. The range of Zn concentration was reported to be between 20.4 mg/kg and 30.5 mg/kg in wheat grains.29 In this study, Zn concentration varied between 17.68 mg/ kg and 33.79 mg/kg across the different treatments. This variation in the Fe and Zn contents could be affected by the treatments and the different cultivars used because their concentrations are determined by genetic and environmental factors.30
In this study, the effect of cultivar on the measured characteristics was negligible, although SST806 had slightly higher values for all the traits. The effects of the treatments were highly significant for all measured nutritional characteristics. Zn content showed a significant cultivar with treatment interaction, indicating that the two cultivars did not react the same to treatments in terms of Zn content.
There was also a cultivar by year interaction, showing that the trend for Zn content for the two years differed for the two cultivars. There was a treatment by year interaction for phytic acid, showing that the ranking for phytic acid for the different treatments differed for the two years. Only the low N treatment reduced Fe content significantly, and low P stress increased the concentrations of Fe and Zn. With P deficiency or limitation, roots secrete high amounts of organic acids, resulting in the mobilisation of and more intensive uptake of microelements by plants. The hyphae of arbuscular mycorrhizal fungi help to absorb more nutrients from the soil under P-deficient soil conditions.31 Fe and Zn were found to be negatively correlated in some studies.32
Phytic acid, on the other hand, was less reduced under low N stress than under low P stress (Table 5), indicating that availability should increase under low P stress conditions. The highly reduced phytic acid concentration under low P stress was probably due to the fact that most phosphorus in the plant is in the form of phytate19,33, meaning that reduced availability of P would lead to reduced phytic acid. It has been reported that high N treatment reduced phytic acid and increased Fe content in rice.34 Similarly in pearl millet, cultivars with low phytic acid had high Fe and Zn bioacess.32 This finding is in contrast with that of our study, however, where the low P treatment reduced phytic acid and enhanced Fe content, although it was cultivar dependent. Significant correlations between N fertilisation and Fe and Zn concentration in wheat grains has been previously reported.35 Phytic acid was reduced by increasing N concentration, with the effect of varieties being significant in barley. In contrast to the current study, under low P conditions, one cultivar of barley had the highest phytic acid content.36 Although phytic acid is the main reservoir of P in plants, it possesses anti-nutritional characteristics17 which are associated with decreased bioavailability of Fe and Zn18,19. Therefore, the current results indicate that in areas experiencing low P stress, Fe and Zn will be more available, which can combat malnutrition and improve human health. This statement is further supported by the lowest phytic acid:Fe and phytic acid:Zn molar ratios under low P stress (Table 5), emphasising higher bioaccessibility of Fe and Zn under low P stress. In agreement, more Zn was available under such low P supply.32 It has been reported that 55% of Zn was absorbed when the phytic acid:Zn ratio was less than 5, while 35% of Zn was absorbed when the ratio was between 5 and 15, and only 15% was absorbed when the ratio was higher than 15.16 Low N stress benefitted cultivars selectively because it led to an increase in Zn content for SST806 only (Figure 2), showing that cultivars responded differently under this treatment compared with under low P stress, which increased Zn content for both cultivars. For all nutritional traits, under combined low N and P stress, it appears that low N effect dominated effects of low P.
PAN3497 and SST806 were not significantly different for the measured phenotypic traits, irrespective of the treatment, which is in agreement with the nutritional quality data. Reduced tillering caused by these treatments, especially under low N stress, shows that the earlier a tiller is formed, the more kernels it will produce.37 Reduction of other parameters, such as plant height and dry mass, under N and P deficiencies substantiates the fact that they correlate with grain yield positively.38 As expected, low N, P and a combination of low N with P reduced the phenotypic performance of both cultivars substantially because both macroelements are essential for vegetative and reproductive growth.7 Similar to nutritional quality results, the effect of low N masked that of low P and low N and low P combined stress, even though low P alone caused the lowest reductions in phenotypic parameters, pointing out the importance of N in these cultivars.
To conclude, our study has revealed that the cultivars were not significantly different for most nutritional and phenotypic traits under various treatments. What is interesting is that, under low P stress, micronutrients (Fe, Zn) increased to levels higher than those of the control while phytic acid was substantially reduced, leading to higher bioavailability of Fe and Zn in these cultivars. Although growing wheat under low P will reduce phenotypic traits and yield, there may be an unexpected benefit for combatting Zn and Fe deficiencies in the areas where the soil is deficient in these macronutrients.
Acknowledgements
This research was funded by the National Research Foundation of South Africa, through the South African Research Chairs Initiative.
Competing interests
We declare that there are no competing interests.
Authors' contributions
B.T. and M.J.M. performed the experiments and collected data. M.L. supervised the experiment. M.L. and L.S. completed the data statistical analysis. B.T., M.J.M. and M.L. wrote the manuscript. All authors read and approved the final manuscript.
References
1. Glass ADM. Nitrogen use efficiency of crop plants, physiological constraints upon nitrogen absorption. Crit Rev Plant Sci. 2003;22:453-170. https://doi.org/10.1080/07352680390243512 [ Links ]
2. Hikosaka K. Interspecific difference in the photosynthesis-nitrogen relationship: Patterns, physiological causes, and ecological importance. J Plant Res. 2004;117:481-494. https://link.springer.com/article/10.1007/s10265-004-0174-2 [ Links ]
3. UN Food and Agriculture Organization (FAO). World fertilizer trends and outlook to 2020. Summary report. Rome: FAO; 2017. Available from: http://www.fao.org/3/a-i6895e.pdf [ Links ]
4. Chianu J, Mairura JJ. Mineral fertilizers in the farming systems of sub-Saharan Africa. A review. Agron Sustain Dev. 2012;32(2):545-566. https://doi.org/10.1007/s13593-011-0050-0f [ Links ]
5. UN Food and Agriculture Organization (FAO). World fertilizer trends and outlook to 2019. Rome: FAO; 2016. [ Links ]
6. Kochian LV Hoekenga OA, Pineros MA. How do crops tolerate acid soils? Mechanisms of aluminium tolerance and phosphorus efficiency. Annu Rev Plant Biol. 2004;55:459-493. https://doi.org/10.1146/annurev.arplant.55.031903.141655 [ Links ]
7. Hajabbasi MA, Schumacher TE. Phosphorus effects on root growth and development in two maize genotype. Plant Soil. 1994;158:39-46. [ Links ]
8. Kim HJ, Li X. Effects of phosphorus on shoot and root growth, partitioning, and phosphorus utilization efficiency in Lantana. HortScience. 2016;51(8):1001-1009. [ Links ]
9. Leghari SJ, Wahocho NA, Laghari GM, Laghari AH, Bhabhan GM, Talpur KH, et al. Role of nitrogen for plant growth and development: A review. Adv Environ Biol. 2016;10(9):209-219. [ Links ]
10. Heisy PW, Mwangi WM. Fertiliser use and maize production in sub Saharan Africa. CIMMYT Economics Working Paper. Mexico D.F.: CIMMYT; 1996. [ Links ]
11. Jakubus M, Graczyk M. Microelement variability in plants as an effect of sewage sludge compost application assessed by different statistical methods. Agronomy. 2020;10:642. [ Links ]
12. Tóth B, Moloi MJ. The use of industrial waste materials for alleviation of iron deficiency in sunflower and maize. Int J Recycl Org Waste Agric. 2019;8:145-151. [ Links ]
13. Nag A, Ray O, Rakshit R. Reflection on iron: Strategy for nutritional security in human. Natl Acad Sci Lett. 2019;1-4. [ Links ]
14. World Health Organization (WHO). World health reports. Geneva: WHO; 2014. [ Links ]
15. World Health Organization (WHO). Ten leading causes of illness and disease in low-income countries. The world health report 2002. Geneva: WHO; 2002. Available from: http://www.who.int/mediacentre/factsheets/fs310_2008.pdf [ Links ]
16. Magallanes-López AM, Hernandez-Espinosa N, Velu G, Posadas-Romano G, Ordonez-Villegas VMG, Crossa J, et al. Variability in iron, zinc, phytic acid content in a worldwide collection of commercial durum wheat cultivars and the effect of reduced irrigation on these traits. Food Chem. 2017;237:499-505. https://doi.org/10.1016/j.foodchem.2017.05.110 [ Links ]
17. Vanishth A, Rams A, Beniwal V. Cereal phytases and their importance in improvement of micronutrient bioavailability. Biotech. 2017;7:42. https://doi.org/10.1007/s13205-017-0698-5 [ Links ]
18. Zhao HJ, Liu LQ, Ren XL, Wu DX, Shu QY Gene identification and allele-specific marker development for two allelic low phytic acid mutations in rice (Oryza sativa L.) Molecular Breeding. 2008;22:603-612. [ Links ]
19. Eagling T, Wawer AA, Shewry PR, Zhao F, Fairweather-Tait SJ. Iron bioavailability in two commercial cultivars of wheat: Comparison between wholegrain and white four and the effects of nicotianamine and 2'-deoxy mugineic acid on iron uptake into Caco-2 cells. J Agric Food Chem. 2014;62:10320-10325. https://doi.org/10.1021/jf5026295 [ Links ]
20. Wang Z, Liu Q, Pan F, Yuan L, Yin X. Effects of increasing rates of zinc fertilization on phytic acid and phytic acid/zinc ratio in zinc bio-fortified wheat. Field Crops Res. 2015;184:58-64. https://doi.org/10.1016/j.fcr.2015.09.007 [ Links ]
21. AOAC International. Official method 999.11. Determination of lead, cadmium, copper, iron and zinc in foods. J AOAC Int. 2000;73:1204. [ Links ]
22. Dragicevic VD, Peric VA, Nisavic AR, Srebric MB. Validation study of a rapid colorimetric method for the determination of phytic acid and inorganic phosphorus from seeds. APTEFF. 2011;42:11-21. [ Links ]
23. Latta M, Eskin M. A simple and rapid colorimetric method for phytate determination. J Agric Food Chem. 1980;28:1313-1315. [ Links ]
24. Agrobase. Agrobase Generation II. Winnipeg: Agronomix; 2014. [ Links ]
25. Cakmak I, Ozkan H, Braun HJ, Welch RM, Römheld V. Zinc and iron concentrations in seeds of wild, primitive, and modern wheats. Food Nutr Bull. 2000;21:401-403. https://doi.org/10.1177/156482650002100411 [ Links ]
26. Lestienne I, Icard-Verniére C, Mouquet C, Picq C, Tréche S. Effects of soaking whole cereal and legume seeds on iron, zinc and phytate content. Food Chem. 2005;89:421-125. https://doi.org/10.1016/j.foodchem.2004.03.040 [ Links ]
27. Hamnér K, With M, Eriksson J, Kirchmann H. Influence of nitrogen supply on macro- and micronutrient accumulation during growth of winter wheat. Field Crops Res. 2017;213:118-119. https://doi.org/10.1016/j.fcr.2017.08.002 [ Links ]
28. Cakmak I, Torun A, Millet E, Feldman M, Fahima T, Korol A, et al. Triticum dicoccoides: An important genetic resource for increasing zinc and iron concentration in modern cultivated wheat. Soil Sci Plant Nutr. 2004;50:1047-1054. https://doi.org/10.1080/00380768.2004.10408573 [ Links ]
29. Chen XP Zhang YQ, Tong YP Xuel YF, Liu DY Zhang W, et al. Harvesting more grain zinc of wheat for human health. Sci Rep. 2017;1:1-8. https://doi.org/10.1038/s41598-017-07484-2 [ Links ]
30. White PJ, Broadley MR. Biofortifying crops with essential mineral elements. Trends Plant Sci. 2006;10:586-593. https://doi.org/10.1016/j.tplants.2005.10.001 [ Links ]
31. Xie X, Hu W, Fan X, Chen H, Tang M. Interactions between phosphorus, zinc, and iron homeostasis in nonmycorrhizal and mycorrhizal plants. Front Plant Sci. 2019;10:1172. [ Links ]
32. Krishnan R, Meera MS. Assessment of inhibitory factors on bioaccessibility of iron and zinc in pearl millet (Pennisetum glaucum (L.) R. Br.) cultivars. J Food Sci Technol. 2017;54:4378-4386. https://www.readcube.com/articles/10.1007/s13197-017-2911-2 [ Links ]
33. Su D, Sultan F, Zhao NC, Lei BT, Wang FB, Pan G, et al. Positional variation in grain mineral nutrients within a rice panicle and its relation to phytic acid concentration. J Zhejiang Univ Sci B. 2014;15:986-996. [ Links ]
34. Zhao N, Zhang Q, Cheng F, Zhou W. Effects of nitrogen, phosphorus and zinc supply levels on grain phytic acid content and its correlation with several mineral nutrients in rice grains. Chin J Rice Sci. 2007;21(2):185-190. [ Links ]
35. Bouis HE, Welch RM. Biofortification - A sustainable agricultural strategy for reducing micronutrient malnutrition in the Global South. Crop Sci. 2010;50:S20-S32. http://dx.doi.org/10.2135/cropsci2009.09.0531 [ Links ]
36. Mao Y Chen X, Qiu BY Wu FB, Zhang GP Effect of nitrogen and phosphorus fertilizer application rates on phytic acid content in barley grains. Journal of Zhejiang University (Agriculture and Life Sciences). 2009;35:285-291. [ Links ]
37. Tilley MS, Heigniger RW, Crozier CR. Tiller initiation and its effects on yield and yield components in winter wheat. Agron J. 2019;111:1323-1332. [ Links ]
38. Baye A, Berihun B, Bantayehu M, Derebe B. Genotypic and phenotypic correlation and path coefficient analysis for yield and yield-related traits in advanced bread wheat (Triticum aestivum L.) lines. Cogent Food Agric. 2020;6:1752603. [ Links ]
 Correspondence:
Brigitta Tóth
Email: btoth@agr.unideb.hu
Received: 01 June 2020
Revised: 15 Sep. 2020
Accepted: 17 Sep. 2020
Published: 29 Mar. 2021
Editors: Teresa Coutinho, Salmina Mokgehle
Funding: National Research Foundation (South Africa)

