


Services on Demand
Article
 English (pdf)
 Article in xml format
 Article references
Indicators

Related links
-
 Cited by Google
 -
 Similars in Google
Share

 Permalink
South African Journal of Science
On-line version ISSN 1996-7489
Print version ISSN 0038-2353
S. Afr. j. sci. vol.117 n.1-2 Pretoria Jan./Feb. 2021
http://dx.doi.org/10.17159/sajs.2021/8182
RESEARCH LETTER
Rates and patterns of habitat loss across South Africa's vegetation biomes
Andrew L. SkownoI, II; Debbie JewittIII, IV; Jasper A. SlingsbyV, VI
IKirstenbosch Research Centre, South African National Biodiversity Institute (SANBI), Cape Town, South Africa
IIPlant Conservation Unit, Department of Biological Sciences, University of Cape Town, Cape Town, South Africa
IIIBiodiversity Research and Assessment, Ezemvelo KZN Wildlife, Pietermaritzburg, South Africa
IVSchool of Animal, Plant and Environmental Sciences, University of the Witwatersrand, Johannesburg, South Africa
VFynbos Node, South African Environmental Observation Network (SAEON), Centre for Biodiversity Conservation, Cape Town, South Africa
VICentre for Statistics in Ecology, Environment and Conservation, Department of Biological Sciences, University of Cape Town, Cape Town, South Africa
ABSTRACT
The loss of natural habitat resulting from human activities is the principal driver of biodiversity loss in terrestrial ecosystems globally. Metrics of habitat loss are monitored at national and global scales using various remote sensing based land-cover change products. The metrics go on to inform reporting processes, biodiversity assessments, land-use decision-making and strategic planning in the environmental and conservation sector. We present key metrics of habitat loss across South Africa at national and biome levels for the first time. We discuss the spatial patterns and trends, and the implications and limitations of the metrics. Approximately 22% of the natural habitat of South Africa has been lost since the arrival of European settlers. The extent and the rate of habitat loss are not uniform across South Africa. The relatively mesic Grassland, Fynbos and Indian Ocean Coastal Belt biomes have lost the most habitat, while the arid Nama-Karoo, Succulent Karoo and Desert have lost the least. Rates of loss increased across all biomes in recent years (2014-2018), indicating that the historical drivers of change (i.e. expansion of croplands, human settlements, plantation forestry and mining) are intensifying overall. We should caution that the losses we report are conservative, because the land-cover change products do not capture degradation within natural ecosystems. Preventing widespread biodiversity losses and securing the benefits we derive from biodiversity requires slowing and preventing further habitat degradation and loss by using existing land-use planning and regulatory tools to their full potential.
SIGNIFICANCE:
• The loss of natural habitat resulting from human activities is the principal driver of biodiversity loss in terrestrial ecosystems in South Africa.
• Monitoring trends and patterns of habitat loss at a national scale provides a basis for informed environmental decision-making and planning, thus equipping civil society and government to address habitat loss and protect biodiversity while also meeting key development and socio-economic needs.
Keywords: land-cover change, monitoring, biodiversity, ecosystem, indicator
Introduction
The loss of natural habitat caused by human activities such as crop farming and infrastructure development is the principal driver of biodiversity loss in terrestrial ecosystems, globally and in South Africa.1,2 These changes are increasingly reliably detected through the use of satellite remote sensing platforms3, and there is a growing focus on developing tools to automatically detect change in near-real time4,5. The land-cover change products that result are now widely used as the basis for species and ecosystem risk assessments3,6, land-use decision-making and strategic planning in the environmental and conservation sector7,8. The utility of these products stretches well beyond the environmental sector and forms a key source of intelligence for planning and management across multiple sectors including infrastructure development, agricultural planning, defence, health, mining and energy.9
In this study, we used recently released, high-resolution, national land-cover data from three time points (1990, 2014 and 2018)10-12, and a baseline of 1750 before widespread anthropogenic land-cover change13,14, to estimate rates of habitat loss across the whole of South Africa's land mass. Although a comprehensive land-cover change study has been undertaken at a provincial scale for KwaZulu-Natal15, this is the first national-scale analysis for South Africa. We define habitat loss as the persistent loss of natural or near natural vegetation cover through anthropogenic activities and focus on the extent and rates of loss of natural terrestrial habitat as described in the Vegetation of South Africa, Lesotho and Swaziland13,16; including 458 distinct vegetation types, grouped into nine biomes plus azonal types. The Biodiversity Intactness Index17 and South Africa's national biodiversity assessments2 used vegetation types as the unit of assessment and clearly illustrated the wide application to biodiversity conservation efforts of land-cover change analysis.
Habitat loss is a key indicator in the Global Biodiversity Framework 2050, proposed by the Convention on Biological Diversity as the replacement of the Aichi Targets. To aid in reporting against the new Global Biodiversity Framework and the Sustainable Development Goals, we applied the recently described Ecosystem Area Index (EAI)18 to our data as an overall indicator of the state of South Africa's terrestrial ecosystems. We then disaggregated the EAI to the biome level and explored the spatial patterns of habitat loss and the rates of change in different regions of the country. The implications of the observed changes for the country's unique and globally significant biodiversity are discussed.
Methods
Land-cover data sets for 1990, 2014 and 201810-12 were modified to improve the representation of abandoned croplands and artificial water bodies and combined onto a common reference grid to allow for pixel-level comparisons (see supplementary material). The data sets were reclassified to a simplified scheme with seven land-cover classes (Supplementary table 1), including one class for natural/near natural vegetation and six anthropogenic classes: (1) croplands, including all field and horticultural crops, irrigated and dryland; (2) built-up areas, including infrastructure and human settlements; (3) plantation forestry areas; (4) mining areas; (5) artificial water bodies and (6) secondary natural areas (previously ploughed, mined or developed areas, which have recovered some semblance of natural vegetation cover since abandonment).
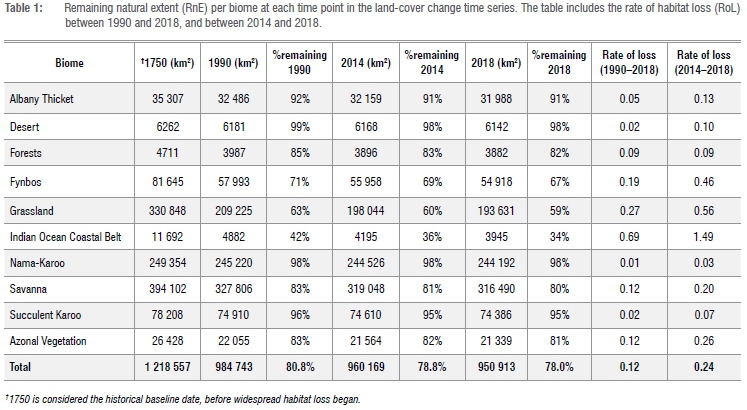
The extent and rates of loss of natural vegetation cover were calculated for each of the 458 vegetation types delineated and described in the Vegetation of South Africa, Lesotho and Swaziland.13,16The total extent of habitat loss caused by the expansion of each of the six anthropogenic land-cover classes since European settlement was evident from the 2018 data set, while recent change was calculated by cross tabulating the 1990 and 2018 data sets. The remaining natural extent (RnE) of each vegetation type in 1990, 2014 and 2018 was calculated and expressed as a proportion of the original historical extent of the type prior to major land-cover changes in South Africa (i.e. circa 1750). The rate of recent habitat loss (RoL), between 1990 and 2018, was calculated and expressed as a proportion of the 1990 extent, divided by the difference in years between the time points. We then calculated the Ecosystem Area Index18 for South Africa by calculating the geometric mean of the RnE
values for all 458 vegetation types in the country, and did the same for each biome, based on the equation  , where n is the number of vegetation (ecosystem) types (458) and a is the proportion of natural habitat remaining for each ecosystem type at each time point.
Results
Extent of loss
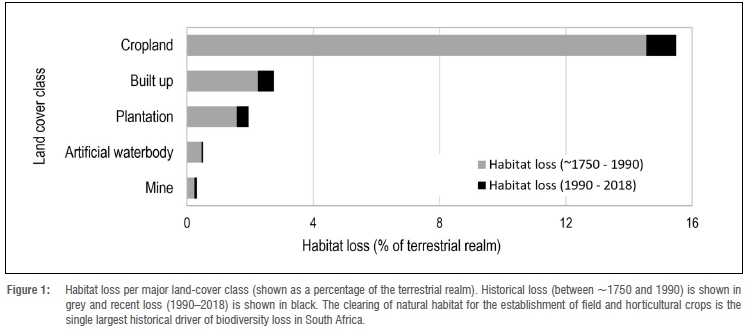
In 1990, natural vegetation covered just over 80% of South Africa (1 019 005 km2; Table 1). Between 1990 and 2018, a further 33 849 km2 was cleared for various human activities, leaving just over 78% (951 831 km2) of the original natural vegetation - a 3% decline over the 28-year period. Biome-level statistics revealed that the loss was not uniform, with the relatively mesic Indian Ocean Coastal Belt, Grassland and Fynbos biomes losing more of their original extent than others (Table 1, Supplementary tables 2 and 3). The establishment of crop fields, human settlements and plantation forestry are the dominant drivers of change in these regions (Figure 1, Supplementary tables 2 and 3).
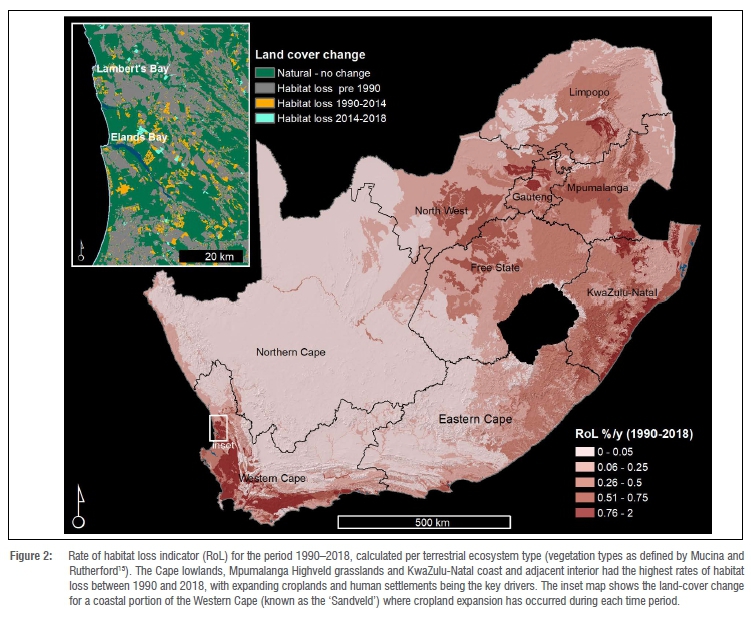
Rates of loss
Overall, South Africa lost 0.12% of its natural vegetation per year between 1990 and 2018, but this rate has been much faster in recent times -0.24% per year between 2014 and 2018 (Table 1). As for the extent of loss, there are major differences in the rates of loss between biomes and between vegetation types (Figure 2). Rates of loss are highest in the southern and eastern coastal regions, in the interior Highveld grasslands and in the savannas of Limpopo and Mpumalanga. The arid interior had the lowest rates of loss. The key drivers of change are clearing for new croplands in the grasslands and expanding rural/peri-urban human settlements in the savannas in the northern parts of the country (Table 2, Supplementary tables 2 and 3). Loss of vegetation cover in coastal regions was linked to expansion of cultivation and human settlements.
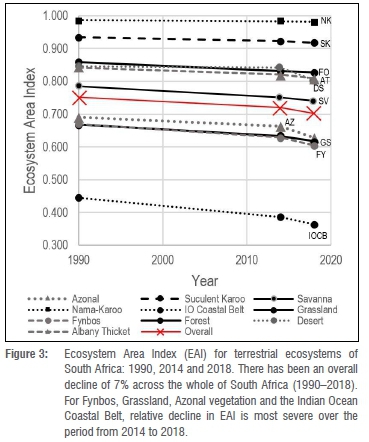
Ecosystem Area Index
The Ecosystem Areas Index (EAI) for South Africa showed a 7% decline between 1990 and 2018, from 0.752 to 0.702 (Figure 3). In the Indian Ocean Coastal Belt biome there has been an 18% decline in the EAI between 1990 and 2018, despite already having less than 50% of its original extent by 1990. The arid Nama Karoo and Succulent Karoo biomes show less decline than more mesic biomes. The EAI for the Desert biome declined by 5% due to the high rate of habitat loss (due to coastal mining) in two small ecosystem types (Namib Lichen Fields and Alexander Bay Coastal Duneveld), despite the overall extent of natural habitat in the biome remaining relatively high (Table 1 and Supplementary table 3).
Discussion
The habitat extent and rate of loss metrics indicate that recent land-cover changes are impacting the same terrestrial ecosystems which suffered historical impacts, likely because the major drivers remain largely the same (i.e. croplands, human settlements, plantation forestry and mining). The increased rate of habitat loss in recent years (2014- 2018) indicates that these drivers are intensifying. Variation in drivers between biomes has led to stark differences in habitat loss, such as between the relatively mesic Grassland, Savanna, Indian Ocean Coastal Belt and Fynbos biomes, and the arid Nama-Karoo, Succulent Karoo and Desert biomes. The Indian Ocean Coastal Belt, a narrow biome (~20 km wide) stretching from the Eastern Cape through KwaZulu-Natal into Mozambique, stands out in terms of high overall habitat loss and rate of loss. In this region in particular, it is crucial that the bioregional plans and biodiversity sector plans (which now cover the whole of South Africa's mainland) are fully considered in land-use and development planning.19-21 These plans clearly identify a network of Critical Biodiversity Areas and Ecological Support Areas in which further habitat loss needs to be prevented, in order to secure crucial ecosystem services and allow biodiversity to persist. The focus of impacts on the relatively mesic regions may change in coming years, with emerging pressures such as renewable energy facilities (solar photovoltaic and wind in particular) and intensive wildlife breeding operations threatening arid biomes.2,7 Forests remain relatively unchanged, likely due to a long history of legislated and cultural protections.22,23
Compared to direct habitat loss, the impacts of overgrazing, disrupted fire regimes and invasive species on biodiversity and ecosystem function are far more difficult to quantify.1,24 A large portion of South Africa is subject to these pressures, but these changes were not detected or included in the national land-cover data set used in our analysis, and information on the overall condition of ecosystems that incorporates these elements is still lacking.2 As such, the results presented here should be seen as a conservative estimate of the threats to South Africa's biodiversity. In particular, overgrazing is likely to alter the current estimates of >95% natural extent remaining for the arid biomes (Desert, Nama and Succulent Karoo), as much of this area is used for rangelands, while altered fire regimes and invasive species are likely to impact the more productive and flammable biomes (Fynbos, Grasslands, Savanna and some Azonal vegetation types).25 As this information is collated, the assessment of habitat loss should be expanded to include aspects of ecosystem condition/degradation using similar indices.18
The Ecosystem Area Index is a more sensitive indicator of habitat loss at the biome and national scales than the 'remaining extent' and 'rate of loss' metrics. This is illustrated in the Desert biome where, overall, the rate of loss was only 0.02% per year between 1990 and 2018, but nearly all of the habitat loss was focused in a single small vegetation type - Alexander Bay Coastal Duneveld. As each vegetation type contributes equally to the Index for the Desert Biome, this indicator reflected a 0.15% per year decline over the same period, highlighting the threat to this vegetation type.
The extent and rate of habitat loss, and EAI are simple and powerful indicators of the state of biodiversity for national and international reporting processes.2,18 However well-intentioned and ambitious the national or global targets are, the consequences of not meeting such targets are minimal. For example, our results indicate that South Africa failed to halve the rate of habitat loss between 2010 and 2020, which was the goal of Aichi Biodiversity Target 5. While the post-2020 successors to the Aichi targets are currently being debated by the Convention on Biological Diversity, it is clear that existing land-use planning and regulatory tools need to be strongly enforced and improved in order to change the trajectory of continued habitat loss. For example, the habitat loss metrics discussed above provide the basis for ecosystem risk assessment such as the IUCN Red List of Ecosystems14, which allows for the identification of threatened ecosystems. These ecosystems are then prioritised in systematic biodiversity plans that underpin bioregional planning processes.26 Threatened ecosystems are also directly referred to in South African environmental authorisation regulations8,27, although their influence on land-use decision-making processes, especially at the local government level, needs to be strengthened.
While national and provincial authorities have taken steps recently to develop online environmental screening tools (which include key biodiversity information) and publish regulations making the use of the tools mandatory for all environmental authorisation processes, the efficacy of the interventions are difficult to gauge.28 Monitoring the status of species and ecosystems with appropriate and up-to-date indicators improves biodiversity assessments and plans, and provides an avenue through which we can test the impact of policy interventions and regulations.2
Using land-cover change data to monitor ecosystems and biodiversity has its limitations, but the simplicity of the approach is also a great strength. Habitat loss related indicators are relatively easy to update (i.e. land-cover products from semi-automatic remote-sensing platforms are becoming a reality globally9), and the trends observed are relatively simple to interpret and are clearly attributable to drivers of change. The suite of conservation tools that use these metrics are impressive, although they do require consistent and strong implementation programmes. As we enter the UN Decade of ecosystem restoration (2021-2031) we need to complement the habitat loss indicators with analogous tools that allow semi-automated tracking of the more subtle elements of ecosystem degradation, including invasive species, overgrazing and altered fire regimes.5
Acknowledgements
We thank the members of the National Biodiversity Assessment - Terrestrial Reference Group and staff of the South African National Biodiversity Institute who discussed and commented on early versions of this work between 2016 and 2018. We also thank Prof. Timm Hoffman for commenting on an early draft. J.A.S. acknowledges funding from the National Research Foundation of South Africa (grant no. 118593). The funders had no role in study design, data collection and analysis, decision to publish, or preparation of the manuscript.
Competing interests
We declare that there are no competing interests.
Authors' contributions
A.L.S.: Conceptualised the study; developed the methods; curated the data; undertook the analyses; produced the figures and maps; wrote the article; and edited the article. D.J.: Conceptualised the study and edited the article. J.A.S.: Conceptualised the study; wrote the article; revised the article; and edited the article.
References
1. Barger NN, Gardner TA, Sankaran M, Belnap J, Broadhurst L, Brochier V et al. Chapter 3: Direct and indirect drivers of land degradation and restoration. In: Montanarella L, Scholes R, Brainich A, editors. The IPBES assessment report on land degradation and restoration. Bonn: Secretariat of the Intergovernmental Science-Policy Platform on Biodiversity and Ecosystem Services; 2018. p. 198-314. Available from: https://www.ipbes.net/system/tdf/ipbes_6_inf_1_rev.1_2.pdf?file=1&type=node&id=16514 [ Links ]
2. Skowno AL, Poole CJ, Raimondo DC, Sink KJ, Van Deventer H, Van Niekerk L, et al. National Biodiversity Assessment 2018: The status of South Africa's ecosystems and biodiversity - synthesis report. Pretoria: South African Naitonal Biodiversity Institute; 2019. http://opus.sanbi.org/handle/20.500.12143/6362 [ Links ]
3. Murray NJ, Keith DA, Bland LM, Ferrari R, Lyons MB, Lucas R, et al. The role of satellite remote sensing in structured ecosystem risk assessments. Sci Total Environ. 2018;619-620:249-257. https://doi.org/10.1016/j.scitotenv.2017.11.034 [ Links ]
4. Jantz SM, Pintea L, Nackoney J, Hansen MC. Landsat ETM+ and SRTM data provide near real-time monitoring of Chimpanzee (Pan troglodytes) habitats in Africa. Remote Sens. 2016;8(5), Art. #427. https://doi.org/10.3390/rs8050427 [ Links ]
5. Slingsby JA, Moncrieff GR, Wilson AM. Near-real time forecasting and change detection for an open ecosystem with complex natural dynamics. ISPRS J Photogramm Remote Sens. 2020;166(May):15-25. https://doi.org/10.1016/j.isprsjprs.2020.05.017 [ Links ]
6. Li BV Hughes AC, Jenkins CN, Ocampo-Penuela N, Pimm SL. Remotely sensed data informs Red List evaluations and conservation priorities in Southeast Asia. PLoS ONE. 2016;11(8):1-18. https://doi.org/10.1371/journal.pone.0160566 [ Links ]
7. Skowno AL, Raimondo DC, Poole CJ, Fizzotti B, Slingsby JA, editors. National Biodiversity Assessment 2018 technical report volume 1: Terrestrial realm. Pretoria: South African National Biodiversity Institute; 2019. http://opus.sanbi.org/handle/20.500.12143/6370 [ Links ]
8. Botts E, Skowno A, Driver A, Holness S, Maze K, Smith T, et al. More than just a (red) list: Over a decade of using South Africa's threatened ecosystems in policy and practice. Biol Conserv. 2020;246, Art. #108559. https://doi.org/10.1016/j.biocon.2020.108559 [ Links ]
9. Gómez C, White JC, Wulder MA. Optical remotely sensed time series data for land cover classification: A review. ISPRS J Photogramm Remote Sens. 2016;116:55-72. https://doi.org/10.1016/j.isprsjprs.2016.03.008 [ Links ]
10. GeoTerralmage. Technical report: 1990 South African national land cover dataset version 5.2. Pretoria: South African Department of Environmental Affairs; 2015. Available from: http://egis.environment.gov.za [ Links ]
11. GeoTerralmage. Technical report: 2013/2014 South African national land cover dataset version 5. Pretoria: South African Department of Environmental Affairs; 2015. Available from: http://egis.environment.gov.za [ Links ]
12. GeoTerralmage. Technical report: 2018 South African national land cover dataset version 4. Pretoria: South African Department of Environment Forestry and Fisheries; 2019. Available from: http://egis.environment.gov.za [ Links ]
13. Mucina L, Rutherford MC, editors. The vegetation of South Africa, Lesotho and Swaziland. Pretoria: South African Naitonal Biodiversity Institute; 2006. [ Links ]
14. Keith DA, Rodriguez JP Rodriguez-Clark KM, Nicholson E, Aapala K, Alonso A, et al. Scientific foundations for an IUCN Red List of ecosystems. PLoS ONE. 2013;8(5), e62111. https://doi.org/10.1371/journal.pone.0062111 [ Links ]
15. Jewitt D, Goodman PS, Erasmus BFN, O'Connor TG, Witkowski ETF. Systematic land-cover change in KwaZulu-Natal, South Africa: Implications for biodiversity. S Afr J Sci. 2015;111(9-10), Art. #2015-0019. https://doi.org/10.17159/sajs.2015/20150019 [ Links ]
16. Dayaram A, Harris LR, Grobler BA, Van der Merwe S, Rebelo AG, Powrie LW, et al. Vegetation map of South Africa, Lesotho and Swaziland 2018: A description of changes since 2006. Bothalia. 2019;49(1), Art. #2452. https://doi.org/10.4102/abc.v49i1.2452 [ Links ]
17. Scholes RJ, Biggs R. A biodiversity intactness index. Nature. 2005;434(7029):45-19. https://doi.org/10.1038/nature03289 [ Links ]
18. Rowland JA, Bland LM, Keith DA, Juffe-Bignoli D, Burgman MA, Ferrer-Paris JR, et al. Ecosystem indices to support global biodiversity conservation. Conserv Lett. 2020;13(1), e12680. https://doi.org/10.1111/conl.12680 [ Links ]
19. Berliner D, Desmet P. Eastern Cape biodiversity conservation plan technical report. Pretoria: Department of Water Affairs; 2007. Available from: http://dev.biodiversityadvisor.sanbi.org/ECBCP/ECBCP_technicalreport2007.pdf [ Links ]
20. McLean CT, Ground LE, Boon RGC, Roberts DC, Govender N, McInnes A. Durban's Systematic Conservation Assessment. Durban: eThekweni Municipality; 2016. Available from: http://www.durban.gov.za/City_Services/development_planning_management/environmental_planning_climate_protection/Publications/Documents/DurbansSystematicConservation.pdf [ Links ]
21. Escott B, Elliot F, Livingstone T. Draft KwaZulu-Natal biodiversity spatial planning terms and processes: Version 3.3. Pietermatizburg: Ezemvelo KZN Wildlife; 2016. [ Links ]
22. Pooley S. Burning Table Mountain: An environmental history of fire on the Cape peninsula. New York: Palgrave Macmillan; 2014. https://doi.org/10.1057/9781137415448 [ Links ]
23. National Forests Act of South Africa . Notice No. 1388 South Africa: Government Gazette 19408; 1998. Available from: www.gov.za/sites/default/files/gcis_document/201409/a84-98.pdf [ Links ]
24. Prince S, Von Maltitz G, Zhang F, Byrne K, Driscoll C, Eshel G, et al. Chapter 4: Status and trends of land degradation and restoration and associated changes in biodiversity and ecosystem fundtions. In: Montanarella L, Scholes R, Brainich A, editors. The IPbEs assessment report on land degradation and restoration. Bonn: Secretariat of the Intergovernmental Science-Policy Platform on Biodiversity and Ecosystem services; 2018. p. 315-426. Available from: https://www.ipbes.net/system/tdf/ipbes_6_inf_1_rev.1_2.pdf?file=1&type=node&id=16514 [ Links ]
25. Slingsby JA, Moncrieff GR, Rogers AJ, February EC. Altered ignition catchments threaten a hyperdiverse fire-dependent ecosystem. Glob Chang Biol. 2020;26(2):616-628. https://doi.org/10.1111/gcb.14861 [ Links ]
26. Botts EA, Pence G, Holness S, Sink K, Skowno A, Driver A, et al. Practical actions for applied systematic conservation planning. Conserv Biol. 2019;33(6):1235-1246. https://doi.org/10.1111/cobi.13321 [ Links ]
27. Bland LM, Nicholson E, Miller RM, Andrade A, Carré A, Etter A, et al. Impacts of the IUCN Red List of Ecosystems on conservation policy and practice. Conserv Lett. 2019;12(5), e12666. https://doi.org/10.1111/conl.12666 [ Links ]
28. South African Department of Environment, Forestry and Fisheries. National Environmental Screening Tool [webpage on the Internet]. No date [cited 2020 Aug 04]. Available from: https://screening.environment.gov.za [ Links ]
 Correspondence:
Andrew Skowno
Email: askowno@gmail.com
Received: 17 Apr. 2020
Revised: 04 Aug. 2020
Accepted: 17 Aug. 2020
Published: 29 Jan. 2021
Editors: Teresa Coutinho, Salmina Mokgehle
Funding: South African National Research Foundation (grant no. 118593)
Supplementary Data
The supplementary data is available in pdf: [Supplementary data]

