


Services on Demand
Article
 English (pdf)
 Article in xml format
 Article references
Indicators

Related links
-
 Cited by Google
 -
 Similars in Google
Share

 Permalink
South African Journal of Science
On-line version ISSN 1996-7489
Print version ISSN 0038-2353
S. Afr. j. sci. vol.116 n.9-10 Pretoria Sep./Oct. 2020
http://dx.doi.org/10.17159/sajs.2020/7522
RESEARCH ARTICLE
A portfolio perspective of rural livelihoods in Bushbuckridge, South Africa
Fatima H. RagieI; David W. OlivierII; Lori M. HunterIII, IV; Barend F.N. ErasmusII, *; Coleen VogelII; Mark CollinsonIV, V; Wayne TwineI
ISchool of Animal, Plant and Environmental Sciences, University of the Witwatersrand, Johannesburg, South Africa
IIGlobal Change Institute, University of the Witwatersrand, Johannesburg, South Africa
IIIInstitute of Behavioral Science, CU Population Center, Department of Sociology, University of Colorado Boulder, Boulder, Colorado, USA
IVMRC/Wits-Rural Public Health and Health Transitions Unit (Agincourt), School of Public Health, University of the Witwatersrand, Johannesburg, South Africa
VDSI/MRC South African Population Research Infrastructure Network (SAPRIN), University of Johannesburg, Johannesburg, South Africa
ABSTRACT
Land-based income streams, which include the consumption and selling of crops, livestock and environmental products, are inherent in rural households' livelihoods. However, the off-farm cash income stream - primarily composed of migrant labour remittances, social grants, and savings and loans - is increasing in importance in many regions. This case study of 590 households from Bushbuckridge, South Africa, analyses the economic value of each of these income streams at three points: what enters the household, what is used and what is sold. Two important findings emerge. First, dependence on offfarm cash incomes is far higher than previously suggested by case studies in the area and the benefits of employment accrue to those already better educated and wealthier. This suggests that shifts in offfarm opportunities will exacerbate already deep inequalities. Second, while environmental products and crops are important for direct use, they generate insignificant cash incomes from sales. This suggests a weakening of the direct links between the local ecosystem and this society, challenging traditional notions of African rurality being intrinsically land based.
SIGNIFICANCE:
Off-farm incomes such as wage labour, remittances and social grants are almost the sole source of cash for households in the study area. Even when including non-monetary incomes such as harvested produce, foraged goods and livestock products, off-farm incomes still represent the overwhelmingly largest proportion of overall household income value. This highlights the fact that South African rural economies are not consistently or primarily land based, and indicates the necessity of rural development strategies that facilitate participation in local cash economies. Otherwise, such efforts will be unable to yield broad benefits and will, instead, simply enrich those who are already better off.
Keywords: land-based income, off-farm cash income, income streams, rural households, sustainable livelihoods
Introduction
Household incomes in rural areas have been historically land-based, involving activities like cropping, livestock farming and resource harvesting, and were thus directly dependent on local ecosystem services.1 However, a considerable body of scholarship records the deagrarianisation of rural economies resulting from increasingly accessible industries, markets and infrastructure.2-4 In South Africa, increases in off-farm cash incomes are also driven by unprecedented access to information and communication technologies, as well as higher levels of education and modern attitudes in young adults from rural areas who are both pressured and aspire to exit land-based livelihoods.5
While this shift presents opportunities for some rural South African households, growing dependence on cash incomes may marginalise those individuals who are less likely to be able to afford to buy goods or pay for basic services, nor have the financial or human capital to engage in migrant labour.5,6 Unchecked economic development in rural areas may therefore create greater inequality, while only benefitting the few households that are already economically well positioned.
A growing dependence on off-farm cash incomes has been noted in the study area7,8, indicating weakening feedback loops between a rural society and its surrounding ecology1. The wealth of some rural households may protect their livelihood against a depleted local environment, but for many, having a range of land-based income streams provides basic needs such as food security and resilience against seasonal and cyclical stresses, as well as against sudden shocks, such as the death of a household member.9,10
Environmental products in particular are generally freely available and are therefore a useful safety net from these stresses and shocks.9,10 Common types of environmental products include fuelwood and wild foods.11 Foraging for environmental products primarily contributes economic value to a household's livelihood portfolio from direct use, rather than from sales.12 This refers to a product's direct use value (DUV), which quantifies this direct consumption according to local monetary values.13 In the study region, commonly consumed wild foods include fruits, herbs and insects13, which households use to supplement their food security and other basic needs9,14.
Another income stream valued for its DUV in the study region is agriculture, which is broadly divided into crops and livestock.11 In some African countries, cropping provides the greatest portion of household income15, roughly equivalent to full-time employment as a labourer16. Very little of this value is, however, converted into cash through sales.3 Case studies from other villages in Bushbuckridge, South Africa, find that most households grow crops for direct use, but may sell some surplus once the household's food security needs are met.5,16 The money saved by supplementing the household diet with own-grown foods may be invested in other livelihood strategies, such as education.17
Households that can afford to buy cattle, or that inherit them, may enjoy agricultural income equivalent to one-third of their entire income portfolio.17 This income could be generated in regular smaller amounts by selling milk or dung, or by renting cattle out for their draught power. Alternatively, households could 'cash in' their investment by selling the whole animal alive or slaughtered.17,18 By these means, cattle provide financial stability to a household18 and support other livelihood strategies such as small enterprises, farming and funding an education17. Cattle ownership and farming, however, incur considerable expenses such as veterinary bills, hired labour, losses due to theft, and the construction and maintenance of corrals and are therefore associated with wealthier households.17,18 Households that cannot afford to farm cattle may farm smaller livestock such as goats, which cost less to buy and maintain.5
Off-farm incomes, typically from wage labour, non-agricultural self-employment, remittances, social grants, and savings and loans are an important source of cash for rural households.2,11,19 Globally, off-farm income makes up one quarter (25%) of the income portfolio of rural households. In South Africa, however, off-farm incomes contribute substantially more - up to 47% - to a rural household's income portfolio.20
This study sheds new light on the relative importance of different income streams to rural households, drawing from a South African case study site, Bushbuckridge. Existing research deals with the same income streams introduced here,2,4,9-11,17-19 but none thus far analyse this full income portfolio simultaneously across time, as undertaken here, in order to examine how households optimise the value of their income streams. In this study, we form an understanding of how a household organises and optimises the entire spectrum of value that flows into it from the full range of income sources, be it from foraging, cropping, livestock keeping or cash incomes. The way we do so is to analyse each income stream at three different 'points of analysis' (POA), namely the value flowing in, the portion of this income that is used directly, and the portion that is converted into cash, as described in more detail under the Data Analysis subsection. By analysing all of the household income streams, as well as distinguishing between cash generated and direct use, we demonstrate that, notwithstanding the presence of cropping, foraging and livestock-keeping in the area, off-farm incomes are almost the sole source of cash for households in Bushbuckridge. This key finding not only highlights the extent of deagrarianisation of former homeland regions such as Bushbuckridge, but also challenges what it means to be rural in the South African context.
Methods
Geography of the area
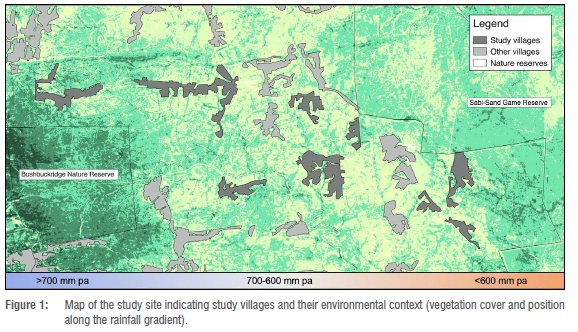
Data collection took place in the Bushbuckridge Local Municipality, Mpumalanga Province, in the northeast corner of South Africa during 2010 (Figure 1). This area is in the savanna biome, characterised by Granite Lowveld bushveld dominated by broad-leafed Combretaceae tree species in the sandy uplands, and species such as Dichrostachys cinerea and Grewia bicolor in the brackish bottomlands.21 Most of the woody vegetation is between 2 m and 5 m high, with canopy cover varying from 5% in the open lands to 60% in woodlands.22 The landscape consists of gently undulating hills.22 The mean annual temperature is 22 °C, with night temperatures rarely low enough to cause frost.22 The highest levels of rainfall occur in the summer months of October to May, with average annual rainfall varying from 800 mm in the west to 580 mm in the more arid east.23
Villages in Bushbuckridge are scattered throughout the landscape, with homesteads aggregated into large settlements surrounded by communal rangelands. A homestead typically features dwellings, animal pens and home gardens in which crops such as maize, squash and ground nuts are cultivated.8 Rangelands are used for grazing livestock and foraging for environmental products.9 These practices appear, however, to be undermining local ecological health and the natural resource base.8
Socio-economic characteristics of the population
Under the apartheid government, what is now the Bushbuckridge Local Municipality was divided between two homelands, Gazankulu and Lebowa. The government forcibly moved black South Africans into these homelands in the 1960s and 1970s, resulting in a large increase in human density and thus substantially increasing pressure on natural resources. This has contributed to creating the peri-urban nature of the Bushbuckridge municipality that we see today.6
Bushbuckridge has a population of 541 248, according to the latest available census data conducted in 2011, with an average annual growth rate of 0.79% (2001-2011).24 Population densities remain high, ranging from 146 people/km2 to over 300 people/km2.25 Key challenges to households include low income levels, high food insecurity25 and an unemployment rate of 50.1%24. A large portion of the population (17%) reported earning no income in the latest census, while an additional 24% earned between ZAR1.00 (USD0.14) and ZAR9600.00 (USD1315.07), which is near or below the national poverty line of ZAR7440.00 (USD1019.18) at the time (conversions are based on the mean 2010 exchange rate of USD1.00 = ZAR7.30).24 Infrastructure in the area, such as roads and piped water, is inadequate, while electricity, although available, is unaffordable to most households for uses other than lighting.25
The quality of formal education in Bushbuckridge is low and few tertiary opportunities are available.25 Although health-care programmes have increased in the area, the growing rate of migrant labour is linked to a high incidence of TB and HIV, which put strain on local health services and household livelihood resilience in general.25
The field site, sampling and data collection
Data for this study were collected by teams led by some of the authors for the Sustainability in Communal Socio-Ecological Systems (SUCSES) research project as part of the broader MRC/Wits Agincourt Health and Socio-demographic Surveillance System. The SUCSES research project is a household livelihoods study linked with environmental monitoring, focusing specifically on interactions between humans and their environment over time. Key questions for the interviews dealt with livelihood capital and income-earning activities and correspond with the income streams addressed in this paper. The human ethics clearance for the SUCSES research project was obtained from the Human Research Ethics Committee (Non-Medical) of the University of the Witwatersrand (M10301).
The study area was delineated into three rainfall zones: >700 mm per annum, 600-700 mm per annum and <600 mm per annum, as rainfall directly affects three of the four income streams, namely environmental income, crop income and livestock income. A selection of nine villages was made: three from each rainfall zone to represent the village size range per rainfall zone. Within each rainfall zone, the villages that were the largest, smallest and closest to the mean were selected to ensure that variability in the important contextual factors of village size and rainfall were captured. This population frame included 7502 households. An 8% sample of households was randomly selected from each village in 2010, resulting in a total sample of 590 households. Only two households declined to participate. Interviews took place at the end of the growing season, April-June. Mean household size in our sample ±s.d. was 8.14±4.14.
Face-to-face interviews with an adult representative of each household collected quantitative data using a hardcopy questionnaire that focused on the livelihood capitals, activities, outcomes and incomes of the household. Interviews were conducted in the local language (Shangaan) by experienced local fieldworkers. Each interview lasted about one hour. Informed consent was obtained before every interview and the principles of the Declaration of Helsinki were adhered to.
The data for our study indicated that households drew on four broad livelihood income streams: environmental income, crops, livestock and off-farm incomes. Environmental, crop and livestock incomes include 'in-kind' uses, or the direct use of these products, as well as the cash generated from their sale. Off-farm incomes, however, refer exclusively to cash incomes primarily consisting of migrant labour, remittances, and savings and loans. Agricultural income streams were calculated per annum, due to the seasonal rhythms of income generation characteristic of agriculture, but the other three income streams were recorded as monthly values, multiplied by the months of the year during which such income was obtained to determine annual amounts.
Data analysis
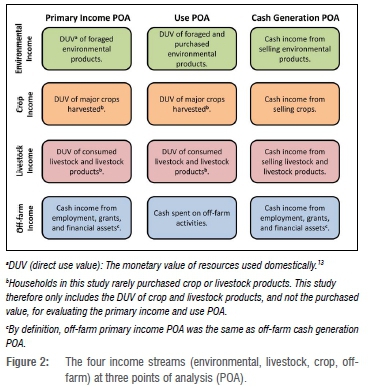
The four income streams (environmental, crops, livestock, off-farm) were analysed using three points that facilitate examination of how households organise and optimise the value of the various streams (Figure 2). The first column in Figure 2, is the primary income POA that comprises the DUV of all products and materials entering the household from any source other than cash purchasing. As such, DUV refers to the cash income earned or received from off-farm sources in addition to the cash equivalent of foraged environmental products, crops harvested and livestock products generated. Thus, DUV excludes cash generated by selling foraged environmental products, crops harvested and livestock products. The use value POA, the second column of Figure 2, focuses only on that which is consumed by the household. This would include, for example, part (or all) of the goods derived from the primary income, in addition to goods that are purchased for household consumption. Finally, the third column, cash generation POA, focuses on the cash derived from selling any left-over products and resources from the primary income (that which the household did not consume directly) as well as cash income earned or received from off-farm sources. As noted, the POAs are not mutually exclusive. The purpose of applying these POAs is not to subdivide the four income streams, but to create a more nuanced understanding of household strategies and the relative contributions of various income streams to overall household portfolios.
In areas of high unemployment, the opportunity costs for some household members' time are difficult to calculate, and may be relatively insignificant.19 Thus, the calculations did not include the opportunity cost of labour spent on foraging or farming. Also excluded was the value of households' utensils and infrastructure, as these did not constitute income flows.
Calculating annual direct use values
Much of the income rural households derive from environmental products, crops and livestock is in the form of direct use, rather than through cash sales.26 Therefore, the annual DUV of each income stream had to be calculated so that the economic contribution of each income stream to the household could be compared. The DUV for each product was calculated by averaging the different actual prices that households had paid for each resource in the past year.
The local units of measurement were converted to metric. These local measurements included mugs full, bucket loads (5-L, 10-L and 20-L buckets were used), maize meal bags full (50-kg and 80-kg bags were used), bundles, wheelbarrow loads and bakkie (pick-up truck) loads. The buckets were already in litre metrics, and the litre capacity of the maize meal bags is uniform, but we drew on existing research for the metrics for mugs full (0.4 L), bakkie loads of fuelwood (532.0 kg), bundles of thatching grass (with a mean diameter of 15 cm) and wheelbarrow loads of fuelwood (39.6 kg).13,27-30
To calculate the DUV of environmental products, respondents were asked the volume per month of each resource and for how many months of the year they foraged for it. Residents who had bought environmental products stated the prices they paid per local unit of measurement. The proportion of quotes per number of users for insects (68.4%), fish (58.0%) and fuelwood (19.1%) were adequately large. The proportion of quotes per user for wild fruit (3.5%) and wild vegetables/herbs (0.4%) was very low, but the quoted prices were similar enough to be accepted.
For calculating crop DUV, the same local metrics were applied as with environmental product DUV calculations. Thirty types of crop were identified in the study area, with six identified as 'major' crops for the area, namely: maize (Zea mays), peanuts (firachis hypogaea), pumpkin leaf (Cucurbita pep), pumpkin (Cucurbita pep), bambara beans (Voandzeia subteranea) and cowpea (Vigna unguiculata). Only the annual volumes of major crops were recorded. Few households sold crops. Thus, even the major crops had no obvious cash value, except maize, which was commercially available and had therefore a relatively stable market value. For this reason, we applied the local estimated price of maize of ZAR1.90 per litre (USD0.26 per litre) to all of the crops, which was inflated from the 1999 prices in Dovie and Shackleton27 to a 2010 value using a consumer price index of 6% per annum. As the studied households did not report buying crops from one another, the use value and the primary income value were the same for crops (Figure 2). Cattle, goats and pigs were identified as the main types of livestock kept by households in the study area. The DUV per animal for Bushbuckridge is provided by Dovie et al.6 which we inflated to 2010 values.
Chickens in Bushbuckridge are left to roam free, so their numbers are erratic over the course of a year. These freely roaming chickens were included in the pilot study and, although 58.5% of households reported owning such chickens, few households could quantify the number of chickens that they owned. As it was not possible to quantify the number of chickens a household owned, the chicken products a household consumed could not be categorised as cultivated, bought or foraged. These freely roaming chickens were therefore excluded from the study, although purchased chicken products were included in the study. Excluding the free-roaming chickens may render the findings of household income values from livestock slightly conservative.
The three POAs provide insight into how households use different income streams. This insight allowed us to identify, not only the relative value of the different income streams to household income portfolios, but also to identify which types of income streams are important at which POA. Distinguishing between incomes in this way is important for understanding how households in Bushbuckridge make a living, and the implications this may have for the people, as well as for the local ecology.
Results
Environmental income
Environmental products provided a staple income source for the study's households. The most common such products included wild vegetables/ herbs (consumed by 95.7% of the households) and fuelwood (92.2%), as well as wild fruit (53.1%) and edible insects (51.0%).
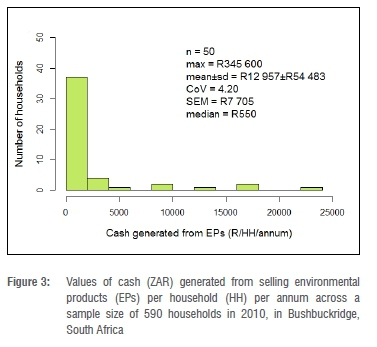
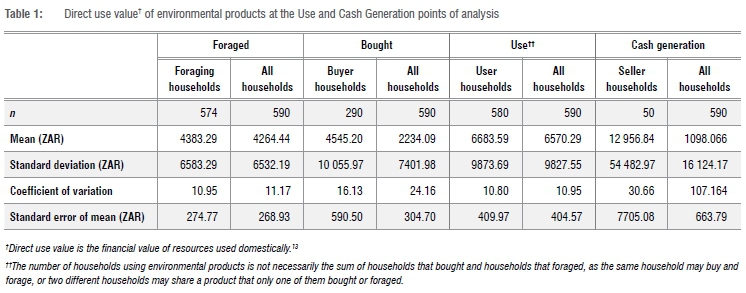
Almost every household (97.3%) foraged for their own environmental products, accruing a mean annual value of ZAR4383.29 (USD600.45) (Table 1). A few of these households sold environmental products (8.5%), generating a relatively high mean annual income of ZAR12 956.84 (USD1774.91). However, the vast majority of households that sold environmental products made a negligible income (Figure 3), suggesting that only a handful of households were trading environmental products at a commercial scale.
About half of the households (49.2%) bought environmental products, spending ZAR4545.20 (USD622.63) on environmental products per annum. The most common purchases were insects (bought by 35.1% of households) and fuelwood (17.6%). The discrepancy between the value sold and the value bought may indicate that some products were sold or bought outside of the study area.
Crop income
Cropping was a popular livelihood activity in Bushbuckridge, with 96.8% practising cropping (Table 2). Households grew a great variety of crops. Thirty types were included in the questionnaire, but only a few types were found in the majority of households' plots. Almost every household (94.6%) grew maize; also popular were peanuts (85.0%), pumpkin leaves (77.4%), pumpkins (66.2%), bambara beans (63.4%), mango (59.0%), cowpea (58.2%) and spinach (52.4%). Spinach was the most popular crop for generating a cash income among the few households (3.7%) that reported selling any of their crops.
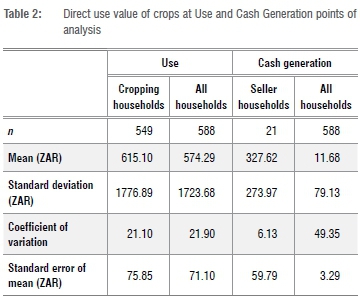
Cash sales of crops generated very little actual cash income; the household mean annual cash income among households that sold crops was only ZAR327.62 (USD44.88). Directly using crops was not economically rewarding either: the annual mean value of crops a household consumed directly was ZAR615.10 (USD84.26). This figure is, however, inflated by a minority of households that used relatively greater values of crops; many of the households used less than one-third of this value.
Livestock income
Few households (18.5%) in Bushbuckridge owned livestock. Of those that did, cattle and goats were almost equally popular (owned by 10.8% and 9.5% of households, respectively). The DUV that households gained from consuming their own livestock's products amounted to a mean annual income of ZAR37 444.84 (USD5129.43) (Table 3).
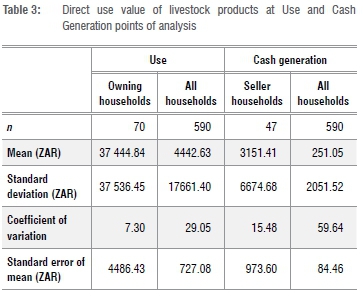
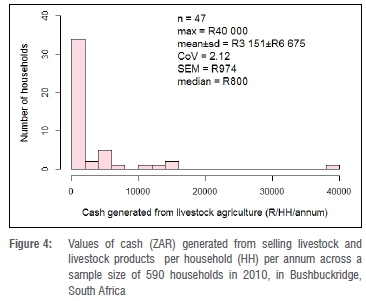
An insignificant number of households bought livestock products, so the households using such products were generally those that owned livestock. Nevertheless, 47 livestock owners (11.9% of all households) reported having sold livestock products in the past year, earning a mean income of ZAR3151.41 (USD431.70) (Table 3). This income is, however, inflated by a minority of high-income earners (Figure 4). The value of livestock sales for the vast majority of livestock owners was negligible, reflected in the median value of ZAR799.35 (USD109.50) for a year's worth of sales, with the majority of sellers earning ZAR199.95 (USD27.39) per annum, at best (Figure 4). This suggests that livestock is only lucrative as an income stream for a small fraction of households in this study.
Off-farm income
Off-farm incomes were ubiquitous, with 99.3% of households reporting an off-farm income. The vast majority of households drew on social grants (84.2%), savings and loans (82.0%) and wage employment (local and migrant labour) (73.1%), although it must be noted that the wage employment included temporary employment. Off-farm income was by far the most lucrative of all the income streams studied, with a mean annual household income of ZAR50 514.98 (USD6919.86) (Table 4).
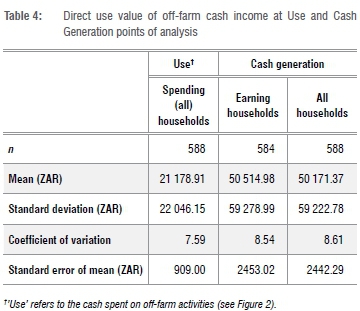
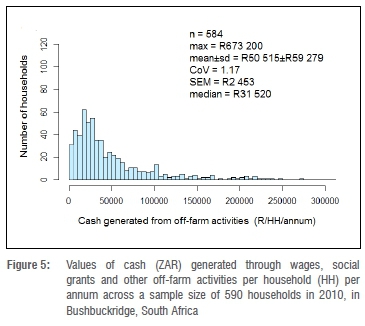
Off-farm income was still relatively low for the majority of the population, with most households falling in the lowest income brackets (Figure 5). Nevertheless, earnings are still far larger than for cash generated by any other income stream. Every household in this study spent cash. The mean annual cash a household spent was ZAR21 178.91 (USD2901.22) - considerably less than the annual mean generated (Figure 5).
The complete livelihood portfolio
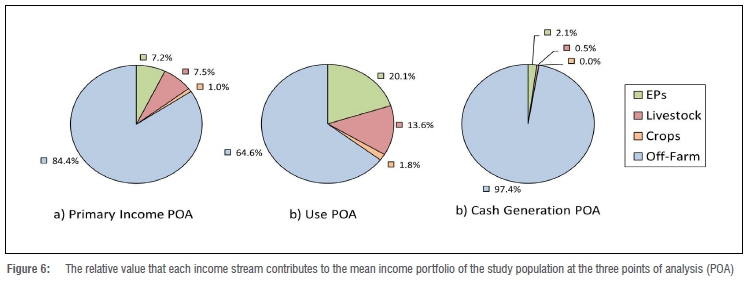
A central contribution of the present study is examination of livelihood income streams at three POAs to illuminate the relative importance of various types of income. Figure 6 illustrates the relative value that each income stream brings to the study population as a whole (averaged across all households) (n=590), at each POA. As shown by Figure 6, off-farm income contributes the greatest amount of value to the study population.
At the primary income level (Figure 6a), off-farm cash incomes make up 84.4% of the study population's mean annual income. The remainder is evenly distributed between the DUV of environmental products and livestock. While almost every household grows crops, the DUV of crops is relatively insignificant compared to the DUV of environmental products and livestock for primary income.
At the used POA (Figure 6b), crops are once again almost insignificant. The DUV of livestock and environmental products play an important role in total household consumption. Environmental products (both bought and foraged) contribute 20.1% of the value of household income used, while livestock (owned and used) contributes 13.6%. Money spent on off-farm activities makes up the difference, showing the high level of monetisation of Bushbuckridge livelihoods, where over two-thirds of what households consume is purchased.
The cash-income POA (Figure 6c) portrays how important off-farm cash generation is for the study households. Very little cash is generated by selling environmental products, livestock products or crops; off-farm incomes contribute almost the sole source of cash income for the villages in these areas.
Discussion
Land-based income streams have been considered a major part of rural income portfolios.17,20 However, by dividing the four income streams into different POAs, we were able to identify which land-based incomes played a key role at which POA, as well as to identify the primary sources of income to the area as a whole. A weakness intrinsic to such an approach is the difficulty with which market values may be established, particularly where rural markets are insufficiently developed.26 In Bushbuckridge, however, considerable work already exists upon which we based our evaluations.5,27,30 Furthermore, markets in Bushbuckridge are, as we argue in this paper, considerably more developed than expected for South African rural areas.
Our findings reflect a high level of dependence on off-farm income, which suggests a deagrarianisation of Bushbuckridge. Existing research indicates broad trends of deagrarianisation across sub-Saharan Africa due to a number of factors, including resource depletion and aspirations to perceived improvements in quality of life made possible through offfarm employment.2,4 Recent research shows comparable trends reflected in the study area.3 While the data presented here are now almost 10 years old, this study still yields useful insights on changing livelihoods in South Africa, and, if anything, it underestimates the current degree to which rural households have become dependent on off-farm livelihood sources. It also provides a valuable baseline with which data from more recent survey rounds (2019 being the latest) can be compared to assess the nature and rates of change.
Environmental income
The DUV of environmental products provides a basic income stream to rural households. Using a meta-analysis of 51 case studies from 17 countries from Africa, Asia and Latin America, Vedeld et al.31 calculated the mean average DUV of environmental products to be 22% of a rural households' income portfolio (or ZAR6263.40 when adjusted to 2010 values) (USD858.00). Our finding that environmental products contribute 20% of the total value of what households consumed in our study area is remarkably similar. Furthermore, the annual value of environmental products foraged by households in the study area, a mean of ZAR4383.29 (USD600.45), also compares favourably to findings from research in rural areas throughout South Africa that found mean annual income values for environmental products ranging between ZAR4409.20 (USD604.00) and ZAR7497.10 (USD1027.00) (adjusted to 2010 values).13,28
Although the vast majority of households in our study used environmental products such as fuelwood, wild vegetables/herbs and insects, few of the households generated sizeable profits from selling environmental products. This finding is consistent with Shackleton et al.'s10 and Thondhlana and Machapondwa's12 findings elsewhere in South Africa and suggests that the direct use of environmental products is for fuelwood and basic food security. The same is evident in other studies from Bushbuckridge.9,14,26 The few households that were making great profits may be those that use motor vehicles and mechanised equipment to remove large quantities of fuelwood for the market, described by Shackleton et al.29, Matsika et al.30 and Cousins26. This trend could present a cause for concern if the rate of extraction increases, as the mechanisation of environmental product foraging facilitates the overexploitation of these natural goods from the commons.26 Depleted local natural resources may create a poverty trap for those who are marginalised from participation in mainstream economies and who depend largely on the direct use of environmental products for their survival.1
Agricultural income
Studies from Africa, Asia and Latin America indicate that cropping and livestock husbandry combined make up 37% of the value of rural households' income portfolios.31 In the study area however, the combined contribution from these two income streams at the used POA is 15% - less than half of the global average. This discrepancy may be attributable to the low frequency of livestock keeping among households and the small volume or low value of crops grown, as well as rainfall levels below the global average, which may limit agricultural productivity.
Consistent with rural areas elsewhere in Africa,32 cropping was practised by almost all of the households in the study area. However, unlike other African rural areas in which cropping and environmental income are equal,15 cropping in Bushbuckridge contributes far less than the other income streams. Even compared to rural villages throughout South Africa,29 where cropping contributes between 7% and 24% of total household income (ZAR1737.40 to ZAR6964.20 at 2010 values) (respectively, USD238.00 to USD954.00), cropping in our study contributed only 2% of household income when averaged across our study population, and only ZAR615.03 (USD84.25) in DUV to the total value of the income a household uses.
Our finding on the relatively low contribution of cropping to household income portfolios relative to existing research may indicate that reliance on off-farm income has increased in the area since Shackleton et al.'s29 data were gathered. This finding is supported by more recent research by Shackleton et al.4 that records a declining trend in cropping as a livelihood throughout South Africa. The low value of cropping in our study may also be due to the constraints on valuating the individual value of diverse crop types: a challenge we overcame by standardising crop value to that of maize. Causality is beyond the scope of this study, but, based on our findings, we would recommend further research on the drivers behind the low cropping incomes in Bushbuckridge.
Research from the area finds that households that are already wealthy can afford to own cattle17,18, but our findings also show that such households derive considerable value from the DUV of livestock as well (ZAR37 444.84 / USD5129.43). Cash generated by households selling livestock products was more moderate (ZAR3158.27 / USD432.64) than the DUV. Compared with previous research from Bushbuckridge,29 which found the DUV of livestock contributing ZAR5584.50 (USD765.00) per household per annum, our findings suggest livestock incomes have become lucrative for the few households that keep them.
Off-farm income
Existing research reports that off-farm incomes in rural areas in the developing South in general31, as well as in South Africa in particular20, contribute 38% and 47% of household income, respectively. However, our primary income POA reveals that off-farm cash income contributes a far greater proportion (84%) of the value of household income in the study area. Furthermore, its value as a source of cash becomes apparent when compared to the monetary contribution made by the other income streams: off-farm incomes are almost the sole source of cash for households in Bushbuckridge.
Research done in 2000 described a growing trend in cash-based, off-farm transactions by households in Bushbuckridge.8 Our research confirms this trend, and even suggests that households are far more dependent on off-farm income than indicated by past studies in the area and in the region. A concern is that increasing monetisation could undermine livelihood resilience for the poorest, as a growing cash economy correlates with high resource extraction.5 Furthermore, research from the study area finds that only the relatively wealthier households can afford for some members to migrate for work.6 Our findings suggest trends of accrual of money, particularly through employment, to those who are already better educated and wealthier. Coupled with decreasing employment opportunities in South Africa, the off-farm employment opportunities enjoyed by the wealthier households in Bushbuckridge suggest a risk that inequality may become reinforced in Bushbuckridge over time.
Conclusion
The key finding of this paper is the inordinately high reliance on offfarm income among rural households in Bushbuckridge. Cursorily, Bushbuckridge livelihoods appear to be diverse, but by dividing the portfolio into different POAs, we found that off-farm income not only takes up a far larger proportion of total household income value than previously found in local and regional case studies, but also that offfarm incomes are almost the sole source of cash for households in the study area. Livestock, the only other income stream that provides some notable cash income, is the privilege of a select few.
Therefore the majority of households in Bushbuckridge that are less able to participate in the off-farm cash economy, and that subsist through cropping and foraging, may find living conditions becoming increasingly difficult as livelihood sustainability becomes increasingly dependent on cash-based transactions. Rural development, the mandate of which is to reverse historical poverty, must recognise this challenge if it is to have broad benefits and not simply enrich those who are already better off.
Acknowledgements
We thank the research participants and their communities for their time and cooperation. The MRC/Wits Rural Public Health and Health Transitions Research Unit (Agincourt Unit) is acknowledged for invaluable assistance through provision of fieldworkers, field logistics, and data management support. This research was conducted as part of the Sustainability in Communal Socio-Ecological Systems (SUCSES) study which was made possible through funding from the National Research Foundation (South Africa). Indirect support was provided by the Wellcome Trust (grant 085477/Z/08/Z) through its support of the Agincourt Health and Socio-demographic Surveillance System (AHDSS). This research has also benefitted from support provided by the University of Colorado Population Center (Project 2P2CHD066613-06), funded by the Eunice Kennedy Shriver National Institute of Child Health and Human Development. The content is solely the responsibility of the authors and does not necessarily represent the official views of the University of Colorado, CUPC or NIH.
Competing interests
We declare that there are no competing interests.
Authors' contributions
F.H.R. and D.W.O were responsible for the conception and design of the article, reviewing the literature and writing and revising the manuscript. W.T. and B.F.N.E were responsible for the conception and design of the study, revising the article and student supervision. M.C. and L.M.H. were responsible for conception and design of the study and revising the article. C.V. was responsible for revising the article.
References
1. Cumming GS, Buerkert A, Hoffmann EM, Schlecht E, Van Cramon-Taubadel S, Tscharntke T. Implications of agricultural transitions and urbanization for ecosystem services. Nature. 2014;515:50-57. https://doi.org/10.1038/nature13945 [ Links ]
2. Bryceson DF. Deagrarianization and rural employment in sub-Saharan Africa: A sectoral perspective. World Dev. 1996;24(1):97-111. https://doi.org/10.1016/0305-750X(95)00119-W [ Links ]
3. Ward CD, Shackleton CM. Natural resource use, incomes, and poverty along the rural-urban continuum of two medium-sized, South African towns. World Dev. 2016;78:80-93. https://doi.org/10.1016/j.worlddev.2015.10.025 [ Links ]
4. Shackleton CM, Mograbi PJ, Drimie S, Fay D, Hebinck P Hoffman MT, et al. Deactivation of field cultivation in communal areas of South Africa: Patterns, drivers and socio-economic and ecological consequences. Land Use Policy. 2019;82:686-699. https://doi.org/10.1016/j.landusepol.2019.01.009 [ Links ]
5. Hull E. The social dynamics of labour shortage in South African small-scale agriculture. World Dev. 2014;59:451-460. https://doi.org/10.1016/j.worlddev.2014.02.003 [ Links ]
6. Dovie DBK, Witowski ETF, Shackleton CM. Monetary valuation of livelihoods for understanding the composition and complexity of rural households. Agric Hum Values. 2005;22(1):87-103. https://doi.org/10.1007/s10460-004-7233-0 [ Links ]
7. Hunter LM, Nawrotzki R, Leyk S, Laurin GJM, Twine W, Collinson M, et al. Rural outmigration, natural capital, and livelihoods in South Africa. Popul Space Place. 2014;20(5):402-420. https://doi.org/10.1002/psp.1776 [ Links ]
8. Giannecchini M, Twine W, Vogel C. Land-cover change and humanenvironment interactions in a rural cultural landscape in South Africa. Geogr J. 2007;173(1):26-42. Available from: https://www.jstor.org/stable/30113491 [ Links ]
9. Hunter LM, Twine W, Patterson L. "Locusts are now our beef": Adult mortality and household dietary use of local environmental resources in rural South Africa. Scand J Public Health. 2007;69:165-174. https://doi.org/10.1080/14034950701356385 [ Links ]
10. Shackleton SE, Shackleton CM, Netshiluvhi TR, Geach BS, Balance A, Fairbanks DHK. Use patterns and value of savanna resources in three rural villages in South Africa. Econ Bot. 2002;56(2):130-146. https://doi.org/10.1663/0013-0001(2002)056[0130:UPAVOS]2.0.CO;2 [ Links ]
11. Angelsen A, Jagger P Babigumira R, Belcher B, Hogarth NJ, Bauch S, et al. Environmental income and rural livelihoods: A global-comparative analysis. World Dev. 2014;64(suppl 1):S12-S28. https://doi.org/10.1016/j.worlddev.2014.03.006 [ Links ]
12. Thondhlana G, Machapondwa E. Dependence on environmental resources and implications for household welfare: Evidence from the Kalahari drylands, South Africa. Ecol Econ. 2014;108:59-67. https://doi.org/10.1016/j.ecolecon.2014.10.003 [ Links ]
13. Twine W, Moshe D, Netshiluvhi T, Siphugu V. Consumption and direct-use values of savanna bio-resources used by rural households in Mametja, a semi-arid area of Limpopo Province, South Africa. S Afr J Sci. 2003;99(9-10):467-473. https://hdl.handle.net/10520/EJC97689 [ Links ]
14. Shackleton CM, Shackleton SE. The importance of non-timber forest products in rural livelihood security and as safety nets: A review of evidence from South Africa. S Afr J Sci. 2004;100:658-664. https://hdl.handle.net/10520/EJC96169 [ Links ]
15. Pouliot M, Treue T, Obiri BD, Ouedraogo B. Deforestation and the limited contribution of forests to rural livelihoods in West Africa: Evidence from Burkina Faso and Ghana. Ambio. 2012;41(11-12):738-750. https://doi.org/10.1007/s13280-012-0292-3 [ Links ]
16. High C, Shackleton CM. The comparative value of wild and domestic plants in home gardens of a South African rural village. Agrofor Syst. 2000;48(2):141-156. https://doi.org/10.1023/A:1006247614579 [ Links ]
17. Chaminuka P Udo HMJ, Eilers KCHAM, Van der Zijpp A. Livelihood roles of cattle and prospects for alternative land uses at the wildlife/livestock interface in South Africa. Land Use Policy. 2014;38:80-90. https://doi.org/10.1016/j.landusepol.2013.10.007 [ Links ]
18. Shackleton CM, Shackleton SE, Netshiluvhi TR, Mathabela FR. The contribution and direct-use value of livestock to rural livelihoods in the Sand River catchment, South Africa. Afr J Range For Sci. 2005;22:127-140. https://doi.org/10.2989/10220110509485870 [ Links ]
19. Babulo B, Muys B, Nega F, Tollens E, Nyssen J, Deckers J, et al. Household livelihood strategies and forest dependence in the highlands of Tigray, Northern Ethiopia. Agric Syst. 2008;98(2):147-155. https://doi.org/10.1016/j.agsy.2008.06.001 [ Links ]
20. Mugido W, Shackleton CM. The contribution of NTFP trade to rural livelihoods in different agro-ecological zones of South Africa. Int For Rev. 2017;19(3):306-320. https://doi.org/10.1505/146554817821865063 [ Links ]
21. Mucina L, Rutherford MC, editors. The vegetation of South Africa, Lesotho and Swaziland. Strelitzia 19. Pretoria: South African National Biodiversity Institute; 2006. [ Links ]
22. Venter FJ, Scholes RJ, Eckhardt HC. The abiotic template and its associated vegetation pattern. In: Du Toit KH, Biggs J, Rogers H, editors. The Kruger experience: Ecology and management of savanna heterogeneity. London: Island Press; 2003. p. 83-129. [ Links ]
23. Shackleton CM. Comparison of plant diversity in protected and communal lands in the Bushbuckridge lowveld savanna, South Africa. Biol Conserv. 2000;94:273-285. http://hdl.handle.net/10204/1497 [ Links ]
24. StatsSA. Bushbuckridge [webpage on the Internet]. [ Links ] c2011 [cited 2019 Aug 28]. Available from: http://www.statssa.gov.za/7page_id=993&id=bushbuckridge-municipality
25. Kahn K, Collinson MA, Gomez-Olive FX, Mokoena O, Twine R, Mee P et al. Profile: Agincourt Health and Socio-demographic Surveillance System. Int J Epidemiol. 2012;41(4):988-1001. https://doi.org/10.1093/ije/dys115 [ Links ]
26. Cousins B. Invisible capital: The contribution of communal rangelands to rural livelihoods in South Africa. Dev South Afr. 1999;16(2):299-318. http://dx.doi.org/10.1080/03768359908440079 [ Links ]
27. Dovie DBK, Shackleton CM. Direct-use value of smallholder crop production in a semi-arid rural South African village. Agric Syst. 2003;76(1):337-357. https://doi.org/10.1016/S0308-521X(02)00124-5 [ Links ]
28. Dovie DBK, Shackleton CM, Witkowski TF. Direct-use values of woodland resources consumed and traded in a South African village. Int J Sus Dev World. 2002;9(3):269-283. https://doi.org/10.1080/13504500209470122 [ Links ]
29. Shackleton SE, Kaschula S, Twine WC, Hunter L, Holding-Anyonge C, Petheram L. Forests as safety nets for mitigating the impacts of HIV/AIDS in southern Africa. Forest Livelihood Briefs. 2006;4:1-4 [cited 2018 Apr 26]. [ Links ] Available from: http://www.cifor.org/publications/pdf_files/livebrief/livebrief0604e.pdf
30. Matsika R, Erasmus BFN, Twine WC. Double jeopardy: The dichotomy of fuelwood use in rural South Africa. Energy Policy. 2013;52:716-725. https://doi.org/10.1016/j.enpol.2012.10.030 [ Links ]
31. Vedeld P Arild A, Bojo J, Sjaastad E, Berg GK. Forest environmental incomes and the rural poor. For Pol Econ. 2007;9(7):869-879. https://doi.org/10.1016/j.forpol.2006.05.008 [ Links ]
32. Babulo B, Muys B, Nega F, Tollens E, Nyssen J, Deckers J, et al. The economic contribution of forest resource use to rural livelihoods in Tigray, Northern Ethiopia. For Pol Econ. 2009;11(2):109-117. https://doi.org/10.1016/j.forpol.2008.10.007 [ Links ]
 Correspondence:
David Olivier
Email: david.olivier@wits.ac.za
Received: 25 Oct. 2019
Revised: 14 Feb. 2020
Accepted: 28 Apr. 2020
Published: 29 Sep. 2020
* Present address: Faculty of Natural and Agricultural Sciences, University of Pretoria, Pretoria, South Africa
Editor: Jane Carruthers
Funding: National Research Foundation (South Africa); Wellcome Trust (grant 085477/Z/08/Z); Eunice Kennedy Shriver National Institute of Child Health and Human Development

