


Services on Demand
Article
 English (pdf)
 Article in xml format
 Article references
Indicators

Related links
-
 Cited by Google
 -
 Similars in Google
Share

 Permalink
South African Journal of Science
On-line version ISSN 1996-7489
Print version ISSN 0038-2353
S. Afr. j. sci. vol.116 n.9-10 Pretoria Sep./Oct. 2020
http://dx.doi.org/10.17159/sajs.2020/8189
RESEARCH ARTICLE
A framework to select a classification algorithm in electricity fraud detection
Sisa Pazi; Chantelle M. Clohessy; Gary D. Sharp
Department of Statistics, Nelson Mandela University, Port Elizabeth, South Africa
ABSTRACT
In the electrical domain, a non-technical loss often refers to energy used but not paid for by a consumer. The identification and detection of this loss is important as the financial loss by the electricity supplier has a negative impact on revenue. Several statistical and machine learning classification algorithms have been developed to identify customers who use energy without paying. These algorithms are generally assessed and compared using results from a confusion matrix. We propose that the data for the performance metrics from the confusion matrix be resampled to improve the comparison methods of the algorithms. We use the results from three classification algorithms, namely a support vector machine, /r-nearest neighbour and naïve Bayes procedure, to demonstrate how the methodology identifies the best classifier. The case study is of electrical consumption data for a large municipality in South Africa.
SIGNIFICANCE:
• The methodology provides data analysts with a procedure for analysing electricity consumption in an attempt to identify abnormal usage.
• The resampling procedure provides a method for assessing performance measures in fraud detection systems.
• The results show that no single metric is best, and that the selected metric is dependent on the objective of the analysis.
Keywords: electricity fraud detection, confusion matrix, classification algorithms
Introduction
Revenue that is lost due to the difference between electricity supplied and electricity purchased is partitioned into two classes. The first class resulting from transmission and other infrastructural limitations is labelled as technical losses, whilst the second class, the majority of which are a result of meter tampering or bypassing, is labelled as non-technical losses1-3 (NTL). Estimates of losses worldwide are in the billions4,5 of US dollars and suppliers of electricity have expressed concern over these losses and the sustainability of the supply6,7.
The literature related to fraudulent electricity losses is detailed with the first traceable case as early as the 19th century claiming, 'unprincipled persons had availed themselves of the opportunity to steal electricity'8,9. More recent literature is a result of the computational hardware and software developments over the last two decades. Galvan et al.10 brought to the fore statistical methods for identifying 'abnormal' consumer behaviour in the electrical domain. This has seen fraud detection systems from finance, banking and insurance being applied to the electricity domain. The review by Messinis and Hatziargyriou11 of the methods applied to detect electricity theft provides compelling evidence that the research domain is exciting and extensive. The review informs researchers of the types of data used in fraud detection, the algorithms that have been proposed and clarifies performance metrics for comparing the algorithms.
A comprehensive list of the classifiers used in electricity fraud detection systems can be found in Messinis and Hatziargyriou11. Notably these include support vector machines (SVM), naïve Bayesian (NB) methods and /-nearest neighbour (k-NN) classifiers - the algorithms used in this study. The field has not stagnated; recent computational methods include convolutional neural networks3 and ensemble-based classifiers7 whilst time series methods have been explored2. In many of these studies, the common methodological approach is to assess the classifier by considering results from a test data set captured in a confusion matrix summary and reported as a performance measure. Several performance measures are used in the literature and for the most part are defined to reflect accuracy and precision of the classifiers.
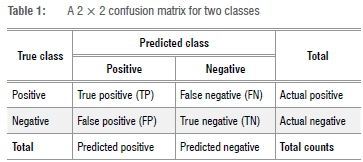
The confusion matrix is a 2 x 2 table summarising the predicted versus the actual frequency counts for a binary classification model. The table, used in the financial sector to identify fraudulent customers, is best suited to data sets for which the number of observations in the two classes are similar or moderately similar. Ideally for a model, the predicted results match the actual counts. In the confusion matrix, this implies that the frequencies of the true positives are the same as the actual positives and the frequencies of the true negatives are the same as the actual negatives. In addition, the false negatives and false positives should be zero. The confusion matrix, in Table 1, was used in studies by Messinis et al.12 and Li et al.3 to assess classification models, whilst Guo et al.13 addressed the problem for data sets which are highly imbalanced.
Our research study had a dual objective. The first objective was to use a resampling approach to assess the performance of the classifier using a data set from the Nelson Mandela Bay Municipality. The second objective was to add to the South African literature on fraud detection in the electrical domain.
Literature review
Electricity fraud detection methods were adapted to a large extent from the methods used to detect fraudulent activity in the banking, insurance and telecommunications sector. Bolton and Hand14 review classification models used for binary identification, albeit in the finance sector. Although the type of data and the ratio of fraudulent activity differ between the financial and electrical domains, the methods are similar, hence they are adapted accordingly.
The last two decades have seen considerable research directed towards electricity fraud. From the earlier work by Galvan et al.10 who evaluated electricity usage in the Spanish farming sector, to Davidson15 and Fourie and Calmeyer16 who introduced NTL research into the South African context, to the behavioural identification of Hu et al.17, the opportunity for research is extensive. Examples of research using fraud detection classification in electricity include Nizar et al.18 who used a NB classifier and decision tree algorithm to assess the consumption load profile of customers at different time intervals. Nagi et al.19 used a SVM classifier to detect fraud for a power system in Malaysia whilst in India, Depuru et al.20 used smart meter data in their SVM classification study. Coma-Puig et al.21 used k-NN and SVM classifiers, amongst others, to evaluate electricity data from Spain, whilst Li et al.3 used several classifiers, including a hybrid random forest classifier, to evaluate data from Ireland. In each study, performance metrics were used to assess which classifier could be considered the best. For a review on classification algorithms in the electricity fraud detection sector the reader is referred to the study by Messinis and Hatziargyriou11.
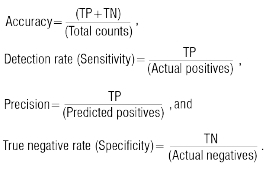
To assess classifiers, predicted data are summarised as a confusion matrix and often reported as a performance measure. Messinis and Hatziargyriou11 clarify the pitfalls of using a single performance measure to assess a classifier. As an example, accuracy is claimed to be the most commonly used metric from a confusion matrix. Accuracy is defined as the percentage of correct classifications in total. However, this statistic summarises both classes simultaneously and if the data set is imbalanced, the correct classification of the larger class could distort the results. As a result, researchers have chosen to include several performance measures when reporting the assessment of a classifier. Coma-Puig et al.21 used the performance measures recall and f-measure whilst Ghori et al.7 and Li et al.3 opted to include precision as one of their measures. There is little consensus on which metric is best; however, there is consensus that more than one metric should be reported. Messinis and Hatziargyriou11 list seven performance metrics used in their review. Their tabulated summary shows that accuracy is the most common metric, followed by detection rate, precision and false positive rate. Definitions and justifications of metrics used in this study are defined in the methodology.
Eskom, a state-owned utility, is the primary energy supplier in South Africa, and generates almost 95% of South Africa's energy.22 Eskom initiated a campaign called Operation Khanyisa in an effort to combat electricity theft in South Africa.6 The campaign reported that Eskom lost approximately USD300 million (ZAR5 billion) in 2016 as a consequence of NTL. Losses to this extent are unsustainable and place at risk the service provider's ability to ensure a steady supply of power.
Apart from Davidson15 and Fourie and Calmeyer16, there has been limited research focused on identifying electricity fraud in the South African sector. Doorduin et al.23 used a simulation experiment to demonstrate how to identify customers whose consumption was irregular. Other industries within the South African context have developed classification models specific to their needs. Examples include Stalmans and Irwin24 who used classification algorithms in cyber-computing to identify malware infections on a local electricity network. Breed and Verster25 focused on the banking sector whilst Govender et al.26 applied the methods in the forecasting of solar irradiance. The scarcity of research in the South African electricity fraud detection sector provides the opportunity for this study.
The data
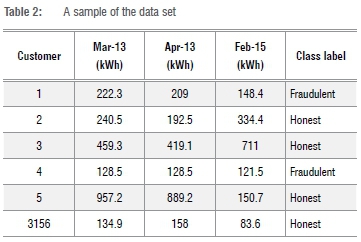
The data set was obtained from a company that was contracted by the Nelson Mandela Bay Municipality to identify possible fraudulent activity in an effort to reduce NTL in the municipality. The data consisted of customers' historical electricity consumptions in kilowatt-hours (kWh) for 24 months from March 2013 to February 2015. Each customer's consumption pattern was categorised as either honest or fraudulent, based on an inspection undertaken by onsite inspectors. Fraudulent customers were defined as those customers where evidence of meter tampering was found by the on-site inspection whilst the remainder were defined as honest. In terms of the confusion matrix, positive values identify the fraudulent consumers and negative values identify the honest consumers.
The data set consisted of 3156 customers, of which 2420 (77%) were categorised as honest and 736 (23%) as fraudulent. A sample of this data set is shown in Table 2. The data were pre-processed and sorted for analytical routines using freeware R v.3.6.127 and licensed TIBCO software Statistica28 v.13.
Although not all NTLs are a result of dishonest activities, for the purposes of this study, NTLs are collectively referred to as fraudulent activities. This definition allows for the use of a data-oriented supervised approach as the data available for analytics were the monthly electrical usage per customer as well as whether the consumer was labelled as an honest client or a fraudulent client.
Methodology
Data-oriented supervised methods require that the source data can be partitioned into two classes as defined by the research study. In electricity fraud, the data must be partitioned into either fraudulent or non-fraudulent (honest) classes whilst the independent terms can include several factors. There are two methods available to collect consumer electricity usage: older meters or those referred to as smart meters. Smart meters have the capability to record electrical use at different time intervals (i.e. hourly, daily, monthly) as well as other information such as the location or area of the meter and the billing costs of the user.20 Older meters have less reliable data in that consumption readings are often only available on a monthly basis and, in most cases, are obtained by manual inspection, monthly estimation or consumer feedback. A limitation to this study is that the data available are predominantly from older meter readings and are subject to human capturing errors. In this study, three classification algorithms were assessed on the case study data following the procedure in Figure 1.
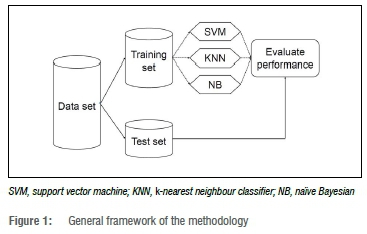
The data were partitioned into a training set and a test set, after which the training data were used by classifiers SVM, k-NN and NB to determine estimates for the prediction model. The model was then assessed by using the test data set to predict the classification of a consumer based on their electricity consumption and then the results were compared against the actual classification. These data were then summarised in a confusion matrix. The sequential procedure followed was:
• Step 1: Pre-process the data by cleaning and sorting as required. Once the data are in the format required by the software for analytical requirements, proceed to Step 2.
• Step 2: Randomly partition two thirds of the sample to a training data set and the remaining one third to a test data set.
• Step 3: Estimate the parameters of the model using the training data.
• Step 4: Test the performance of a fitted model on the test data set as follows:
- Predict the class membership for everyone in the test set.
- Compute a confusion matrix.
- Calculate performance metrics from results in the confusion matrix.
- Repeat Steps 2 to 4 p times to obtain p confusion matrices and p estimates for each metric.
• Step 5: Summarise the performance metrics and assess the statistics inferentially.
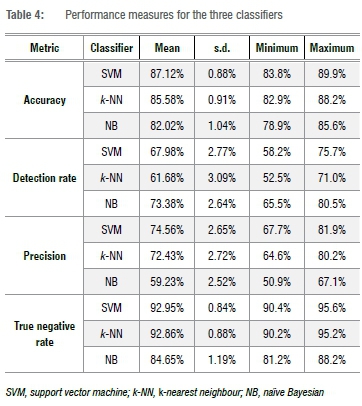
Four performance measures - accuracy, detection rate, precision and true negative rate - were used in this research. Accuracy, detection rate and precision are used extensively in the literature, and therefore it was important that they be included in this study. True negative rate is selected as the fourth measure as it complements precision by providing information to the researcher about the classifier's ability to correctly select the second class of consumers relative to the actual numbers in that class. The measures are defined using the notation from Table 1.
These measures are summarised for the p number of iterations and thereafter assessed inferentially. We used analysis of variance (ANOVA) and Bonferroni post-hoc comparisons to assess the performance metrics. The ANOVA methodology compares the three mean responses for the classifiers for the four performance measures. In cases where the three mean responses were found to differ, the post-hoc comparisons were used to identify where the differences were. The final step in the methodology was the use of Cohen's D to assess the practical significance of the post-hoc comparisons.
Results and discussion
Each classifier was trained on the same folds of training data and thereafter the corresponding test data sets were used to obtain results for the confusion matrix. Each randomly selected training set consisted of 2104 consumers, of which approximately 77% were categorised as honest and 23% as fraudulent. The optimal parameters for the SVM classifier were y=1.3542 and C=2.1639, while for the k-NN classifier, k was 20 and the optimal distance metric was the City Block.
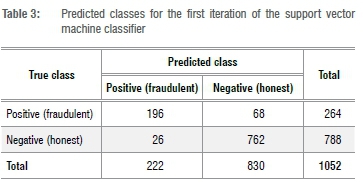
A total of p=500 iterations was used to obtain 500 randomly obtained test set folds, with each fold containing 1052 consumers, of which approximately 77% were categorised as honest and 23% were fraudulent. For the 500 test data sets, 500 confusion matrices were calculated for each classifier. The first iteration of the SVM classifier test data set is shown in Table 3. The results show that, of the 264 fraudulent customers, the classifier was able to correctly predict 196 customers -a precision of 74.4%. Similarly, the accuracy of the classifier was 88.2%.
For each performance measure, the higher the value (%), the better the analytical ability of the classifier to correctly determine the metric. The results in Table 4 indicate that the NB method is the least successful classifier of accuracy, precision and true negative rate, but is the best metric for detection rates. The metric mean is the lowest for the three metrics - accuracy, precision and true negative rate - whilst the variability estimate (the standard deviation) is the largest for two of the three metrics.
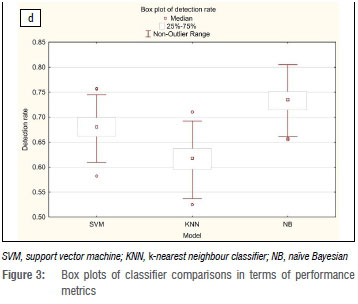
This observation is more apparent in three of the graphical illustrations in Figure 2. In Figure 2b, 2c and 2e, the clustering of the estimates from each iteration demonstrate that the NB algorithm performs poorly in comparison to the k-NN and SVM classifiers. A different pattern emerges for comparisons with the metric detection rate, where NB outperforms both SVM and k-NN. These graphical summaries indicate that no single classifier is the best for all four metrics; the evidence indicate that the classifiers have different abilities. In addition, the plots indicate that there is some overlap of results for the classifiers SVM and k-NN, implying that using both classifiers does not have much benefit. Arguably for data analytic purposes, only one of these two classifiers needs to be used in this domain.
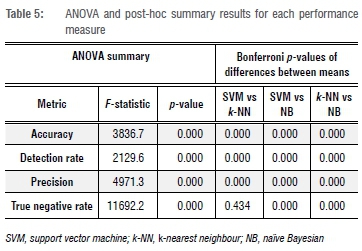
Table 5 summarises the ANOVA results for each metric. For all four metrics, the p-value is very small (<0.01), providing inferential evidence supporting the claim that each performance measure's mean responses for the three classifiers are not equal. The Bonferroni post-hoc comparisons of the differences in performance measures mean responses between two classifiers is also provided in Table 5. Based on the findings with p-values <0.01, there is sufficient evidence to believe that the mean responses per metric for the classifiers differ. The exception is the true negative rate mean responses for the classifiers SVM and k-NN (p=0.43). These findings indicate that at least one classifier is statistically superior to the other(s).
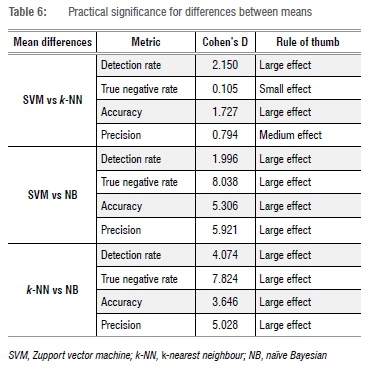
The results in Table 6 report the practical significance of these post-hoc tests using Cohen's D. Of the 12 comparisons, 10 report Cohen's D values exceeding 0.80, while another has a Cohen's D of 0.79. These results are referred to as a large effect and lend evidence to the claim that they are practically significant. The sole small effect is observed for the true negative rate mean responses for the classifiers SVM and k-NN, implying that this response is both practically and statistically insignificant.
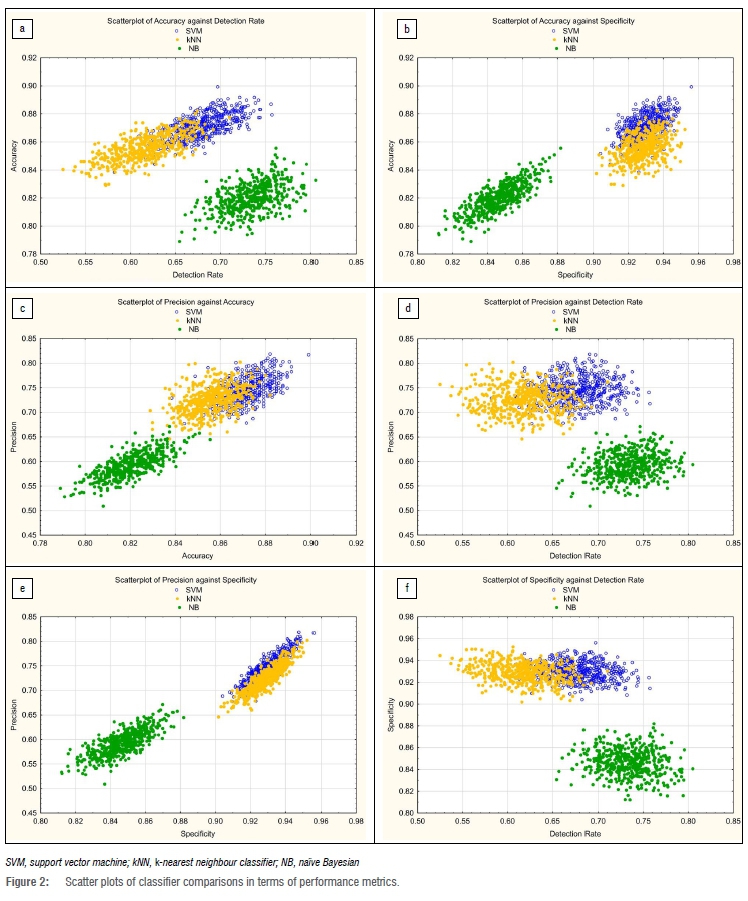
A graphical approach was used to identify which of the classifiers performed the best collectively for the four performance measures. The box plots in Figure 3a-d illustrate the four performance metrics for each classifier in relation to each other. SVM outperforms k-NN for all four metrics, indicating it is the better classifier of the two in this study. The box plots in Figure 3a-c which illustrate the metrics accuracy, precision and true negative rate, respectively, show that the SVM classifier is considerably better than the NB classifier, whilst in Figure 3d the opposite is observed for the detection rate metric. Not only is NB better than SVM, it outperforms k-NN by some margin. These observations lend support to the claim that, collectively, the SVM classifier is the better model for this data set, whilst the other two classifiers give conflicting results.
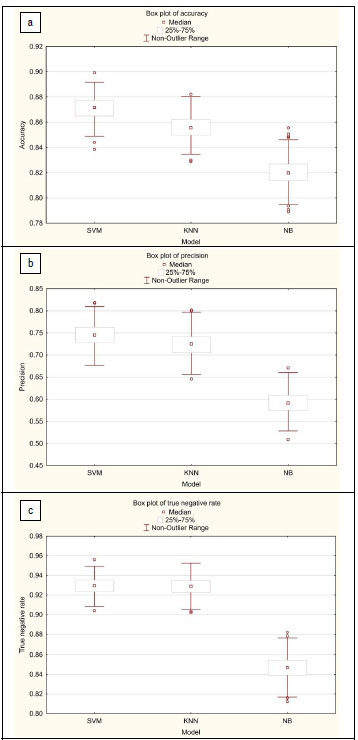
In summary, the three classifiers were compared using four performance measures: accuracy, precision, detection rate and true negative rate. The results for these measures differ significantly as shown graphically and inferred using ANOVA. As the results indicate, no single classifier outperforms all others for every metric. Data analysts need to decide for themselves which performance measure is more relevant to their objectives. As an example, if detection rate is crucial to the study, then it would be useful to include the NB classifier. Alternatively, if an analyst needed a single classifier for these four performance measures, the sVm algorithm is recommended.
Conclusion
This research introduces statistical learning techniques as a method to identify electricity fraud in South Africa. The methodology involved the use of the three classification modelling approaches which were assessed using a test data set. The algorithms were compared using four performance measures which have been applied to fraud detection studies in finance and electricity theft. This methodology contributes to the literature by demonstrating a resampling approach to compare the performance measures. It is important to realise that there is considerable variability when partitioning data into training and test sets and once-off results can be misleading. Adopting a simple resampling approach can provide more clarity on the ability of the classifier to detect electricity fraud. In South Africa, municipalities can improve their revenue stream by identifying fraudulent clients and ensuring that the lost revenue is recovered. This in turn will allow the municipalities to reimburse Eskom for the electricity consumed. Adopting this methodology for fraud detection will allow municipalities to target potential fraudulent customers and reduce the number of manpower hours that would otherwise be required to conduct random on-site inspections.
Acknowledgements
This work is based on data supplied by Amat Security and Cleaning Services (Pty) Ltd on behalf of the Nelson Mandela Bay Municipality. Financial support was provided in part by the SASA/NRF Crisis in Academic Statistics (grant no. 94756) and the Nelson Mandela University Research Department.
Competing interests
We declare that there are no competing interests.
Authors' contributions
S.P undertook the research as a master's student and conducted the data cleaning and statistical analysis, and wrote the first draft of the paper. G.D.S. and C.M.C. were responsible for supervision and revising the original paper. All authors were involved in the conceptualisation and methodology, and gave input into multiple revisions of the paper.
References
1. Monedero IL, Biscarri F, Leon C, Biscarri JY Millan R. MIDAS: Detection of non-technical losses in electrical consumption using neural networks and statistical techniques. In: Proceedings of the International Conference on Computational Science and its Applications. Berlin: Springer; 2006. p. 725734. https://doi.org/10.1007/11751649_80 [ Links ]
2. Villar-Rodriguez E, Del Ser J, Oregi I, Bilbao MN, Gil-Lopez S. Detection of non-technical losses in smart meter data based on load curve profiling and time series analysis. Energy. 2017;137:118-128. https://doi.org/10.1016/j.energy.2017.07.008 [ Links ]
3. Li S, Han Y Yao X, Yingchen S, Wang J, Zhao Q. Electricity theft detection in power grids with deep learning and random forests. J Electr Comput Eng. 2019; Art. #4136874, 12 pages. https://doi.org/10.1155/2019/4136874 [ Links ]
4. PowerNews. Municipalities, utilities meet in bid to protect dwindling revenues [webpage on the Internet]. [ Links ] c2013 [cited 2015 Mar 13]. Available from: http://www.powernews.co.za/news/entry/municipalities-utilities-meet-in-bid-to-protect-dwindling-revenues
5. T & D World Magazine. Home > Smart Grid > India to spend $21.6 billion on smart grid infrastructure by 2025 [webpage on the Internet]. [ Links ] c2015 [cited 2016 Jun 30]. Available from: http://tdworld.com/smart-grid/india-spend-216-billion-smart-grid-infrastructure-2025
6. Operation Khanyisa Partners [homepage on the Internet]. [ Links ] c2017 [cited 2017 Jun 21]. Available from: www.operationkhanyisa.co.za
7. Ghori KM, Abbasi RA, Awais M, Imran M, Ullah A, Szathmary L. Performance analysis of different types of machine learning classifiers for non-technical loss detection. IEEE Access. 2019;8:16033-16048. https://doi.org/10.1109/ACCESS.2019.2962510 [ Links ]
8. Daily Yellowstone Journal, 1886. People who steal Edison's electricity. In: Glauner P Glaeser C, Dahringer N, Valtchev P State R, Duarte D. ResearchGate 2017; 9 pages. Available from: https://www.researchgate.net/publication/325297875 [ Links ]
9. Glauner P Meira JA, Valtchev P State R, Bettinger F. The challenge of nontechnical loss detection using artificial intelligence: A survey. Int J Comput Int Sys. 2017;10(1):760-775. https://doi.org/10.2991/ijcis.2017.10.L51 [ Links ]
10. Galvan JR, Elices A, Muniz A, Czernichow, Sanz-Bobi MA. System for detection of abnormalities and fraud in consumer consumption. Paper presented at: The 12th Conference on the Electric Power Supply Industry; 1998 November 2-6; Pattaya, Thailand. [ Links ]
11. Messinis GM, Hatziargyriou ND. Review of non-technical loss detection methods. Electric Power Systems Res. 2018;158:250-266. https://doi.org/10.1016/j.epsr.2018.01.005 [ Links ]
12. Messinis G, Dimeas A, Rogkakos V Andreadis K, Menegatos I, Hatziargyriou N. Utilizing smart meter data for electricity fraud detection. Paper presented at: First South East European Regional CIGRE Conference; 2016 June 7-8; Portoroz, Slovenia. p. 4-21. [ Links ]
13. Guo X, Yin Y Dong C, Yang G, Zhou G. On the class imbalance problem. IEEE Fourth Int Conf Nat Comput. 2008:192-201. https://doi.org/10.1109/ICNC.2008.871 [ Links ]
14. Bolton RJ, Hand DJ. Statistical fraud detection: A review. J Stat Sci. 2002;17:235-255. [ Links ]
15. Davidson IE. Evaluation and effective management of non-technical losses in electrical power networks. IEEE Africon, Pretoria, South Africa. 2002;473-477. [ Links ]
16. Fourie JW, Calmeyer JE. A statistical method to minimize electrical energy losses in a local electricity distribution network. In: Proceedings of the IEEE Africon; 2004 September 15-17; Gaborone, Botswana. IEEE; 2004. p. 667-673. [ Links ]
17. Hu W, Yang Y Wang J, Huang X, Cheng Z. Understanding electricity-theft behavior via multi-source data. Paper presented at: WWW '20; 2020 April 20-24; Taipei, China. https://doi.org/10.1145/3366423.3380291 [ Links ]
18. Nizar AH, Dong ZY, Zhao JH. Zhang P A data mining based NTL analysis method. In: Proceedings of the IEEE Power Engineering Society General Meeting; 2007 June 24-28; Tampa, Florida, USA. IEEE; 2007. p. 1-8. https://doi.org/10.1109/PES.2007.385883 [ Links ]
19. Nagi J, Mohammad AM, Yap KS, Tiong SK, Ahmed SK. Non-technical loss analysis for detection of electrcity theft using support vector machines. In: Proceedings of the IEEE 2nd International Conference on Power and Energy; 2008 December 1-3; Johor Bahru, Malaysia. IEEE; 2008. p. 907-912. https://doi.org/10.1109/PECON.2008.4762604 [ Links ]
20. Depuru SSSR, Wang L, Devabhaktuni V. Support vector machine based data classification for detection of electricity theft. IEEE/PES Power Systems Conf Expos. 2011:1-8 [ Links ]
21. Coma-Puig B, Carmona J, Gavalda R, Alcoverro S, Martin V. Fraud detection in energy consumption: A supervised approach. IEEE Int Conf Data Sci Adv Anal. 2016. Available from: https://www.cs.upc.edu/~gavalda/papers/dsaa2016.pdf [ Links ]
22. Pazi S. Statistical methods for the detection of non-technical losses: A case study for the Nelson Mandela Bay Muncipality [unpublished MSc dissertation]. [ Links ] Port Elizabeth: Nelson Mandela University; 2016.
23. Doorduin WA, Mouton HT, Herman R, Beukes HJ. Feasibility study of electricity theft detection using mobile remote check meters. In: Proceedings of the 7th IEEE Africon; 2004 September 15-17; Gaborone, Botswana. IEEE; 2004. p. 373-376. https://doi.org/10.1109/AFRICON.2004.1406697 [ Links ]
24. Stalmans E, Irwin BA. A framework for DNS based detection and mitigation of malware infections on a network. In: Proceedings of the IEEE Information Security for South Africa; 2011 August 15-17; Johannesburg, South Africa. IEEE; 2011. p. 1-8. https://doi.org/10.1109/ISSA.2011.6027531 [ Links ]
25. Breed DG, Verster T. The benefits of segmentation: Evidence from a South African bank and other studies. S Afr J Sci. 2017;113(9/10), Art. #20160345, 7 pages. http://dx.doi.org/10.17159/sajs.2017/20160345 [ Links ]
26. Govender P Brooks MJ, Mathews AP. Cluster analysis for classification and forecasting of solar irradiance in Durban, South Africa. J Energy South Afr. 2018;29(2), Art. #4338, 12 pages. http://dx.doi.org/10.17159/2413-3051/2017/v29i2a4338 [ Links ]
27. R Core Team. R: A language and environment for statistical computing. Vienna: R Foundation for Statistical Computing; 2019. Available from: www.R-project.org [ Links ]
28. TIBCO Software Inc. Statistica version 13; 2018. Available from: http://tibco.com [ Links ]
 Correspondence:
Gary Sharp
Email: Gary.sharp@mandela.ac.za
Received: 20 Apr. 2020
Revised: 18 May 2020
Accepted: 13 June 2020
Published: 29 Sep. 2020
Editor: Amanda Weltman
Funding: SASA/NRF Crisis in Academic Statistics (grant no. 94756); Nelson Mandela University.

