


Services on Demand
Article
 English (pdf)
 Article in xml format
 Article references
Indicators

Related links
-
 Cited by Google
 -
 Similars in Google
Share

 Permalink
South African Journal of Science
On-line version ISSN 1996-7489
Print version ISSN 0038-2353
S. Afr. j. sci. vol.116 n.7-8 Pretoria Jul./Aug. 2020
http://dx.doi.org/10.17159/sajs.2020/6813
RESEARCH ARTICLES
Identification of solar periodicities in southern African baobab δ13C record
Pieter B. KotzéI, II, III
ISouth African National Space Agency, Space Science, Hermanus, South Africa
IICentre for Space Research, North-West University, Potchefstroom, South Africa
IIIPhysics Department, Stellenbosch University, Stellenbosch, South Africa
ABSTRACT
Spectral analysis using wavelet, Lomb-Scargle and maximum entropy techniques of the proxy rainfall record of northeastern South Africa based on annual carbon isotope (δ13C) data obtained from baobab trees for the period 1600 AD - 2000 AD show clear evidence of the presence of characteristic solar periodicities. Solar periodicities that were identified above the 95% confidence level include the ~11-year Schwabe cycle, the ~22-year Hale cycle as well as the 80-110-year Gleissberg cycle. A Morlet wavelet analysis of the δ13C data between 1600 AD and 1700 AD shows the effect of the Maunder sunspot minimum on both the Schwabe and Hale cycles during this time.
Significance: A spectral analysis of δ13C baobab tree ring data for southern Africa between 1600 AD and 2000 AD is presented. The results show - for the first time - that the δ13C time series contains the 11-year Schwabe, 22-year Hale as well as the 80-110-year Gleissberg solar periodicities. In addition, the influence of the Maunder sunspot minimum between ~1650 AD and 1715 AD could also be clearly identified in the δ13C data for the first time. These findings are of significant importance to investigations of solar influences on climate variability
Keywords: tree ring, carbon isotope data, spectral analysis, solar influences, climate variability
Introduction
Carbon isotope ratios have been used in the literature1 by several palaeoclimate researchers as a proxy for rainfall in a specific region where data were made available by tree ring investigations. During the process of photosynthetic absorption of atmospheric CO2 by trees and plants, active discrimination occurs against 13CO2 in favour of 12CO2.2 During periods of high rainfall, rapid exchange of CO2 with the atmosphere and trees takes place. During periods of low rainfall, on the other hand, the amount of CO2 available for photosynthesis is restricted to only that inside leaves. Therefore, in regions of low rainfall, like southern Africa, lower δ13C values are associated with wetter conditions, and higher δ13C values are associated with drier conditions during the growth of the wood.3 In order to link carbon isotope ratios to rainfall, one is restricted to trees that only rely on precipitation as a water source. Carbon ratios from the African baobab (Adansonia digitata L.) have shown strong correlation with summer rainfall patterns in southern Africa in a previous study.4
The sun is a variable star that exhibits changes on multiple spatial and temporal scales, and is the most important source of energy for the earth's climate system (see for example a review on this topic by Gray et al.5 and the references therein). Solar activity is characterised by periodicities and cycles that vary on a variety of timescales. The most important periodicities are the ~11-year sunspot cycle (also known as the Schwabe cycle), the ~22-year magnetic cycle (also known as the Hale cycle), the 80-110-year Gleissberg cycle as well as the ~205-year De Vries cycle. These periodicities of solar origin have been identified in several tree ring records and cosmogenic data such as 10Be and 14C (see for example the review by Usoskin6 and the references therein). Convincing evidence for solar influences on weather and climate has been found in the last ~150 years (Hoyt and Schatten7 and references therein). Souza Echer et al.8 found a clear correlation in the 22-year periodicity between global air surface temperature and sunspot number in the interval 1880-2000. Although solar signals have been detected in climate records (e.g. Beer et al.9), one should keep in mind that climate and rainfall is a non-linear system and that several forces are involved in the process. Apart from the direct and indirect effects of solar irradiance (total solar irradiance and ultraviolet), particle radiation effects (solar energetic particles and cosmic rays) also have an effect on the troposphere (see Figure 21 in Gray et al.5). Rigozo et al.10 investigated the solar activity signals in tree ring data in Chile over a period of ~400 years, employing spectral analysis techniques. They found clear evidence for the presence of solar activity: Schwabe (~11-year), Hale (~22-year), fourth-harmonic of the 208-year De Vries (~52-year) and Gleissberg (~80-year) cycles. Several investigations have indicated that solar variations had an effect on pre-industrial climate throughout the Holocene (the warm interval since the last ice age). These studies have been done in several parts across the globe and utilised a large variety of palaeoclimate proxies. The reader is referred to the recent review by Lockwood11. An interesting finding by McKinnell and Crawford12 is the long-term lunar-induced 9.3-year and 18.6-year cycles in the temperature records in some regions over a 400-year period. A wavelet analysis of centennial (1895-1994) rainfall data in southern Brazil by Souza Echer et al.13 confirmed the existence of strong 8.9-, 11.7- and 24.9-year periodicities. 14C time series studies on tree growth rings from Bashkiria (Russia) by Kocharov et al.14 revealed periods close to 21, 9.4 and 13.5 years using advanced spectral analysis methods. Damon et al.15, who also studied a time series of δ14C in tree rings, for the time interval between 1065 AD and 1250 AD, confirmed these results. They also detected a period of ~52 years and attributed it to the fourth harmonic of the Suess or De Vries cycle. The climate of southern Africa is to a large extent semi-arid.16 Except for the southern coastal area, the southern African region receives almost all its rainfall in summer. A characteristic feature of the southern African rainfall record is the pronounced ~80-year cycle that can be traced back 3500 years.16
In this investigation, δ13C measurements obtained from the Pafuri 1000-year-old baobab trees17 were analysed between the years 1600 AD and 2000 AD to identify the presence of possible solar periodicities. Spectral analysis methods such as wavelets18, Lomb-Scargle19,20 and maximum entropy21 were used to obtain statistically significant results above the 95% confidence level. In addition, a Morlet22 wavelet analysis of δ13C between 1600 AD and 1700 AD was performed to investigate the variation in the strengths of, particularly, the Schwabe and Hale cycles during the Maunder sunspot minimum period of 1645-1715 AD (Eddy).23
Data and method of analysis
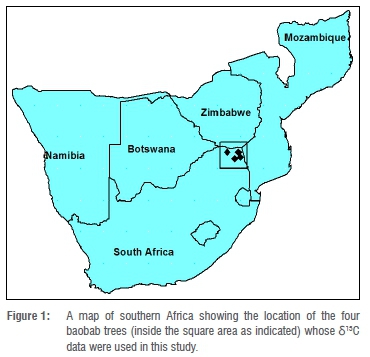
Woodborne et al.17 did a carbon isotope analysis of four South African baobab trees located in the Pafuri area (22°22.925'S, 31°13.145'E; 22°26.647'S, 31°04.745'E; 23°15.765'S, 31°33.309'E; 22°24.352'S, 31°16.676'E) in order to obtain a proxy for rainfall in this region. A map of southern Africa showing the location of the trees is given in Figure 1.
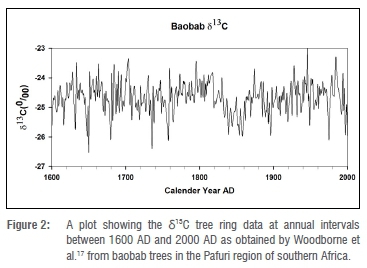
Samples obtained were large enough to separate individual ring structures at 1-year intervals. Woodborne et al.17 subsequently performed an accelerator mass spectrometry radiocarbon analysis of these samples and calibrated the dates using well-known standards and procedures. They used the extracted δ13C data to confirm abnormal dry conditions during the Little Ice Age, particularly during 1635 and 1695. The δ13C data were obtained from Woodborne et al.24 (http://www.ncdc.noaa.gov/paleo/study/17995). Figure 2 shows the data between AD 1600 and 2000 utilised in this investigation.
Three spectral analysis approaches were employed in this investigation to perform a spectral analysis of δ13C time series, namely the wavelet, the Lomb-Scargle periodogram method, and the maximum entropy method, in order to identify characteristic periodicities above the 95% confidence level. Wavelet analysis is used extensively to decompose a time series into time-frequency space and to establish the modes of variability, particularly when the time series under investigation contains non-stationary power at different periods. As the wavelet transform is a localised transform in both space (time) and frequency, this particular property can be usefully applied to extract information from the signal, which is not possible with Fourier techniques (Daubechies).25 All graphs and plots in this paper were produced using the SigmaPlot (www.systat.com) plotting package, while the contour plots were generated using the Interactive Data Language wavelet applet (http://www.exelisvis.com/ProductsServices/IDL.aspx).
Results and discussion
Morlet wavelet power spectra of order 6 were obtained by analysing the δ13C time series at a cadence of 1 year between 1600 AD and 1700 AD. This was done particularly to investigate the behaviour of the Schwabe (~11-year sunspot) cycle as well as the Hale (~22-year magnetic) cycle with time during this interval. The results can be seen in Figure 3 below.
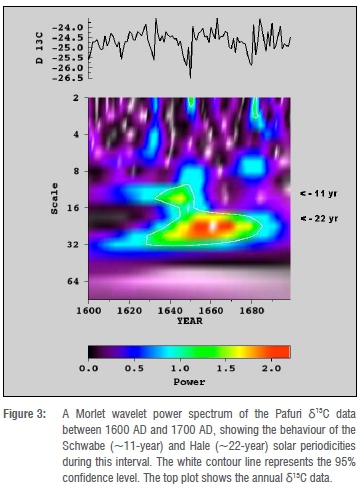
From Figure 3, the 11-year Schwabe sunspot cycle as well as the 22-year Hale solar magnetic cycle can be clearly identified. It is interesting to note that the 11-year sunspot cycle could only be observed between ~1630 AD and 1650 AD above the 95% confidence level, while between ~1650 AD and 1700 AD it disappeared completely. This particular interval coincides with the sunspot Maunder Minimum (1645-1715 AD) when no sunspots could be observed on the surface of the sun and was also known as the Little Ice Age. In the northern hemisphere, extreme cold spells were experienced during the Little Ice Age. It is quite extraordinary that a disappearance of the 11-year Schwabe cycle on the sun did indeed coincide with a similar pattern in the δ13C data obtained from the summer rainfall region of southern Africa. The purpose of this investigation is not to show that rainfall is influenced by the sun, but that during extreme sunspot minimum conditions like the Maunder Minimum, we observe that solar periodicities like the 11-year Schwabe period in rainfall proxy parameters such as δ13C can indeed disappear or become statistically insignificant. On the other hand, due to the sub-dominant role of the 11-year periodicity during the Maunder Minimum, we observe a dominant 22-year periodicity in this time, supporting observations by Mursula et al.26 Similar observations during the Maunder Minimum in solar proxies showing a dominant 22-year periodicity accompanied by a less-dominant Schwabe cycle have been reported by Silverman27 in aurora data and by Miyahara et al.28 in 14C data.
We proceeded with the analysis of δ13C by performing a Lomb-Scargle spectral analysis between 1600 AD and 2000 AD at each 100-year interval in order to identify other prominent periodicities in the data. Results obtained are displayed in Figure 4.
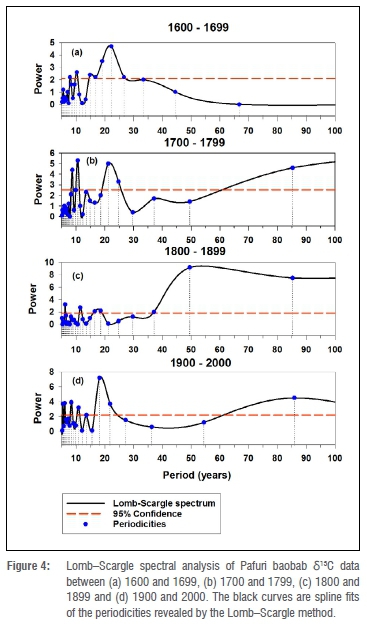
From Figure 4a (and Table 1) a Lomb-Scargle analysis revealed periodicities in the δ13C data at ~18 and 22 years above the 95% confidence level, while the 10.3-year period is marginally statistically significant, confirming our wavelet analysis regarding the 11-year periodicity. The ~18-year period fits in with the general conclusion by Tyson et al.16 that climate variability in the 16-20-year range is a characteristic feature of southern Africa. However, one cannot exclude the possibility that this ~18-year periodicity can be linked to the lunar-induced 18.6-year cycle as reported by McKinnell and Crawford12. This ~18-year cycle has been identified as a characteristic oscillation in southern African rainfall and has been extensively documented in the meteorological records. It appears predominantly in the summer rainfall tree-ring data, but could not be identified during 1700-1799 AD. Figure 4b, representing periodicities observed between 1700 AD and 1799 AD, shows a resurgence of both the 11-year as well as the 22-year cycles, while we also notice with interest the appearance of an 85-year period which represents the solar Gleissberg cycle. Variability at about 80 years has been observed on a global scale. A review by Hoyt and Schatten7 summarises its presence in temperature and precipitation data sets as well as tree-ring investigations. During 1700-1799 AD, we also observed a 24.7-year as well as a 8.7-year periodicity (Table 1). These periods have also been observed in the rainfall records of southern Brazil13 during 1894-1995. The 8.7-year period can possibly be a result of long-term, lunar-induced, 9.3-year modulation of sea-surface temperatures as reported by McKinnell and Crawford12. Periodicities identified between 1800 AD and 1899 AD, exceeding the 95% confidence level, can be seen in Figure 4c and Table 1. Of particular interest is the 11-year Schwabe cycle at 12.1 years as well as the 85-year Gleissberg cycle. In addition, we also see the appearance of a 50-year periodicity which is only observed during 1800-1899 AD. This particular periodicity has been identified by Cohen and Lintz29 as a 'shoulder' to the Gleissberg solar cycle. During 1900-2000 (Figure 4d), our Lomb-Scargle analysis not only revealed the presence of the Schwabe (at 10.9 years), Hale (at 21.7 years) and Gleissberg (at 85.9 years) solar periodicities, but also the ~18-year and ~9-year periods to be statistically significant above the 95% level. Of particular interest is that the ~18-year period has the highest amplitude/strength during 1900-2000.
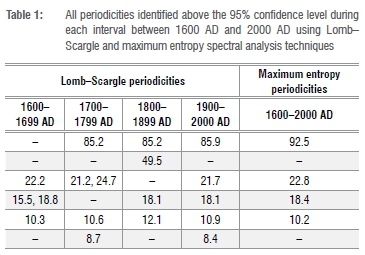
As a next step to verify results obtained by wavelet and Lomb-Scargle methods, we performed a maximum entropy spectral analysis of the Pafuri baobab δ13C data for the time interval 1600-2000 AD. Maximum entropy results are shown in Figure 5 and summarised in Table 1.
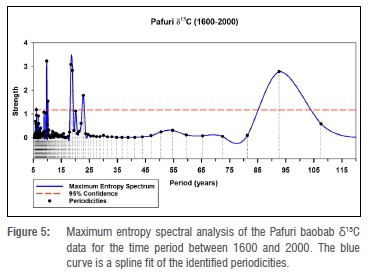
From our maximum entropy analysis, we could clearly identify the 11-year Schwabe (at 10.2 years), the 22-year Hale (at 22.8 years) as well as the Gleissberg solar period (at 92.5 years) above the 95% statistically significant level. In addition, the ~18-year period which is characteristic of southern African rainfall could also be verified. These results show, particularly, that the solar periodicities identified through our spectral analysis techniques are statistically significant.
A cross-spectral analysis was subsequently performed to determine whether a statistically significant correlation exists between sunspot periodicities and the Pafuri δ13C data between 1600 AD and 2000 AD. Cross-spectral analysis is a method to determine the common variability between two time series as a function of periodicity (frequency) and to determine the coherency between them. The Fortran computer program REDFIT-X30 was used to determine the coherence between sunspot numbers and δ13C observations. Results obtained are shown in Figure 6.
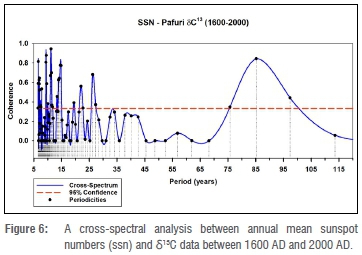
The cross-spectral results clearly show exceptionally strong coherence for the 11-year Schwabe cycle (>0.9) as well as the 85-year Gleissberg cycle (>0.8), while coherence for the 22-year Hale cycle was at a moderate level of 0.56. These results are all well above the 95% confidence level as displayed in Figure 6.
Conclusions
In this study, δ13C measurements from the Pafuri baobab trees between the years 1600 AD and 2000 AD have been analysed in order to identify the presence of possible well-known solar periodicities. Spectral analysis methods such as wavelets, Lomb-Scargle and maximum entropy were employed to obtain statistically significant results above the 95% confidence level. Results obtained show clear evidence of the presence of the 11-year Schwabe sunspot cycle, the 22-year Hale magnetic cycle as well as the 80-100-year Gleissberg solar cycle. In addition, the ~18-year period which is characteristic of southern African rainfall, could also be identified in our spectral analysis, confirming previous investigations of the rainfall pattern across this region. Previous investigations linked this periodicity to lunar-induced effects12 on sea-surface temperatures. A Morlet wavelet analysis of δ13C data, particularly concentrating on the time interval between 1600 AD and 1700 AD, revealed, in particular, that the Schwabe cycle could only be observed between ~1630 AD and 1650 AD above the 95% confidence level, while between ~1650 AD and 1700 AD it disappeared completely. This particular period coincides with the sunspot Maunder Minimum period when hardly any sunspots could be identified on the surface of the sun. This period is also known as the Little Ice Age when exceptionally low temperatures were recorded in Europe. To the best of our knowledge, this is the first identification of the presence of the Maunder Minimum in δ13C tree-ring data in southern Africa. In order to verify our results, we further performed a cross-spectral analysis of sunspot data and δ13C measurements between 1600 AD and 2000 AD. Evidence obtained from this analysis showed exceptionally strong coherence, particularly for the Schwabe and Gleissberg cycles, while a moderate coherence exists for the 22-year Hale cycle. Waple et al.31 investigated solar irradiance forcing on climate over a 200-year period between 1650 AD and 1850 AD preceding the industrial era with its anthropogenic influence. This era is characterised by a wide range of solar irradiance values and includes the Maunder Minimum. The authors conclude that on multi-decadal to century timescales, solar forcing is dominated by the ~90-year Gleissberg cycle, while at decadal timescales the 11-year and 22-year solar cycles dominate.
Sundqvist et al.32 analysed a 350-year δ18O stalagmite record from the summer rainfall region in South Africa and reported a positive correlation with regional air surface temperatures at interannual timescales. They found that during parts of the Little Ice Age, the regional temperature could have been ~1.5 °C colder than today. Prominent 22- and 11-year cycles also indicated that both the solar magnetic as well as the El Nino-Southern Oscillation cycle could be important drivers of multi-decadal to interannual climate variability in southern Africa. A surface water temperature reconstruction from Antarctica33 shows similar features and a cooling of more than 2 °C between 1300 AD and 1800 AD. These records show clear evidence that the Little Ice Age, originally identified in the northern hemisphere, also had a counterpart in the southern hemisphere. Peristykh and Damon34 did an interesting spectral analysis study of δ14C tree-ring data divided into intervals before, during and after the Maunder Minimum. They found that the ~22-year Hale cycle is most prominent during the Maunder Minimum, while the 11-year cycle is totally suppressed. In addition, they also reported that before the Maunder Minimum the Hale cycle had a period of 22.9 years, whereas during the minimum the cycle had two periodicities at 24 and 15.8 years, and after the minimum the Hale cycle had a period of 26 years. Our investigation also confirmed the existence of a 15.5-year periodicity during 1600-1699 AD, but periodicities observed between ~25 and 30 years were found to be below the 95% confidence level. They were therefore regarded as not statistically significant.
The results obtained in this investigation, in particular δ13C measurements from the Pafuri baobab trees in southern Africa between the years 1600 AD and 2000 AD, provide strong evidence of the presence of solar cycles. These δ13C isotope measurements are regarded by palaeoclimatologists as a proxy for rainfall in a particular region. Results obtained in this investigation can be regarded as the first identification of prominent solar cycles in δ13C tree-ring data in southern Africa. Of particular interest is the behaviour of the Schwabe cycle during the Maunder Minimum period between ~1650 AD and 1700 AD.
Acknowledgements
The author thanks the NOAA National Center for Environmental Information for archiving and making the tree ring data available. The assistance and constructive comments of two anonymous reviewers in evaluating this paper are appreciated.
Conflicts of interest
The author declares that no competing interests exist.
References
1.Norstrom E, Holmgren K, Morth CM. Rainfall-driven variations in d13C composition and wood anatomy of Breonadia salicina trees from South Africa between AD 1375 and 1995. S Afr J Sci. 2005;101(3-4):162-168. [ Links ]
2.McCarroll D, Loader NJ. Stable isotopes in tree rings. Quat Sci Rev. 2004;23(7):771-801. https://doi.org/10.1016/j.quascirev.2003.06.017 [ Links ]
3.Farquhar GD, O'Leary MH, Berry JA. On the relationship between carbon isotope discrimination and the intercellular carbon dioxide concentration in leaves. Funct Plant Biol. 1982;9(2):121-137. https://doi.org/10.1071/PP9820121 [ Links ]
4.Robertson I, Loader NJ, Froyd CA, Zambatis N, Whyte I, Woodborne S. The potential of the baobab (Adansonia digitata L.) as a proxy climate archive. Appl Geochem. 2006;21(10):1674-1680. https://doi.org/10.1016/j.apgeochem.2006.07.005 [ Links ]
5.Gray LJ, Beer J, Geller M, Haigh JD, Lockwood M, Matthes K, et al. Solar Influences on Climate. Rev Geophys. 2010;48, RG4001. https://doi.org/10.1029/2009RG000282 [ Links ]
6.Usoskin IG. A history of solar activity over millennia. Living Rev Sol Phys. 2013;10:1-94. https://doi.org/10.12942/lrsp-2013-1 [ Links ]
7.Hoyt DV, Schatten KH. The role of the sun in climate change. New York: Oxford University Press; 1997. [ Links ]
8.Souza Echer MP, Echer E, Nordemann DJR, Rigozo NR. Multi-resolution analysis of global surface air temperature and solar activity relationship. J Atmos Solar-Terrestrial Phys. 2009;71:41-44. https://doi.org/10.1016/j.jastp.2008.09.032 [ Links ]
9.Beer J, Mende M, Stellmacher R. The role of the Sun in climate forcing. Quat Sci Rev. 2000;19:403-415. https://doi.org/10.1016/S0277-3791(99)00072-4 [ Links ]
10.Rigozo NR, Nordemann DJR, Souza Echer MP, Echer E, Silva HE, Prestes A, et al. Solar activity imprints in tree ring width from Chile (1610-1991). J Atmos Solar-Terrestrial Phys. 2007;69(9):1049-1056. https://doi.org/10.1016/j.jastp.2007.03.010 [ Links ]
11.Lockwood M. Solar induced climate effects. In: Encyclopaedia of sustainability science and technology. Berlin: Springer; 2012. [ Links ]
12.McKinnell SM, Crawford WR. The 18.6-year lunar nodal cycle and surface temperature variability in the northeast Pacific. J Geophys Res. 2007;112, C02002. https://doi.org/10.1029/2006JC003671 [ Links ]
13.Souza Echer MP, Echer E, Nordemann DJR, Rigozo NR, Prestes A. Wavelet analysis of a centennial (1895-1994) southern Brazil rainfall series. Clim Change. 2008;87:489-497. [ Links ]
14.Kocharov GE, Ostryakov VM, Peristykh AN, Vasil'ev VA. Radiocarbon content variations and Maunder Minimum of solar activity. Sol Phys. 1995;159:381-391. https://doi.org/10.1007/BF00686539 [ Links ]
15.Damon PE, Eastone CJ, Hughes MK, Kalin RM, Long A, Peristykh AN. Secular variation of δ14C during the Medieval Solar Maximum: A progress report. Radiocarbon. 1998;40(1):343-350. https://doi.org/10.1017/S003382220001821X [ Links ]
16.Tyson PD, Cooper GRJ, McCarthy TS. Millennial to multi-decadal variability in the climate of southern Africa. Int J Climatol. 2002;22:1105-1117. https://doi.org/10.1002/joc.787 [ Links ]
17.Woodborne S, Hall G, Robertson I, Patrut A, Rouault M, Loader NJ, et al. A 1000-year carbon isotope rainfall proxy record from South African baobab trees (Adansonia digitata L.). PLoS ONE. 2015;10(5), e0124202. https://doi.org/10.1371/journal.pone.0124202 [ Links ]
18.Torrence C, Compo GP. A practical guide to wavelet analysis. Bull Am Meteorol Soc. 1998;79:61-78. [ Links ]
19.Lomb NR. Least-squares frequency analysis of unequally spaced data. Astrophys Space Sci. 1976;39:447-462. https://doi.org/10.1007/BF00648343 [ Links ]
20.Scargle JD. Studies in astronomical time series II - Statistical aspects of spectral analysis of unevenly spaced data. Astrophys J. 1982;263:835-853. https://doi.org/10.1086/160554 [ Links ]
21.Ables JG. Maximum entropy spectral analysis. Astron Astrophys Suppl. 1974;15:383-393. [ Links ]
22.Morlet J, Arens G, Forgeau I, Giard D. Wave propagation and sampling theory. Geophysics. 1982;47(2):203-221. https://doi.org/10.1190/1.1441328 [ Links ]
23.Eddy JA. The Maunder Minimum. Science. 1976;192:1189-1202. https://doi.org/10.1126/science.192.4245.1189 [ Links ]
24.Woodborne S, Hall G, Robertson I, Patrut A, Rouault M, Loader NJ, et al. NOAA/WDS Paleoclimatology - Pafuri, South Africa 1000 year baobab tree carbon isotope data [data set]. [ Links ] NOAA National Centers for Environmental Information. 2015 May 13 [cited 2020 Jan 28]. Available from: http://www.ncdc.noaa.gov/paleo/study/17995. https://doi.org/10.25921/k336-r342
25.Daubechies I. The wavelet transform, time-frequency localization and signal analysis. IEEE Trans Info Theory. 1990;36(5):961-1005. https://doi.org/10.1109/18.57199 [ Links ]
26.Mursula K, Usoskin IG, Kovaltsov GA. Persistent 22-year cycle in sunspot activity: Evidence for a relic solar magnetic field. Sol Phys. 2001;198:51-56. https://doi.org/10.1023/A:1005218414790 [ Links ]
27.Silverman SM. Secular variation of the aurora for the past 500 years. Rev Geophys. 1982;30:333-351. https://doi.org/10.1029/92RG01571 [ Links ]
28.Miyahara H, Masuda K, Muraki Y, Furuzawa H, Menjo H, Nakamura T. Cyclicity of solar activity during the Maunder Minimum deduced from radiocarbon content. Sol Phys. 2004;224:317-322. https://doi.org/10.1007/s11207-005-6501-5 [ Links ]
29.Cohen TJ, Lintz PR. Long-term periodicities in the sunspot cycle. Nature. 1974;250:398-400. https://doi.org/10.1038/250398a0 [ Links ]
30.Ólafsdóttir KB, Schultz M, Mudelsee M. REDFIT-X: Cross-spectral analysis of unevenly spaced paleoclimate time series. Comput Geosci. 2016;91:11-18. https://doi.org/10.1016/j.cageo.2016.03.001 [ Links ]
31.Waple AM, Mann ME, Bradley RS. Long-term patterns of solar irradiance forcing in model experiments and proxy based surface temperature reconstructions. Clim Dyn. 2002;18:563-578. https://doi/10.1007/s00382-001-0199-3 [ Links ]
32.Sundqvist HS, Holmgren K, Fohlmeister J, Zhang Q, Bar Matthews M, Spötl C, et al. Evidence of a large cooling between 1690 and 1740 AD in southern Africa. Sci Rep. 2013;3:1767. https://doi.org/10.1038/srep01767 [ Links ]
33.Berter NA, Mayewski NPA, Carter L. Cold conditions in Antarctica during the Little Ice Age - Implications or abrupt climate change mechanisms. Earth Planet Sci Lett. 2011;308:41-51. https://doi.org/10.1016/j.epsl.2011.05.021 [ Links ]
34.Peristykh AN, Damon PE. Modulation of atmospheric 14C concentration by the solar wind and irradiance components of the Hale and Schwabe solar sycles. Solar Phys. 1998;177:343-355. https://doi.org/10.1023/A:1004982321191 [ Links ]
 Correspondence:
Pieter Kotzé
Email:pkotze@sansa.org.za
Received: 13 Aug. 2019
Revised: 28 Jan. 2020
Accepted: 10 Mar. 2020
Published: 29 July 2020
Editor: Yali Woyessa
Funding: None

