


Services on Demand
Article
 English (pdf)
 Article in xml format
 Article references
Indicators

Related links
-
 Cited by Google
 -
 Similars in Google
Share

 Permalink
South African Journal of Science
On-line version ISSN 1996-7489
Print version ISSN 0038-2353
S. Afr. j. sci. vol.116 n.7-8 Pretoria Jul./Aug. 2020
http://dx.doi.org/10.17159/sajs.2020/6517
RESEARCH ARTICLES
Characterisation of wet and dry summer seasons and their spatial modes of variability over Zimbabwe
Moven ManjoweI; Terence MushoreI, II; Electidom MatandirotyaI; Emmanuel MashonjowaI
IDepartment of Physics, University of Zimbabwe, Harare, Zimbabwe
IIDepartment of Geography, University of KwaZulu-Natal, Pietermaritzburg, South Africa
ABSTRACT
In the face of a changing climate, knowledge on the characteristics of wet and dry summers and their modes of variability becomes of great importance to Zimbabwe so that proper policies and planning can be implemented to maximise the positive impacts of climate change while minimising its negative impacts. We used time series of rainfall anomaly index, empirical orthogonal function analysis and composite analysis to determine the temporal and spatial characteristics of summer rainfall in Zimbabwe between 1980 and 2013. Results indicate that there is a possible shortening in the length of the summer season, running from November to March. There were 14 anomalous summer seasons (7 dry and 7 wet) during the 33 summer seasons in the study period. Three dominant modes of variability were identified for Zimbabwean summer rainfall for the period under study: (1) an east-west gradient accounting for about 63% of the total variability, (2) a northeast-southwest oscillation accounting for about 18% of the variability and (3) a northwest-southeast oscillation accounting for about 6% of the variability. From the results, the high frequency of occurrence of above or below normal summer seasons is a major concern due to their far-reaching effects on Zimbabwe's economic and social well-being. Circulation mechanisms influencing such characteristics should be studied and possible predictors identified for the development of short-term climate prediction models. If the forecasting of extreme events is reliable and done with sufficient lead time, the information can be utilised to mitigate the adverse effects while maximising their positive impacts. The findings of this study are important for informing economic activities in sectors such as farming, energy, mining, and tourism, which rely heavily on summer rainfall. However further studies must be carried out to identify the atmospheric and oceanic circulations which lead to such rainfall variability. Such information is critical in the development of reliable rainfall forecasts and early warning systems.
Significance: Rainfall affects a variety of socio-economic activities, especially in Zimbabwe where rain-fed agriculture is a major contributor to the gross domestic product. Therefore, understanding spatial and temporal variations in rainfall enhances the formulation of strategies and decision-making to ensure sustainable development in the country
Keywords: long-term rainfall, Inter-Tropical Convergence Zone, ITCZ, empirical orthogonal function analysis
Introduction
Southern African countries including Zimbabwe have been plagued by recurrent droughts in recent years. The devastating drought of 1982-1984 caused the crop yields in southern Africa to decline to 10% of the average historical levels with many sources of water drying up.1 At least 90% of the livestock in the region was wiped out in the 1982/1983 drought.2 In the 1991/1992 summer season, rainfall was 50% of normal levels over southeastern Africa, surpassing the 1982/1983 drought in severity.3 According to Zhakata4, the 1982/1983 season was one of the worst on record for southern Africa since the 1901/1902 season. Zhakata4 further reported that, in the 1991/1992 rainy season, 90% of inland dams dried up, crops withered, and livestock perished in the thousands in Zimbabwe. A recent study by Manatsa et al.5 showed that there is a strong correlation between maize yield and annual rainfall in rainfed agricultural systems, indicating a strong dependency of maize production and other agricultural activities on rainfall patterns. Thus, characterisation of wet and dry summers over Zimbabwe and their modes of variability is of great importance to the region.
Previous studies on rainfall variability used low spatial resolution data from a sparse rainfall network.2,6,7 These studies mainly focused on rain-bearing features like the Inter-Tropical Convergence Zone (ITCZ). Hence many studies have not addressed the variability which results from other rain-bearing features like westerly cloud bands and cyclones in the Indian Ocean. The Zimbabwean Department of Meteorological Services precipitation data set that is used, amongst others, by many researchers2,8 fails to meet the World Meteorological Organization (WMO) standards for rainfall station density. According to WMO regulations for areas with a variable topography like Zimbabwe, for adequate rainfall analysis, station density must be one rainfall station in every 240 km2 of land.9 However, high-resolution rainfall data from the Global Precipitation Climatology Center (GPCC) at 0.5° latitude by 0.5° longitude grid squares are freely available from NOAA/OAR/ESRL PSD, Boulder, Colorado, USA10 and have the potential to be used to adequately map rainfall variability characteristics for Zimbabwe9. The use of higher-resolution rainfall data sets allows for a wide range of required spatial and temporal details10 which have not yet been fully utilised in Zimbabwe. This is particularly important for Zimbabwe where the topography suppresses or enhances some rainfall triggering systems. Research outputs from using high-resolution data sets would be beneficial, for example in informing localised adaptation strategies, especially in view of potential impacts of the current and anticipated climatic changes on rainfed agriculture, hydropower generation and tourism.
Many studies carried out on variability characteristics of summer rainfall over Zimbabwe have focused on external forcing mechanisms and covered large areas like the whole of southern Africa, thus generalising to large homogeneous regions.11,12 Mamombe et al.8 concentrated on the effects of the El Niño Southern Oscillation and observed that the spatial variability varies in east-west and north-south gradients. However, such results fail to explain observed historical rainfall events which show a northeast-southwest oscillation and a northwest-southeast oscillation. Ogwang et al.12 and Kabanda and Jury13 concentrated on the roles played by the South Atlantic and Indian Oceans in the variability of summer rainfall over Zimbabwe and the rest of the southern African region. This had the effect of smoothing out the small localised variabilities due to the use of low-resolution data sets such as the GPCC precipitation data set with a resolution of 1.0º latitude by 1.0º longitude by Nicholas and Mwafulirwa14 and Ogwang et al.11 and also data sets built from a low density network of rainfall stations6. Similarly, Mamombe et al.8 used data from coarse station networks interpolated between stations to produce a high-resolution data set. Such a data set fails to capture the influence of topography which plays a major role in determining the characteristics of precipitation patterns for regions with variable topography like Zimbabwe.8,14 Due to the use of low-resolution rainfall data sets, these studies failed to fully explain the observed historical variations in Zimbabwean summer rainfall. With the availability of high-resolution data sets from GPCC and other advanced mathematical tools, it has become important to update existing knowledge on the temporal and spatial variability of Zimbabwean summer rainfall. The results can then be compared with those obtained by other authors in the past. The knowledge gained is of great value to the farming community, water resource managers, the energy sector and government for the proper planning and effective management of water resources.
The objectives of this study were to enhance the understanding of the spatial pattern of inter-annual rainfall variability, quantify the number of extreme (dry/wet) summer events which occurred between 1980 and 2013 and establish spatial modes of variability of summer rainfall in Zimbabwe using a high-resolution GPCC data set at 0.5° latitude by 0.5° longitude grid squares. The main hypothesis was that inter-annual variability of summer rainfall over southern Africa, including Zimbabwe, results from the fluctuations in the behaviour of rain-bearing systems during the summer period. These major systems hypothesised to influence rainfall variability are the ITCZ, Angola low pressure system, westerly waves, easterly waves and cyclones or lows in the Mozambican channel.
Data sources and methodology
Description of the study area
Zimbabwe is a landlocked country in southern Africa (Figure 1). Its total area is 309 580 km2, of which a small portion (3910 km2) is covered by water. Despite its small size, the terrain ranges from high altitudes in the eastern and central parts of the country to very low altitudes in the extreme northern, western and southern areas. The highest point (Mount Nyanga) is 2592 m above sea level while the lowest (Beit Bridge) is about 400 m above sea level. The eastern border is only 200 km from the Indian Ocean, so the country is influenced to a large extent by the atmospheric systems in the Mozambican channel. In the low-altitude areas (southwestern regions), the amount of rainfall is very low, resulting in semi-arid conditions, while the high-altitude areas (northeastern regions) enjoy significantly high amounts of precipitation.
The high-altitude areas along the eastern margin of the country also coincide with areas which receive the highest rainfall annually (Figure 1). The eastern highlands also receive rainfall throughout the year due to proximity to the Indian Ocean, which brings in moist air and orographic uplift which enhances activity. In the rest of the country, rainfall is confined to the summer period. Zimbabwe's summer season runs from end October through to late April, with the highest precipitation occurring late December to early February.12 The start and cessation dates of the summer season are quite variable and thus inter-annual variability is high. At times, the season starts in early October and stretches into late April. Long-term mean seasonal rainfall shows north-south and west-east gradients. Such a phenomenon is in response to the country's topography and airflow that approaches Zimbabwe from the northwest and northeast, promoting moist warm air advection.15,16 Cumulative seasonal rainfall exhibits a high degree of inter-annual variability. According to Buckle17, the variability is higher to the south and lower to the north.
Rainfall variability responds to the weakening or strengthening of synoptic scale features, namely: the South Atlantic Ocean high pressure system, the South Indian Ocean high pressure system18, the Angola low pressure system19, the ITCZ20 and finally the number and strength of tropical cyclones passing in the Mozambican channel. These features control the summer mid-tropospheric westerly or easterly wave behaviour, times and areas of surface convergence or divergence, and moist or dry air advection into different parts of the country, hence affecting rainfall totals and intensities at different times of the season as well as in different areas of the country.
Rainfall data collection and processing
The gridded monthly rainfall data were obtained from 0.5 x 0.5 gridded data from the GPCC monthly precipitation data set for the period 1975-2013. The GPCC precipitation data are provided freely by the NOAA/OAR/ESRL PSD (http://www.esrl.noaa.gov/psd).10 The high-resolution data set which merges station and model data sets is suitable for our study area where topography plays a crucial role in modulating precipitation events; due to their low density, rainfall stations alone do not provide sufficient data to depict rainfall variability.
Monthly spatial rainfall analysis using the standardised precipitation index
Monthly rainfall data from GPCC were formulated into their standardised departures using the historical means and standard deviations for each month. Hence, the seasonal cycle (based on averages calculated for the period 1980 to 2013) was removed, such that the standardised data had a mean of zero and a variance of one. In this way, diverse grid points were combined into indices and compared. The time series of monthly and seasonal precipitation was evaluated. The dry and wet years were selected by filtering the years with a standardised anomaly greater than 1 (wet years), those with a standardised anomaly less than -1 (dry years) and those with a standardised anomaly between -1 and 1 (normal years). This selection criterion was successfully used for identifying wet and dry years for Malawi.14 The grid point's precipitation indices were averaged to create one precipitation index for Zimbabwe. This area index was used to identify the dry and wet years.
The normalisation method is used to produce averages of observations from areas with different characteristics, especially in the tropics where rainfall is convective. Normalisation minimises differences in received rainfall owing to terrain and elevation. An index created in this manner has unit variance and zero mean. The creation of the Standardised Rainfall Index for Zimbabwe was based on grid points at a 1.0° latitude × 1.0° longitude resolution.
Data for each grid point for each month was normalised with respect to the individual means and standard deviation according to Equation 1:
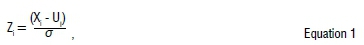
where Zi represents the individual standardised departure of values (monthly data over k years); Xi (i=1, 2..., k) is the observed individual monthly value, Ui is the long-term monthly mean (or seasonal etc.) rainfall, and σ is the long-term standard deviation. In this way, three monthly totals are obtained from monthly values for each grid point starting for December to February (summer) from 1980 to 2013.
The ZRl index was used to select dry years using the following criterion: for all dry years, Zi≤-1; for all wet years, Zi≥+1; and for normal years, -1<Zi<+1.
Retrieval of modes of rainfall variability
In order to retrieve the rainfall variability modes for Zimbabwe, the empirical orthogonal function (EOF) analysis method was performed on the GPCC monthly rainfall data. EOF is a very commonly applied statistical technique in the field of atmospheric science. This technique was known as principal component analysis before Lorenz21 introduced the term EOF into the literature as another name for the eigenvectors of a principal component analysis. EOF is one of the most common methods to extract important patterns from measurements of atmospheric variables.22 Ogwang et al.11 used this technique to show the dominant modes of variability of rainfall over Uganda. Ogallo23 performed an EOF analysis to identify homogeneous regions of climate variability for Eastern Africa. Indeje et al.24 used EOF analysis on the October-December season rainfall from 1961 to 1990 over East Africa. The EOF function defined by the formula of both space and time distributed data is computed using Equation 2:

where Z (xyz) is the original time series as a function of time (t) and space (x,y). EOF (x,y) shows the spatial maps (x,y) of Zimbabwean summer rainfall of each summer season and its variation from year to year. PC(t) is the principal component that shows how the amplitude of each EOF varies with time. The technique enables the capture of a new set of variables of most observed variance from the data through the linear combination of the original variable.
The eigenvector with the highest eigenvalue is the first principal component of the data set. The December-February average rainfall data are for the period 1980-2013 inclusive. A number of studies have been carried out on the EOF method and its significance.25,26 In this study, it was used to show the dominant modes of variability of summer rainfall over Zimbabwe.
Results and discussions
Mean rainfall patterns
The long-term mean annual cycle of rainfall over Zimbabwe is presented in Figure 2. Figure 2 shows that significant rainfall (mean monthly totals above 60 mm) starts in November and ends around March. It can be inferred that there is a possible shortening of the summer season, which is a shift from the results of Buckle17, but in agreement with the results of Mamombe et al.8 These results also show that the peak rainfall occurs in January when the effects of the ITCZ are strongest (mean monthly totals above 140 mm); this finding is in agreement with the results of previous studies.18,22 About 65% of the summer rainfall in Zimbabwe occurs during the period from December to February.
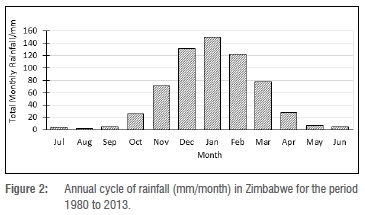
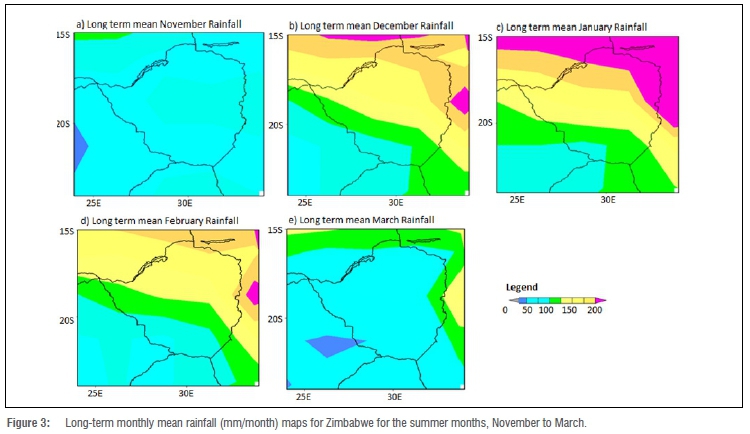
Figure 3 shows the spatial distribution for the long-term mean monthly rainfall for Zimbabwe for the months November to March. The maps in 3a-e show a gradual increase in precipitation to a peak in January, declining in March. From Figure 3, it can be seen that rainfall decreases in north-south and east-west gradients for Zimbabwe. This observation can be explained by the dominant influence of moisture advection into the country due to northeast and southeast airflow which brings moisture from the equatorial regions and from the Indian Ocean. Such results agree with those of Mamombe et al.8 and Buckle17.
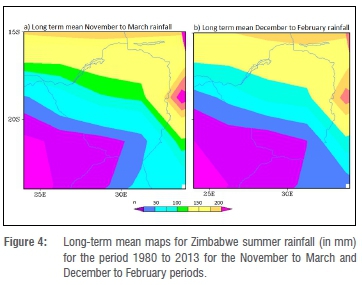
Figure 4 shows the long-term mean rainfall maps (1980-2013) for Zimbabwe. Figure 4a is the long-term mean map for the period November to March while Figure 4b is for the period December to February. The northeastern part of Zimbabwe receives mean monthly rainfall in the range of 100 mm to 200 mm in the November to March period and 125 mm to 200 mm in the December to February period. For the two seasons, the southwestern areas receive rainfall in the range of 0 to 100 mm. The spatial rainfall distribution for the two seasons is similar. By choosing the December to February season to study the characteristics of Zimbabwean summer rainfall, the results from Figure 4 show that this objective can be accomplished. Figure 4a and 4b show that the northeastern areas receive more rainfall while the southwestern areas receive less rainfall - in agreement with results shown in Figure 3. From past studies, the rainfall system responsible for rainfall in the months of October to March was found to be westerly cloud bands.17,21 From the results of this study, the amount of rainfall received in the months of October and April has decreased, leading to a possible reduction in the length of the Zimbabwean summer season. As such, it can be concluded that, due to climate change, the contribution of Zimbabwean summer rainfall due to the westerly cloud bands is decreasing while the contribution from the ITCZ remains dominant.
Spatio-temporal characteristics of Zimbabwe rainfall, 1980-2013
Temporal rainfall analysis using Standardised Rainfall Index time series
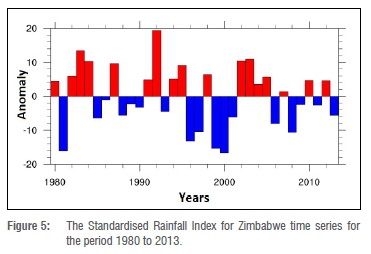
From the Standardised Rainfall Index for Zimbabwe time series for the period 1980 to 2013 (Figure 5), seven wet years (1980/1981, 1995/1996, 1996/1997, 1998/1999, 1999/2000, 2005/2006 and 2007/2008) and seven dry years (1982/1983, 1983/1984, 1986/1987, 1991/1992, 1994/1995, 2001/2002 and 2002/2003) are identified. About 42% of the summer seasons between 1980 and 2013 were extreme rainfall events (wet/dry seasons). It can be deduced that the first period, from the 1981 season to the 1996 season, was relatively dry (five dry seasons) followed by a relatively wet period between 1996 and 2013 (six wet seasons). The 10-year cycle in which successive events of extreme dryness occur is also evident from the findings of previous studies.2,3,6 An extreme wet period precedes or succeeds an extreme dry period in Zimbabwe, as the atmosphere tries to establish a balance. During the study period, rainfall is characterised by oscillating periods of wet and dry years.
Modes of variability from EOF analysis
Figure 6 shows the time series and spatial pattern of the first three eigenvectors (EOF 1-3) of the December-February seasonal rainfall. The data for all 396 months (December-February for 33 years) were used to build the eigenvectors. The first three eigenvectors (PC) explain about 87% of the total variance. Positive loading follows the central watershed (high altitude areas of the country). Weak loading is found in the northeast, southeast, southwest and western parts of the country, corresponding to the low altitude areas. These results cement previous results of other authors which emphasise the dominant role of topography in determining the spatial characteristics of summer rainfall in Zimbabwe.8,15
From EOF 1, 2 and 3, summer rainfall in Zimbabwe has three dominant spatial modes of variability. The largest mode accounts for about 62.7% of summer rainfall variability which occurs in a northeast to southwest gradient. Such a pattern can be explained by moisture advection into the country from the northeast as the ITCZ approaches from the north. The second mode accounts for 17.7% of this variability, emphasising an oscillating pattern in which the northeast/southwest parts are wetter/drier in some years and drier/wetter in other years. This pattern shows evidence of rain-bearing features which approach the country from the southwest and which are stronger in some years and weaker in other years, competing with the ITCZ approaching from the north. Such a feature is the westerly cloud bands which are active at the onset and cessation of summer in southern Africa. These results differ from those of Mamombe et al.8 and Manatsa and Mukwada7 who found an east to west oscillation. The difference could be because the previous studies focused on the effect of El Niño Southern Oscillation and Indian Ocean Dipole Zonal Mode, while the current study looked at other localised synoptic scale features. The smallest mode of variability identified is the northwest to southeast oscillation which results in the northwest/southeast areas being wetter/drier in some years but becoming drier/wetter in other years. This mode accounts for only 6.5% of the total variability. This once more shows the presence of rain-bearing features which control moisture advection into the country - one located to the northwest of the country and another to the southeast. Such features can be identified as the Angola low pressure system and cyclones in the Mozambican channel. The results show the dominance of the ITCZ in influencing both temporal and spatial characteristics of Zimbabwean summer rainfall from EOF 1, while EOF 3 shows the role of the Angola low pressure system and cyclones in the Mozambican channel.
Spatial distribution of rainfall follows a northeast to southwest bias with areas to the northeast receiving more rainfall than areas to the southwest. However, areas to the southwest receive more rainfall in the November to January period than in the January to March period while areas to the northeast receive less rainfall in the November to January period and more rainfall in the January to March period. During dry years, southern and western areas are wetter than normal compared to areas to the north and eastern areas. In years where westerly/easterly waves are weak/strong, the westerly cloud bands/ITCZ are weak/strong which results in drier/wetter southwest/northeast areas. The reverse occurs in other years, resulting in the northwest to southwest fluctuation. A lesser see saw occurs in a northwest to southeast direction, meaning that when cyclone activity is strong/weak in the Mozambican channel, the Angola low pressure system is respectively weak/strong.
Spatial characteristics for December-February rainfall
From the EOF analysis, three dominant modes of variability were obtained in terms of spatial distribution of Zimbabwean summer rainfall (Figure 6). These were the northeast to southwest variation, northeast to southwest oscillation and the smaller mode which is the southeast to northwest oscillation. The results in this section show which variation is dominant for wet and dry years. It is noted that during dry years, the areas usually dry become wetter while those usually wet become drier.
Spatial distribution of summer rainfall in Zimbabwe for wet years
From Figure 7a and 7b, it can be deduced that the rainfall for Zimbabwe during wet years follows the pattern for the long-term mean with a northeast to southwest orientation with rainfall decreasing in the same pattern. The highest amount of precipitation and precipitation anomaly is in the Eastern Highlands in the Mukandi area (250-280 mm monthly mean and >100 mm above long-term mean rainfall). The lowest rainfall anomaly is in the extreme southwest parts around the Beit Bridge to Plumtree area (120-160 mm monthly mean and 50-60 mm above the long-term mean rainfall). The EOF analysis results show the dominating role of the ITCZ on Zimbabwean summer rainfall. From the rainfall anomaly map (Figure 7b), it can be seen that all areas have positive rainfall anomalies. The anomaly belts are oriented in a southeast to northwest direction with anomalies decreasing on either side of the highest anomaly belt, corresponding to the country's topography.
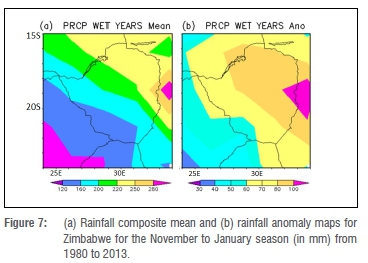
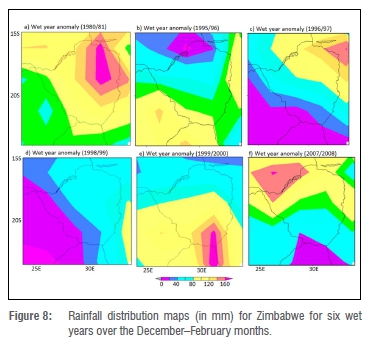
Figure 8 shows the spatial distribution of rainfall for six chosen wet years (1980/1981 season, 1995/1996 season, 1996/1997 season, 1998/1999 season, 1999/2000 season and 2007/2008 season). The maps in Figure 8 show two modes of variability. The dominant rain-bearing factor responsible for wet years is possibly tropical cyclones or a very deep low-pressure system in the Mozambican channel. Tropical cyclones can move into the interior of the subregion either through the Limpopo River to the southeast or through the Zambezi River to the northeast of the country. These cyclones promote moisture advection into the southeast, southern and southwest areas of the country.
Spatial distribution of summer rainfall in Zimbabwe for dry years
Figure 9a and 9b show the composite maps for mean rainfall and anomalies in dry years. It can be deduced that the rainfall for Zimbabwe during dry years also follows the pattern for the long-term mean with a northeast to southwest gradient. The highest amount of precipitation is in the extreme northeast around Mutoko and Muzarabani areas (about 120 mm monthly mean). The lowest rainfall is in the southwest and southeast regions in the Chiredzi, Masvingo, Beit Bridge and Plumtree areas (<60 mm monthly mean).
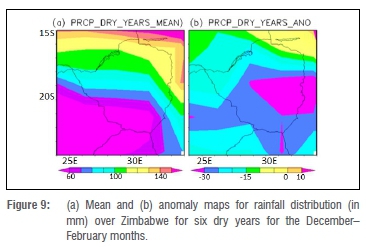
However, the anomaly map (Figure 9b) shows that all areas receive below normal rainfall, with the largest deficit being in the area that usually receives the highest rainfall, the Eastern Highlands (anomaly of -30 mm below long-term monthly mean). Smaller deficits are further to the north, meaning that the tropical rain-bearing system (ITCZ) is still active even in dry years. The low-pressure system in the Mozambican channel is weak during dry years, resulting in large deficits of rainfall in the Eastern Highlands around the Mukandi area.
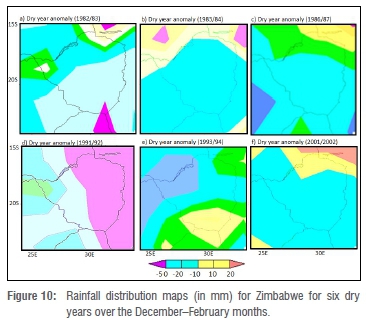
Figure 10 shows the spatial distribution of rainfall for six chosen dry years: (10a) 1981/1982 season, (10b) 1983/1984 season, (10c) 1986/1987 season, (10d) 1991/1992 season, (10e) 1994/1995 season and (10f) 2001/2002 season. Regions usually drier in wet years (northwest and southwest parts) become wetter in dry years. For dry years, the effects of the ITCZ, westerly waves and easterly waves are revealed. From these maps, the dominant effects of each of the three factors can be shown by the areas with positive or negative anomalies. From the anomaly maps, the swings from northeast to southwest and southeast to northwest emerge, showing the effects of the five synoptic scale features which control rainfall characteristics over Zimbabwe. The scale of contribution is also seen by analysing the level of anomaly during such oscillations.
Conclusion
We characterised wet and dry summers and their modes of variability on an inter-annual time scale for Zimbabwe using GPCC model data. The Standardised Rainfall Index, EOF and composite analysis were applied on monthly data covering the period 1980-2013. Based on our findings, the comparatively high spatial resolution GPCC model data set is useful for rainfall studies in regions like Zimbabwe that have a variable topography. Our findings are in agreement with the results of Mwafulrirwa14 who utilised model rainfall data to study rainfall variability over Malawi. This conclusion can be deduced from the capability to accurately identify known historical extreme rainfall events in Zimbabwe from the literature. It was also concluded that there is a possible decrease in the length of the rainfall summer season in Zimbabwe, although more research needs to be done to ascertain and verify these results. Also, the frequency of extreme summer events in both wet and dry seasons was high - at approximately 42% of the 33 years used in the study. Based on the EOF analysis, the spatial distribution of rainfall for the different modes of variability show evidence of the five previously postulated rain-bearing systems being the drivers of inter-annual variability of rainfall in Zimbabwe, as opposed to the results of many researchers e.g. Manatsa et al.5,7 and Mamombe et al.8 who argued that rainfall variability over southern Africa is attributed to the El Niño Southern Oscillation and the Indian Ocean Dipole. The ITCZ, westerly cloud bands, tropical cyclones, easterly waves and Angola low pressure systems are the major systems that contribute to characteristics of wet and dry summers over Zimbabwe for the period under study - this is in agreement with the findings of Jury et al.1,21 and Buckle17 who also report the importance of the ITCZ but downplay the role of tropical cyclones and westerly cloud bands on variability of southern Africa rainfall. Future studies must be done to further analyse these five features, especially their changes in view of climate change. This study focused on Zimbabwe, therefore similar analysis should be done for other regions in southern Africa to verify and ascertain these findings. Resultant findings would then greatly enhance the production of accurate and reliable seasonal forecasts for efficient early warning systems for the region.
Acknowledgements
We thank Mr Collen Mutasa, Dr Vitalis Musara and Mr Innocent Masukuwedza for their guidance, support and immense contributions towards the successful production of this paper; their suggestions and corrections were greatly valuable for the successful completion of this study. Lastly, we thank the Government of Zimbabwe, Government of the Republic of China, World Meteorological Organization and the responsible authorities at NUIST. We gratefully acknowledge the GPCC and NOAA/NCDC for providing data sets.
Authors' contributions
M.M. was responsible for the conceptualisation of the article; identifying the appropriate methodology; data collection, processing and analysis; writing the first draft; and writing revisions. T.M. was involved in the identification of appropriate data sources; validation of data; writing the first draft; and student supervision. E.Matandirotya was instrumental in writing and revising the article; student supervision; and project leadership. E.Mashonjowa was the overall supervisor for the whole team and provided leadership and advice critical for the successful completion of the work.
References
1.Jury MR, Levey K. The climatology and characteristics of drought in the eastern Cape of South Africa. Int J Climatol. 1993;13(6):629-641. https://doi.org/10.1002/joc.3370130604 [ Links ]
2.Makarau A. Intra-seasonal oscillatory modes of the southern Africa summer circulation [PhD thesis]. Cape Town: University of Cape Town; 1995. [ Links ]
3.Jury MR. The structure and possible forcing mechanisms of the 1991-1992 drought in southern Africa. S Afr Tydskr Natuurw Tegnol. 1993;12(1):8-16. https://doi.org/10.4102/satnt.v12i1.551 [ Links ]
4.Zhakata W. Impacts of climate variability and forecasting on agriculture (Zimbabwe experience). In: Proceedings of the Workshop on Reducing Climate-Related Vulnerability in Southern Africa; 1996 October 1-4; Victoria Falls, Zimbabwe. Silver Spring, MD: NOAA; 1996. p. 131-139. [ Links ]
5.Manatsa D, Mushore T, Lenouo A. Improved predictability of droughts over southern Africa using the standardized precipitation evapotranspiration index and ENSO. Theor Appl Climatol. 2017;127(1-2):259-274. https://doi.org/10.1007/s00704-015-1632-6 [ Links ]
6.Dlangezwa K, Africa S. Predictability of Zimbabwe summer rainfall 1. Int J Climatol. 1997;17(13):1421-1432. https://doi.org/10.1002/(SICI)1097-0088(19971115)17:13%3C1421::AID-JOC202%3E3.0.CO;2-Z [ Links ]
7.Manatsa D, Mukwada G. Rainfall mechanisms for the dominant rainfall mode over Zimbabwe relative to ENSO and/or IODZM. Sci World J. 2012;2012, Art. #926310, 15 pages. https://doi.org/10.1100/2012/926310 [ Links ]
8.Mamombe V, Kim WM, Choi YS. Rainfall variability over Zimbabwe and its relation to large-scale atmosphere-ocean processes. Int J Climatol. 2017;37(2):963-971. https://doi.org/10.1002/joc.4752 [ Links ]
9.Awadallah AG. Selecting optimum locations of rainfall stations using kriging and entropy. Int J Civ Environ Eng. 2012;12(1):36-41. [ Links ]
10.Levitus S, Boyer T. Data set. Boulder, CO: NOAA/OAR/ESRL PSD; 1998. [ Links ]
11.Ogwang BA, Chen H, Li X, Gao C. Evaluation of the capability of RegCM4.0 in simulating East African climate. Theor Appl Climatol. 2016;124(1-2):303-313. https://doi.org/10.1007/s00704-015-1420-3 [ Links ]
12.Ogwang BA, Guirong T, Haishan C. Diagnosis of September-November drought and the associated circulation anomalies over Uganda. Pakistan J Meteorol. 2012;9(17):11-24. [ Links ]
13.Kabanda TA, Jury MR. Inter-annual variability of short rains over northern Tanzania. Clim Res. 1999;13(3):231-241. https://doi.org/10.3354/cr013231 [ Links ]
14.Mwafulirwa ND. Climate variability and predictability in tropical southern Africa with a focus on dry spells over Malawi [MSc thesis]. KwaDlangezwa: University of Zululand; 1999. [ Links ]
15.Muchuru S, Landman WA, De Witt DG. Seasonal rainfall predictability over the Lake Kariba catchment area. Water SA. 2014;40(3):461-470. https://doi.org/10.4314/wsa.v40i3.9 [ Links ]
16.Unganai LS, Mason SJ. Long-range predictability of Zimbabwe summer rainfall. Int J Climatol. 2002;22(9):1091-1103. https://doi.org/10.1002/joc.786 [ Links ]
17.Buckle C. Weather and climate in Africa. Harlow: Longman; 1996. [ Links ]
18.Zimbabwean Department of Meterological Services. Climate handbook of Zimbabwe. Harare: Zimbabwean Department of Meteorological Services; 1981. p. 48. [ Links ]
19.Matarira CH. Theoretical and applied climatology frequency and tracks of anticyclones and their effect on rainfall patterns over Zimbabwe. Theor Appl Climatol. 1990;66(1):53-66. https://doi.org/10.1007/BF00865526 [ Links ]
20.Makarau A, Jury MR. Seasonal cycle of convective spells over southern Africa. Int J Climatol. 1997;17(12):1317-1332. https://doi.org/10.1002/(SICI)1097-0088(199710)17:12%3C1317::AID-JOC197%3E3.0.CO;2-A [ Links ]
21.Lorenz EN, Project MI of TSF. Empirical orthogonal functions and statistical weather prediction. Boston, MA: Department of Meteorology, Massachusetts Institute of Technology; 1956. [ Links ]
22.Hannachi A. A primer for EOF analysis of climate data [document on the Internet]. [ Links ] c2004 [cited 2020 Jan 13]. Available from: http://www.o3d.org/eas-6490/lectures/EOFs/eofprimer.pdf
23.Ogallo LJ. Spatial and temporal patterns of East African seasonal rainfall derived from the principal component analysis. Int J Climatol. 1989;9(22):145-167. https://doi.org/10.1002/joc.3370090204 [ Links ]
24.Indeje M, Semazzi FHM, Ogallo LJ. ENSO signals in East African rainfall seasons. Int J Climatol. 2000;20(1):19-46. https://doi.org/10.1002/(SICI)1097-0088(200001)20:1%3C19::AID-JOC449%3E3.0.CO;2-0 [ Links ]
25.Beilfuss R. A risky climate for southern African hydro. Berkeley, CA: International Rivers; 2012. Available from: http://climenews.com/letoltes/zambezi_climate_report_final.pdf [ Links ]
26.Behera SK, Luo JJ, Masson S, Delecluse P, Gualdi S, Navarra A, et al. Erratum: Paramount impact of the Indian Ocean dipole on the East African short rains: A CGCM study (Journal of Climate vol. 18 (21) (4514-4530)). J Clim. 2006;19(7):1361. https://doi.org/10.1175/JCLI3541.1 [ Links ]
 Correspondence:
Moven Manjowe
Email: manjowem@gmail.com
Received: 28 June 2019
Revised: 13 Jan. 2020
Accepted: 25 Feb. 2020
Published: 29 July 2020
Editor: Yali Woyessa
Funding: None

