


Servicios Personalizados
Articulo
 Inglés (pdf)
 Articulo en XML
 Referencias del artículo
Indicadores

Links relacionados
-
 Citado por Google
 -
 Similares en Google
Compartir

 Permalink
South African Journal of Science
versión On-line ISSN 1996-7489
versión impresa ISSN 0038-2353
S. Afr. j. sci. vol.116 no.5-6 Pretoria may./jun. 2020
http://dx.doi.org/10.17159/sajs.2020/7678
MARINE PLASTIC DEBRIS: REVIEW ARTICLE
Monitoring marine plastics - will we know if we are making a difference?
Peter G. RyanI; Lorien PichegruII; Vonica PerolodI; Coleen L. MoloneyIII
IFitzPatrick Institute of African Ornithology, DST-NRF Centre of Excellence, University of Cape Town, Cape Town, South Africa
IIinstitute for Coastal and Marine Research, Department of Zoology, Nelson Mandela University, Port Elizabeth, South Africa
IIIDepartment of Biological Sciences and Marine Research Institute, University of Cape Town, Cape Town, South Africa
ABSTRACT
In the context of marine anthropogenic debris management, monitoring is essential to assess whether mitigation measures to reduce the amounts of waste plastic entering the environment are being effective. In South Africa, baselines against which changes can be assessed include data from the 1970s to the 1990s on microplastics floating at sea, on macro- and microplastic beach debris, and interactions with biota. However, detecting changes in the abundance of microplastics at sea is complicated by high spatial and temporal heterogeneity in net samples. Beach debris data are easier to gather, but their interpretation is complicated by the dynamic nature of debris fluxes on beaches and the increase in beach cleaning effort over time. Sampling plastic ingested by biota is a powerful approach, because animals that retain ingested plastic for protracted periods integrate plastics over space and time, but there are ethical issues to using biota as bioindicators, particularly for species that require destructive sampling (e.g. turtles, seabirds). Bioindicators could be established among fish and invertebrates, but there are technical challenges with sampling microplastics smaller than 1 mm. Fine-scale debris accumulation on beaches provides an index of macroplastic abundance in coastal waters, and offers a practical way to track changes in the amounts and composition of debris in coastal waters. However, upstream flux measures (i.e. in catchments, rivers and storm-water run-off) provide a more direct assessment of mitigation measures for land-based sources. Similarly, monitoring refuse returned to port by vessels is the best way to ensure compliance with legislation prohibiting the dumping of plastics at sea.
SIGNIFICANCE:
• Monitoring is required to assess whether mitigation measures to reduce waste plastics at sea are making a difference.
• Monitoring the leakage of plastic from land-based sources is best addressed on land (e.g. in storm drains and river run-off) before the plastic reaches the sea.
• Illegal dumping from ships is best addressed by monitoring the use of port waste reception facilities.
• Sampling plastic ingested by biota is a powerful approach, using fish and invertebrates as bioindicators for larger microplastic fragments.
Keywords: adaptive management, marine debris surveys, bioindicators, turnover, upstream monitoring
Introduction
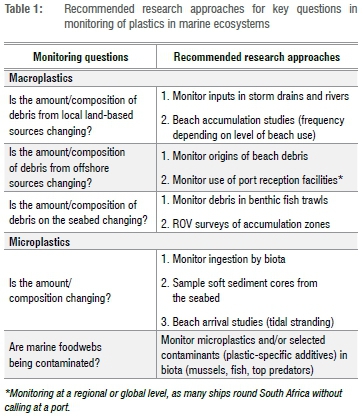
It has long been recognised that waste plastics in the environment have significant ecological and economic impacts, particularly in marine systems.1 By the early 1990s, the focus of research shifted from documenting these impacts to devising solutions to the marine debris 'problem'.2 Monitoring - the repeated measurement of variables to detect change - is a key component of this process, as it forms part of the adaptive management cycle.3 Only by detecting a change in the amounts and types of debris can we assess the efficacy of mitigation measures designed to reduce the amounts of waste plastic entering the environment.4 Monitoring can also detect novel threats, e.g. repeated sampling of beach debris around the South African coast has detected the emergence of novel pollutants such as the switch from card to plastic earbud sticks. And monitoring can be used to ensure compliance to standards, e.g. that levels of microplastics in seafood remain within acceptable levels, although there are currently no international standards for plastic contamination levels. The options for monitoring marine plastics in the four marine compartments - at sea, on the seabed, on beaches and in biota - recently have been reviewed in an attempt to harmonise approaches and improve the comparability of data across studies.5 Here, we summarise existing baseline data that can be used to monitor changes in marine plastics in South Africa (Supplementary table 1), and suggest preferred strategies for monitoring changes in marine debris in the region in relation to some of the most pressing questions regarding marine macro- and microplastics (Table 1).
Monitoring: Why, what and where
Monitoring is a purpose-driven exercise that requires a significant investment in data gathering, analysis and archiving, so the goal needs to be well defined and the process subject to regular review.3 It is thus essential to decide why we want to monitor marine plastics and the extent of the change we want to be able to detect, as this determines the amount of sampling needed.5 We propose five questions pertaining to marine plastic pollution that might justify monitoring programmes in South Africa (Table 1). This list is not exhaustive, and not all of these questions need monitoring programmes.
Once the goal has been identified, the what to monitor can be decided. The key questions in Table 1 are divided into those pertaining to macro- and microplastics. The divisions between plastic size categories are arbitrary,5 and the recognition of three size classes (macro, meso and micro) makes sense in as much as these classes mirror different sampling approaches: macroplastic items are large enough to be recorded visually at sea, or collected by hand on beaches; mesoplastics are caught in neuston nets or sieved from beach sand; and microplastics can be filtered from bulk water samples or separated from sediment samples using density gradient extractions.5 However, there remains debate about the boundaries between these size classes (Figure 1).
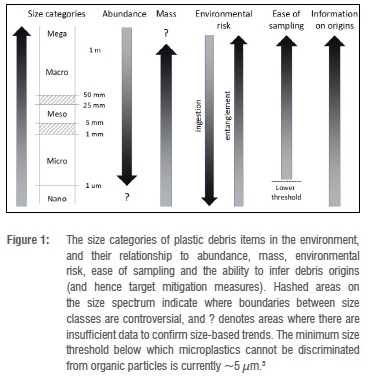
The size of items monitored has significant implications, both in terms of sampling constraints as well as what can be learned from their study (Figure 1). Microplastics dominate plastic pollution numerically, and arguably have a greater environmental impact through plastic ingestion, although ingestion by large marine organisms mainly involves meso- and macroplastics. By comparison, macroplastics are responsible for most entanglement and economic impacts of plastic pollution6,7 and account for the vast majority of marine plastic pollution in terms of mass8. Indeed, most leakage of plastics into the environment occurs through macroplastics (with steps being taken to phase out the few sources of primary microplastics, such as in cosmetics). The origins of macroplastics in marine environments are also easier to infer, through manufacturers' labels and the presence of epibionts,9 and sampling macroplastics does not require sophisticated analytical approaches. Currently there is limited capacity in South Africa to identify particles towards the lower end of the microplastics size spectrum. Even globally, there is as yet no way to identify nanoplastic particles unless they are made with specific tracers.5 As a result, we suggest that monitoring should focus on macroplastics and larger microplastics (mainly >1 mm), which are easy to sample and identify, and pose little risk of sample contamination.
Other questions that should be considered include the spatial scale of the monitoring exercise (local, national, regional or global), and the suite of items to be monitored.4 One of the challenges of sampling macroplastics is deciding on the appropriate level of detail to collect on each item. The minimum should be some idea of size/mass, type of material and broad functional group. However, for many debris types it is possible to record additional information (e.g. brand, date produced, production facility), which can help to infer the origins of marine debris9 but requires considerable effort to collect. If the goal is to track broad trends in debris amounts, it might be better to only record a subset of macro-debris items selected as indicators of specific debris sources.10 Ultimately, the decision of what to monitor comes down to the question being asked.
Having decided what you want to monitor, and identified the best approach to do so, the next step is to design a statistically robust monitoring programme able to detect the desired level of change in pollution levels. This requires a power analysis to decide how many sites need to be monitored, and the sampling intensity and frequency at each site,5,11 which needs an estimate of within-sample variance (the greater the variance, the larger the required sample size) and a decision as to the desired level of change to be detected (e.g. a 5o% reduction in plastic input per year requires much less sampling effort to detect than a 10% reduction per year). The outcome from this exercise has to be compared with available resources to decide whether it is worth investing in a given monitoring programme. Finally, should monitoring go ahead, it is important to select study sites that will remain accessible and not be subject to undue structural changes over the lifespan of the monitoring programme.3
The following sections summarise existing baseline data for marine plastics in the four main environmental compartments off South Africa, and discuss the pros and cons of attempting to use these data sets to monitor changes in the amounts, types and impacts of marine plastics in the region. Additional data sources are listed in Supplementary table 1.
Debris floating at sea and in the water column
Floating plastics at sea typically are sampled by neuston or manta trawls at the sea surface, which target larger micro-plastics (0.5-5 mm).5 These nets usually are at most 1-2 m wide with a mesh size of 200-500 μm, so they are too small to sample the large macro-debris items that account for most of the mass of plastics at sea8 and are too coarse to sample the very small microplastics that account for most plastics by number of items12. One of the first such surveys globally was conducted off the Western Cape in 1977/1978, when 120 stations were sampled monthly for a year.13 Although the net used was unusually coarse (900 μm) and tow durations short (2 min), this large sampling effort collected more than 800 plastic fragments at an average density of 3600 plastic items/km2 (bootstrapped 95% confidence interval [CI] of the mean 2900-4600 items/km2), similar to the density recorded in oceanic waters of the southeast Atlantic in the 1970s.14 As is typical of such surveys, variances were large due to marked spatial and temporal heterogeneity in the distribution of floating debris.4
The only subsequent surveys of floating microplastics off South Africa have occurred since 2016: 43 manta trawls off KwaZulu-Natal15 and 30 neuston trawls throughout the South African Exclusive Economic Zone (FitzPatrick Institute unpublished data). Both studies used a finer mesh (200-333 μm), complicating comparisons of the density of floating microplastic items with the samples from the 1970s. Restricting analysis to particles greater than 1 mm, the average density in 2016-2019 is around 11 000 plastic items/km2 (95% CI 8200-14 600 items/km2), about three times that in the 1970s. This increase is modest given the seven-fold increase in annual plastic production over the last 40 years,16 but confidence in this estimate of change is low given the different areas sampled, large variances among net tows and small number of recent samples. The increase has been driven by increases in user plastics (mostly fragments of hard plastic items). The average density of industrial pellets decreased from 850/km2 (95% CI 545-1020/km2) in 1977/1978 to 190/km2 (40-420/km2) in 2016-2019, and the difference is even more marked when comparing the proportion of pellets now (2%) to that in the 1970s (23%; x2=79.7, d.f.=1, p<0.001). This change in microplastic composition is consistent with the marked decrease in the proportion of pellets ingested by seabirds17 and juvenile turtles18 in the region in the last three to four decades, and mirrors the steady decrease in the abundance of pellets in the North Atlantic Gyre from ~1000/km2 in the mid-1980s to ~250/km2 by 201019.
In comparison to microplastics, there has been less focus on estimating the abundance of floating macroplastic debris at sea, both off South Africa and globally. Most surveys rely on direct observation from vessels or aircraft, although attempts are being made to use remote sensing or camera-based approaches.5,20 The only published historical data on macroplastic debris floating at sea off South Africa are from an aerial survey in 1985 showing a density of debris items an order of magnitude greater 10 km off the Western Cape coast than 50 km offshore.13 Subsequent ship-based surveys have confirmed this spatial pattern, with very high debris concentrations close to urban source areas.21 However, the ship-based observations cannot be compared directly with aerial survey data, so it is not possible to assess whether there has been a change in debris densities over the last three decades.
Very little is known about plastics suspended in the water column around South Africa. The concentration of plastics typically decreases rapidly with water depth, but the pattern depends on item size, buoyancy and the strength of vertical mixing (related to wind stress and other physical processes).5,22 Generally, smaller and less buoyant items are more dispersed vertically throughout surface waters, whereas larger, more buoyant items tend to remain close to the surface (although buoyancy is reduced by biofouling).23 However, even among microfibres, which are the most abundant anthropogenic particulate pollutants in seawater24, the density sampled at 5 m below the surface is 2.5 times lower than at the surface25. Current best practice for sampling subsurface microplastic requires specialised underwater pumps to filter large water volumes.26,27 Macroplastics can be sampled using subsurface trawls28, and this might be a useful approach given the apparently rapid sinking23,29,30 and possible mid-water accumulation31 of near-neutrally buoyant macroplastics such as plastic bags and food wrappers.
Recommendations for monitoring
In terms of future monitoring efforts, three factors argue against using net sampling for monitoring microplastics at sea off South Africa: (1) the very large sample sizes needed to detect changes in plastic concentrations4; (2) the need for dedicated ship's time to sample (typically slowing the ship to 2-3 knots); and (3) the generally exposed nature of the coastline and the often windy conditions, which make it hard to sample from small boats and reduce the efficiency of neuston/ manta nets to sample floating plastics due to vertical mixing. The same limitations apply to subsurface sampling, with the added complication of lower plastic concentrations reducing the ability to detect change. The only advantage of routine subsurface sampling would be the set-up of automated filter systems on ships' underway water supplies. However, this sampling would require the use of relatively coarse filters to prevent clogging by organic material, and the larger plastic particles that might be captured by such an approach are seldom found 3-5 m beneath the surface, at the depth at which ships' water intakes are located. Continuous plankton recorders have proved useful in tracking long-term changes in microplastics in the North Atlantic32 and have been deployed on numerous research cruises off South Africa, but have not been examined for plastics. However, most items captured are fibres32, which are challenging to identify, and recent studies show that most are not synthetic33,34. A more promising approach would be to couple plastic sampling with surveys for commercially important fish eggs and other zooplankton.35,36 Filtering replicate 10-L bulk water samples through a <1-μm fibreglass filter (which requires vacuum filtration) or a 20-25-μm mesh filter (which allows for gravity filtration) is a simple method to assess the abundance of smaller microplastics (<0.5 mm), but sample variance is large, and the risk of sample contamination is high,25 thus reducing the value of this approach for monitoring.
Recording floating macro-debris at sea provides useful insights into broadscale patterns of debris dispersal,21,37 and could be used to monitor changes locally (e.g. fine-scale changes in relation to rainfall events in coastal waters). However, given the limited options to use vessels of opportunity for routine sampling around the South African coast (the Robben Island ferry being the only regular ferry service) and the challenges posed by rough sea conditions37, coupled with the subjective nature of direct debris observations which result in significant inter-observer effects4, this approach is not well suited for long-term monitoring. We thus do not recommend at sea sampling of plastics as a monitoring approach to address the most pressing questions regarding marine plastics in the region (Table 1).
Debris on the seabed
The seabed is likely to be the long-term sink for most plastics globally5,38,39, yet it is the compartment about which we know the least in terms of plastic debris off South Africa40. Survey approaches depend on water depth, seabed type and size of plastics to be sampled.5 For macro-debris, observations by divers or remotely operated vehicles (ROVs) are ideal in shallow water (up to 30 m deep), whereas trawls and ROVs can sample in deeper waters.
In South Africa, recreational divers conduct clean-ups, mainly in heavily impacted areas such as harbours. Such initiatives can generate useful monitoring data as well as raise awareness of the marine debris problem.5,41 The first systematic attempt to assess seabed debris in South Africa, conducted in False Bay in 1991, found low densities of flexible packaging and plastic bottles in shallow subtidal environments.42,43 Monthly surveys at one site suggested that most debris derived from local, land-based sources. Attempts to repeat this survey in 2014 were shelved when initial sampling failed to locate any macro-debris on soft sediments at the sites studied in 1991. Similarly, examination of 421 images of the False Bay seabed taken to classify benthic communities failed to detect any debris items (FitzPatrick Institute unpublished data). However, occasional upwelling of dense debris onto False Bay beaches43 indicates a substantial pool of seabed debris somewhere in the Bay.
In deeper waters of the continental shelf, very little debris is seen in video footage of the seabed (Sink K, SANBI, personal communication). Systematic collection of debris caught in hake (Merluccius spp.) stock assessment trawls (which use a finer mesh than commercial trawls at a large number of randomly selected sites) offers a pragmatic tool to monitor changes in macro-debris on the seabed in the region, although capture rates are low and sampling is limited to soft bottoms.30 ROV footage is needed to establish a baseline for debris in deep-water canyons where seabed debris tends to accumulate.44,45
Even less is known about microplastics in seabed sediments around South Africa. The only published data on subtidal microplastics are from a single core collected at a polluted site in Durban Bay.46 Sediment cores can be used to track changes in plastic density over time. For example, the density of microplastics (>300 μm) in the Durban core was four times higher at 2.5-5 cm deep (~1750 particles/kg dry mass) than at 20-22.5 cm deep (~400 particles/kg dry mass).46 At more remote sites, microplastics were found at relatively low densities (<5 microfibres per 50 mL sediment) in all three sediment grabs collected from seamounts south of Madagascar.40 Further samples are needed of especially deep-sea sediments to establish a baseline against which future changes in the region can be monitored (Table 1).
Beach debris
Plastic stranded on beaches provides the easiest way to assess marine plastics.4,5 We have a fairly good understanding of the abundance and composition of beach debris around the South African coast, with information on macroplastics and larger microplastics (mesoplastics) dating back to the 1980s.47,48 A consistent pattern found in all these surveys has been for higher densities of plastic debris close to urban centres,40,48 suggesting that most debris derives from local, land-based sources. More recently, surveys of smaller microplastics (mainly microfibres) also report a strong correlation with local urban source areas.49
Interpreting standing stock data
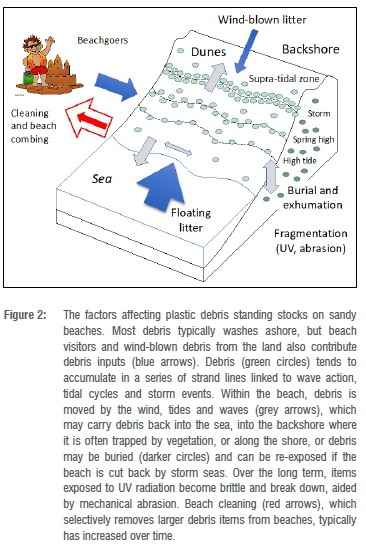
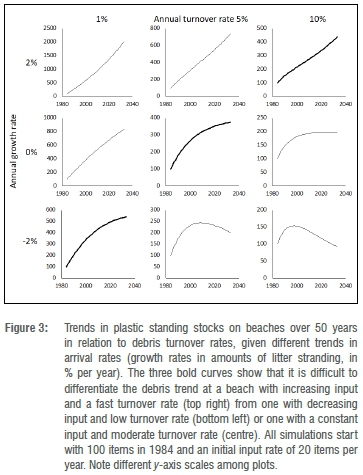
Beach debris surveys can be divided into two distinct types: those that sample debris standing stocks and those that measure debris accumulation.4,10 Both provide useful information on the abundance and distribution of marine plastics, but interpreting changes in standing stocks over time requires a thorough understanding of beach debris dynamics. The amount of debris on a beach is influenced by numerous interacting factors (Figure 2), some of which are episodic (e.g. storm-driven undercutting events). Even if we assume these dynamics are fairly constant, little is known about the turnover rate of debris on South African beaches, and this rate plays a key role in determining long-term trends in standing stocks. For example, a modest increase in standing stocks over 50 years could result from an increase in debris washing ashore, no change or even a decrease in the amount washing ashore, depending on the beach debris turnover rate (Figure 2). To add to the complexity, turnover rates differ between debris types.50 For example, lightweight items such as expanded polystyrene turn over more quickly than items less prone to being blown off the beach.51 Similarly, small items are buried more rapidly than larger items and are thus 'lost' from traditional beach surveys that only sample superficial debris.
However, the biggest challenge to interpreting standing stock data for macro-debris on beaches is the systematic change in beach cleaning effort that has occurred over the last 50 years. Beach cleaning effort increased exponentially in South Africa up to 199552, and has continued to increase since then thanks to initiatives such as the government-sponsored 'Working for the Coast' Programme53. As a result, turnover rates for macro-debris items have changed dramatically over time, confounding attempts to infer changes in debris loads at sea based on beach standing stocks. Such cleaning tends to focus mainly on larger debris items, and thus we see different trajectories in the abundance of large and small debris items recorded during 5-yearly standing stock surveys at South African beaches.4
Accumulation surveys
If the goal is to assess changes in the amount of debris at sea, accumulation studies obviate many of the challenges posed by standing stock beach surveys because they estimate the rate of debris arriving at a beach. This requires thoroughly cleaning a section of beach, and then checking the amount of debris arriving over a known period. In most studies to date, sampling has been repeated every 1-3 months54,55, but can be as seldom as once a year56. Such infrequent samples underestimate the actual amount of debris washing ashore, especially for items that turn over rapidly.51 The magnitude of this effect depends on the frequency of sampling as well as on beach type and local conditions. For example, at two beaches near Cape Town, daily sampling collected 2-5 times more debris by number and 1.3-2.3 times more by mass than weekly sampling.51 And in the sub-Antarctic, daily sampling collected 10 times more debris than monthly sampling.57 This is not a problem for monitoring as long as conditions affecting debris turnover rates are more or less constant, and the sampling interval remains the same. However, there are two significant challenges to accumulation studies: one is exhumation of buried debris, and the other is the need to limit beach cleaning. Buried debris can be exposed by beach goers, fossorial animals (e.g. dune mole rats, Bathyergus spp.) or by storm seas, which inflates estimates of stranding debris. By comparison, beach cleaning deflates estimates of debris stranding rates, and is increasingly difficult to control at open-access beaches due to growing public awareness of the marine debris problem (Figure 2).
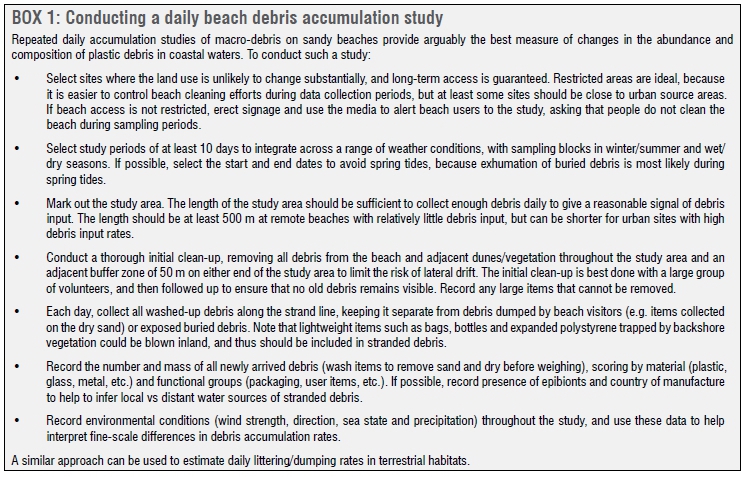
Accumulation surveys could be conducted at remote beaches to assess background debris stranding rates. However, if monitoring is designed to assess changes in local, land-based sources of marine litter and the main goal is to determine the efficacy of mitigation measures to reduce plastic leakage into the environment, surveys should focus on urban beaches (Table 1 ).39,47 Unfortunately, it is difficult to prevent informal cleaning at such beaches, particularly over a period of weeks or months. As a result, daily accumulation studies were initiated at two beaches in Table Bay in 1994/1995: one urban beach and one more remote beach.58 A 500-m stretch of beach was cleaned at each site, and then checked daily for newly arriving debris, for several 10-14-day periods (Box 1). The study was repeated in 2012, but the area sampled at the urban beach was reduced to 250 m due to the marked increase in the amount of debris washing ashore.59 The results show a consistent difference between the two beaches, with 13 times more debris washing ashore at Milnerton (6 km from central Cape Town, and close to the mouths of the Riet and Black Rivers) than at Koeberg (30 km from central Cape Town). The number of debris items increased three-fold over the 18-year period between surveys, greatly exceeding human population growth in Cape Town over the same period (~50%). However, the increase in the mass of debris was more modest, due to a decrease in the average mass per debris item (driven in part by increased packaging of foodstuffs, such as the introduction of individual sweet wrappers, sports drinks with caps on their lids, etc.). Shorter accumulation studies recently have been completed at other Cape beaches60 and similar studies have been initiated as part of an integrated marine debris monitoring programme throughout the western Indian Ocean region61.
Accumulation studies are much harder to perform for microplastics, because it is virtually impossible to clean a beach prior to the start of an accumulation study, or to remove all newly arrived microplastics. Perhaps the only practical option is to monitor the arrival rate of larger microplastic items on successive tidal cycles (i.e. record numbers stranding on fresh swash lines on each tidal cycle,62 although it is hard to ensure that items are not being recirculated within the beach system). Regular surveys of standing stocks of larger microplastics at 50 South African beaches monitored every 5 years since 1989 show no consistent temporal trend, presumably because beaches differ in turnover rates. User plastics have increased at 12 beaches, decreased at 9 beaches, and show no strong trend at 29 beaches (FitzPatrick Institute unpublished data). By comparison, industrial pellets have decreased at 29 beaches, remained constant at 19 beaches, and increased at only 2 beaches. This difference reflects the apparent decrease in pellets at sea (see above). Both beaches where pellets continue to increase fall within predicted accumulation zones for local-source microplastics63 and at least one appears to be a long-term sink (i.e. it has a very low turnover rate, cf. Figure 3), with many of the pellets likely having been there for decades. Turnover rates can be estimated for the largest microplastics using marked debris items,64 but this seldom has been attempted and the accuracy of such estimates is uncertain (especially given the challenges posed by microplastic burial). As a result, we do not recommend routine monitoring of microplastics on beaches.
Bioindicators: Interactions with biota
Monitoring plastic interactions with biota can be a valuable approach, particularly if the interactions integrate exposure to plastics over space and time (e.g. plastic ingestion by species that tend to retain ingested plastic for protracted periods).65 Parameters that can be monitored include the proportions of biota that contain ingested plastic, that are entangled in marine debris, or use plastic items for construction material or shelter (e.g. seabird nests, hermit crabs, tube-building annelids, echinoderms). It is also feasible to track levels of contaminants associated with plastic ingestion, which can have direct relevance for human health.5,66 One of the challenges of monitoring through biota is the wide range of potential interactions.
Plastic ingestion
Globally, the incidence of plastic ingestion among marine top predators, and the size of ingested plastic loads, generally increased from the 1960s to the 1980s, but there has been relatively little change since then.65,67 In South Africa, plastic ingestion was first recorded among turtles in the late 1960s, when 12% of stranded post-hatchling loggerhead turtles (Caretta caretta) contained ingested plastic; this figure increased to 60% by 2015.17 However, there was little change in the amount of plastic in procellariiform seabirds from the 1980s to 2000s,16,68 and this pattern has largely continued to date (FitzPatrick Institute unpublished data). Similarly, there was no increase in the incidence of plastic ingestion by sharks killed in shark nets off the KwaZulu-Natal coast between 1978 and 2000.69
Routine sampling of ingested plastic in seabirds in Europe has led to an Ecological Quality Objective target of less than 10% of northern fulmars (Fulmarus glacialis) containing more than 0.1 g of ingested plastic.18 Similarly, loggerhead turtles have been chosen as an indicator of ingested pollution in the Mediterranean70, although there is the added complication of changes in the size and type of plastic eaten by turtles as they grow62. Unfortunately, monitoring of plastic ingestion in these taxa typically requires dissecting the animal to examine the gut contents, because non-lethal sampling approaches fail to recover all ingested plastics71 or have serious side effects72. Ethical concerns prevent killing these animals for such research, and so monitoring therefore relies on opportunistic sampling from animals found dead (e.g. strandings) or killed accidentally (e.g. in fishing gear or shark nets). Undertaking regular patrols along the South African coast could provide ingestion and entanglement data for a range of seabirds, turtles and marine mammals. However, caution is needed when extrapolating ingestion data from stranded animals to the entire population, because stranded individuals might have a greater propensity to ingest plastic immediately prior to death68, which may possibly even contribute to the cause of death73, although it is very hard to tell whether stranded seabirds die as a result of plastic ingestion74. Another approach for seabirds is to score the plastic in regurgitations of brown skuas (Stercorarius antarcticus) that prey on petrels, which allows large numbers of petrels to be sampled with minimal human impact.16 Unfortunately, this is most feasible at islands where petrels dominate the diets of skuas (e.g. Prince Edward Island, Inaccessible Island), and these islands are seldom visited.
Fish offer an easier means to monitor plastic ingestion because there are fewer restrictions on their collection, and it is possible to sample from commercial fish catches. Data on plastic ingestion by bony fish off South Africa have only been collected in the last few years.75,76 Most mullet (Mugil cephalus) sampled in Durban Harbour in 2014 contained plastics, although half of these items were fibres and their synthetic nature was not confirmed.75 Fibres also were found in most small pelagic fish of five species examined from the Benguela upwelling region, but only two hard plastic fragments were found in the 125 fish examined76 - a much lower proportion than in mullet from the more polluted Durban Harbour. Any monitoring programme designed to track changes in ingested plastic loads thus needs to be cognisant of regional and local differences in ingestion.77 Ingested plastic loads also differ in relation to feeding method, habitat, diet and age, given indeterminate growth in fish.65
Internationally, there has been a call to use mussels as bioindicators of microplastic pollution.78 Mussels have been used to monitor other types of marine pollution since the 1970s79 and are widely distributed, easy to collect, play an important role in the ecology of intertidal and shallow-subtidal habitats, and are often eaten by people. Mussels also have been the subject of numerous studies of plastic ingestion, and can reflect local differences in microplastic densities.78 However, there are several challenges to using mussels in this regard, and standardised protocols are required to select mussels, extract and identify microplastics, and limit contamination, before monitoring can commence.78 It is critical to fully understand the turnover rate of ingested plastics of different sizes/ types in relation to mussel size and feeding conditions.65
Entanglement and other plastic interactions
Entanglement affects a wide range of marine organisms, including sessile species such as corals.5 Changes in the proportion of entangled individuals within populations can indicate changes in the abundance of the items responsible for entanglement4, even though entanglement is generally less frequent than ingestion80. For example, entanglement of dusky sharks (Carcharhinus obscurus) off the KwaZulu-Natal coast increased between 1978 and 2000, with over 1% of individuals entangled in the last 3 years of the study, but there was no increase in the proportion of other sharks entangled over this period.69 There are baseline data on entanglement rates of Cape fur seals {Arctocephalus pusillus) from the 1970s81, against which more recent data can be compared, although such comparisons need to be made at the same colonies, and consider the possible effects of changes in population size on entanglement rates82. Similar data exist for seals breeding at Marion Island.83
Tracking the amount of debris that seabirds incorporate in their nests provides another measure of change in the abundance of marine plastics.84 However, the incidence depends not only on the abundance of plastics in the vicinity of each colony, but also the availability of other nest materials.85 The occurrence of plastic in a suite of seabird species' nests was recorded at various colonies during the 1990s and early 2000s (Department of Environment, Forestry and Fisheries, personal communication), and these surveys are now being repeated. Spatial and temporal changes in microplastics might also be monitored by measuring their incorporation into polychaete worm tubes.86
Finally, it is feasible to monitor plastic-associated compounds in biota (e.g. brominated flame retardants, UV stabilisers), which is particularly relevant given concerns about the impact of these compounds on marine organisms and humans who consume seafood.66 This is perhaps best done among top predators, which could accumulate toxins through biomagnification. Analysis of preen gland oil from seabirds that regularly ingest plastics is a non-destructive way of monitoring such compounds87, but they are easier to assay in fat tissue from dead birds (e.g. those killed accidentally by fisheries) which provide larger samples with less risk of contamination88. It may also be possible to analyse such compounds in the serum or organs of fish.89,90 Assays of plastic-associated compounds should be conducted in conjunction with other contaminants (e.g. heavy metals) as they may have synergistic impacts on biota.91 However, such assays are analytically complex, especially at the very low concentrations typical of most plastic-associated compounds.
Uncertainties, evidence gaps and implications for monitoring
The goal of this review series was to identify key uncertainties and evidence gaps needed to inform policy- and decision-making on marine plastics, and, particularly, the implications of not plugging those knowledge gaps. In South Africa, we have a long history of studying marine plastics, and we already know enough about their impacts on marine systems to justify implementing policies to reduce the leakage of waste plastic into the environment. As a result, the most important monitoring goal should be to assess the efficacy of these mitigation measures. Because most leakage occurs as macroplastics, monitoring should focus on this size class of debris. Monitoring should estimate flows of materials rather than standing stocks, because we lack sufficient understanding of turnover rates in any environmental compartment to interpret changes in input rates from standing stock assessments. Sampling at sea or on beaches is not the most direct way to monitor leakage from either land-based or ship-based sources, and thus is subject to greater uncertainty regarding the link between action and response. Monitoring the efficacy of mitigation measures ideally should occur as close to the leakage as possible.
Most plastic inputs into the sea come from land-based sources, which can be assessed by monitoring debris in rivers, storm-water drains and effluent from waste-water treatment plants. However, water-borne inputs of at least macro-debris tend to be episodic, linked to rainfall events, with little or no leakage occurring during dry spells. With rainfall predicted to become increasingly variable throughout South Africa, monitoring plastics in run-off will be increasingly challenging. A better approach might be to monitor plastic flux on land (through fine-scale accumulation studies similar to daily beach debris surveys) as an index of land-based leakage. For plastics dumped illegally from ships, the best approach probably is to ensure compliance with regulations through monitoring the use of port reception facilities for waste from ships.92 However, such monitoring needs to be conducted and coordinated at an international level, because many vessels operating in and around South African waters do not call in South African ports.
Finally, there is benefit to monitoring plastic in marine environments by taking advantage of existing surveys (e.g. annual fish stock assessments) and continuing existing long-term studies (e.g. beach litter surveys) if they are cheap to conduct and can serve other useful purposes (e.g. student training). Monitoring interactions with biota (e.g. debris in seabird nests and plastic ingestion in selected taxa) also may form a useful and cost-effective adjunct to track ecological impacts in the region.
Acknowledgements
We acknowledge the funding support for the preparation of this review paper from the South African Department of Science and Innovation (DSI), through the Waste RDI Roadmap, managed by the Council for Scientific and Industrial Research (CSIR). Subsidiary funding was provided under the umbrella of the Commonwealth Litter Programme (CLiP) implemented by the Centre for Environment, Fisheries and Aquaculture Science (Cefas), funded by the United Kingdom Government's Department for Environment, Food and Rural Affairs (Defra). We thank our many collaborators for assistance in the field, especially Eleanor Weideman.
Trishan Naidoo and David Glassom kindly shared the raw data from their manta trawl samples. Thomas Maes, Eleanor Weideman and Linda Godfrey provided useful comments on an earlier draft.
Authors' contributions
PG.R., V.P and C.L.M. contributed unpublished data; PG.R. wrote the first draft; all authors commented on the draft.
References
1. Coe JM, Rogers DB, editors. Marine debris: Sources, impacts, and solutions. New York: Springer-Verlag; 1997. https://doi.org/10.1007/978-1-4613-8486-1 [ Links ]
2. Ryan PG. A brief history of marine litter research. In: Bergmann M, Gutow L, Klages M, editors. Marine anthropogenic litter. Cham: Springer International Publishing: 2015. p. 1-25. https://doi.org/10.1007/978-3-319-16510-3_1 [ Links ]
3. Goldsmith FB, editor. Monitoring for conservation and ecology. London: Chapman and Hall; 1991. https://doi.org/10.1007/978-94-011-3086-8 [ Links ]
4. Ryan PG, Moore CJ, Van Franeker JA, Moloney CL. Monitoring the abundance of plastic debris in the marine environment. Phil Trans R Soc B. 2009;364:1999-2012. https://doi.org/10.1098/rstb.2008.0207 [ Links ]
5. Kershaw PJ, Turra A, Galgani F, editors. IMO/FAO/UNESCO-IOC/UNIDO/WMO/ IAEA/UN/UNEP/UNDP/ISA Joint Group of Experts on the Scientific Aspects of Marine Environmental Protection (GESAMP). Guidelines for the monitoring and assessment of plastic litter and microplastics in the ocean. Report Study 99. Nairobi: United Nations Environment Programme; 2019. [ Links ]
6. Naidoo T, Rajkaran A, Sershen. Impacts of plastic debris on biota and implications for human health: A South African perspective. S Afr J Sci. 2020;116(5/6), Art. #7693, 8 pages. https://doi.org/10.17159/sajs.2020/7693 [ Links ]
7. Arabi S, Nahman A. Impacts of marine plastic on ecosystem services and economy: State of South African research. S Afr J Sci. 2020;116(5/6), Art. #7695, 7 pages. https://doi.org/10.17159/sajs.2020/7695 [ Links ]
8. Lebreton L, Slat B, Ferrari F, Sainte-Rose B, Aitken J, Marthouse R, et al. Evidence that the Great Pacific Garbage Patch is rapidly expanding. Sci Rep. 2018;8, Art. #4666, 15 pages. https://doi.org/10.1038/s41598-018-22939-w [ Links ]
9. Ryan PG, Dilley BJ, Ronconi RA, Connan M. Rapid increase in Asian bottles in the South Atlantic Ocean indicates major debris inputs from ships. Proc Natl Acad Sci USA. 2019;116:20892-20897. https://doi.org/10.1073/pnas.1909816116 [ Links ]
10. Escardó-Boomsma J, O'Hara K, Ribic CA. National Marine Debris Monitoring Program. Vol. 1-2. Washington,DC: US EPA Office of Water, 1995. [ Links ]
11. Ribic CA, Ganio LM. Power analysis for beach surveys of marine debris. Mar Pollut Bull. 1996;32:554-557. https://doi.org/10.1016/0025-326X(96)84575-9 [ Links ]
12. Primpke S, Lorenz C, Rascher-Friesenhausen R, Gerdts G. An automated approach for microplastics analysis using focal plane array (FPA) FTIR microscopy and image analysis. Anal Methods. 2017;9:1499-1511. https://doi.org/10.1039/C6AY02476A [ Links ]
13. Ryan PG. The characteristics and distribution of plastic particles at the sea-surface off the southwestern Cape Province, South Africa. Mar Environ Res. 1988;25:249-273. https://doi.org/10.1016/0141-1136(88)90015-3 [ Links ]
14. Morris RJ. Plastic debris in the surface waters of the South Atlantic. Mar Pollut Bull. 1980;11:164-166. https://doi.org/10.1016/0025-326X(80)90144-7 [ Links ]
15. Naidoo T, Glassom D. Sea-surface microplastic concentrations along the coastal shelf of KwaZulu-Natal, South Africa. Mar Pollut Bull. 2019;149:110514. https://doi.org/10.1016/j.marpolbul.2019.110514 [ Links ]
16. Geyer R, Jambeck JR, Law KL. Production, use, and fate of all plastics ever made. Sci Adv 2017;3, e1700782, 5 pages. https://doi.org/10.1126/sciadv.1700782 [ Links ]
17. Ryan PG. Seabirds indicate decreases in plastic pellet litter in the Atlantic and south-western Indian Ocean. Mar Pollut Bull. 2008;56:1406-1409. https://doi.org/10.1016/j.marpolbul.2008.05.004 [ Links ]
18. Ryan PG, Cole G, Spiby K, Nel R, Osborne A, Perold V. Impacts of plastic ingestion on post-hatchling loggerhead turtles off South Africa. Mar Pollut Bull. 2016;107:155-160. https://doi.org/10.1016/j.marpolbul.2016.04.005 [ Links ]
19. Van Franeker JA, Law KL. Seabirds, gyres and global trends in plastic pollution. Environ Pollut. 2015;203:89-96. https://doi.org/10.1016/j.envpol.2015.02.034 [ Links ]
20. Maximenko N, Corradi P Law KL, Van Sebille E, Garaba SP Lampitt RS, et al. Toward the Integrated Marine Debris Observing System. Front Mar Sci. 2019;6, Art.#447, 25 pages. https://doi.org/10.3389/fmars.2019.00447 [ Links ]
21. Ryan PG. Does size and buoyancy affect the long-distance transport of floating debris? Environ Res Lett. 2015;10:084019. https://doi.org/10.1088/1748-9326/10/8/084019 [ Links ]
22. Reisser J, Slat B, Noble K, Du Plessis K, Epp M, Proieti M, et al. The vertical distribution of buoyant plastics at sea: An observational study in the North Atlantic Gyre. Biogeosciences. 2015;12:1249-1256. https://doi.org/10.5194/bgd-11-16207-2014 [ Links ]
23. Fazey FMC, Ryan PG. Biofouling on buoyant marine plastics: An experimental study into the effect of size on surface longevity. Environ Pollut. 2016;210:354-360. https://doi.org/10.1016/j.envpol.2016.01.026 [ Links ]
24. Barrows APW, Cathey SE, Petersen CW. Marine environment microfiber contamination: Global patterns and the diversity of microparticle origins. Environ Pollut. 2018;237:275-284. https://doi.org/10.1016/j.envpol.2018.02.062 [ Links ]
25. Ryan PG, Suaria G, Perold V Pierucci A, Bornman TG, Aliani S. Sampling microfibres at the sea surface: The effects of mesh size, sample volume and water depth. Environ Pollut. 2019;258:113413. https://doi.org/10.1016/j.envpol.2019.113413 [ Links ]
26. Li K, Zhang F, Song Z, Zong C, Wei N, Li D. A novel method enabling the accurate quantification of microplastics in the water column of deep ocean. Mar Pollut Bull. 2019;146:462-165. https://doi.org/10.1016/j.marpolbul.2019.07.008 [ Links ]
27. Zobkov MB, Esiukova EE, Zyubin AY, Samusev IG. Microplastic content variation in water column: The observations employing a novel sampling tool in stratified Baltic Sea. Mar Pollut Bull. 2019;138:193-205. https://doi.org/10.1016/j.marpolbul.2018.11.047 [ Links ]
28. Gr0svik BE, Prokhorova T, Eriksen E, Krivosheya P Homeland PA, Prozorkevich D. Assessment of marine litter in the Barents Sea, a part of the joint Norwegian-Russian Ecosystem Survey. Front Mar Sci. 2018;5:72. https://doi.org/10.3389/fmars.2018.00072 [ Links ]
29. Fazey FMC, Ryan PG. Debris size and buoyancy influence the dispersal distance of stranded litter. Mar Pollut Bull. 2016;110:371-377. https://doi.org/10.1016/j.marpolbul.2016.06.039 [ Links ]
30. Ryan PG, Weideman EA, Perold V Durholz D, Fairweather TP. A trawl survey of seabed macrolitter on the South African continental shelf. Mar Pollut Bull. 2020;150, Art.#110741, 6 pages. https://doi.10.1016/j.marpolbul.2019.110741 [ Links ]
31. Kooi M, Van Nes E, Scheffer M, Koelmans A. Ups and downs in the ocean: Effects of biofouling on vertical transport of microplastics. Environ Sci Technol. 2017;51:7963-7971. https://doi.org/10.1021/acs.est.6b04702 [ Links ]
32. Thompson RC, Olsen Y Mitchell RP Davis A, Rowland SJ, John AWG, et al. Lost at sea: where is all the plastic? Science. 2004;304:838. https://doi.org/10.1126/science.1094559 [ Links ]
33. Stanton T, Johnson M, Nathanail P MacNaughtan W, Gomes RL. Freshwater and airborne textile fibre populations are dominated by 'natural', not microplastic, fibres. Sci Total Environ. 2019;666:377-389. https://doi.org/10.1016/j.scitotenv.2019.02.278 [ Links ]
34. Suaria G, Achtypi A, Perold V Lee JR, Pierucci A, Bornman T, et al. A global characterization of textile fibers in the open ocean surface layers. Sci Adv. In press; 2020. [ Links ]
35. Sono S, Moloney CL, Van der Lingen CD. Assessing the utility of a continuous, underway fish egg sampler (CUFES) for sampling zooplankton. Afr J Mar Sci. 2009;31:181-189. https://doi.org/10.2989/AJMS.2009.31.2.6.878 [ Links ]
36. Pitois SG, Bouch P Creach V Van der Kooij J. Comparison of zooplankton data collected by a continuous semi-automatic sampler (CALPS) and a traditional vertical ring net. J Plankton Res. 2016;38:931-943. https://doi.org/10.1093/plankt/fbw044 [ Links ]
37. Ryan PG. A simple technique for counting marine debris at sea reveals steep litter gradients between the Straits of Malacca and the Bay of Bengal. Mar Pollut Bull. 2013;69:128-136. https://doi.org/10.1016/j.marpolbul.2013.01.016 [ Links ]
38. Galgani F, Souplet A, Cadiou Y Accumulation of debris on the deep sea floor off the French Mediterranean coast. Mar Ecol Prog Ser. 1996;142:225-234. https://doi.org/10.3354/meps142225 [ Links ]
39. Woodall LC, Sanchez-Vidal A, Canals M, Paterson GLJ, Coppock R, Sleight V et al. The deep sea is a major sink for microplastic debris. R Soc Open Sci. 2014;1:140317. https://doi.org/10.1098/rsos.140317 [ Links ]
40. Ryan PG. The transport and fate of marine plastics in South Africa and adjacent oceans. S Afr J Sci. 2020;116(5/6), Art. #7677, 9 pages. https://doi.org/10.17159/sajs.2020/7677 [ Links ]
41. Smith SDA, Edgar RJ. Documenting the density of subtidal marine debris across multiple marine and coastal habitats. PLoS ONE. 2014;9(4), e94593. https://doi.org/10.1371/journal.pone.0094593 [ Links ]
42. Rundgren CD. Aspects of pollution in False Bay, South Africa (with special reference to subtidal pollution) [MSc thesis]. Cape Town: University of Cape Town; 1992. http://hdl.handle.net/11427/18330 [ Links ]
43. Pfaff MC, Logston RC, Raemaekers SJPN, Hermes JC, Blamey LK, Cawthra HC, et al. A synthesis of three decades of socio-ecological change in False Bay, South Africa: Setting the scene for multidisciplinary research and management. Elementa Sci Anthrop. 2019;7, Art.#32, 49 pages. https://doi.org/10.1525/elementa.367 [ Links ]
44. Schlining K, Thun S, Kuhnz L, Schlining B, Lundsten L, Stout NJ, et al. Debris in the deep: Using a 22-year video annotation database to survey marine litter in Monterey Canyon, central California, USA. Deep-Sea Res. II 2013;79:96-105. https://doi.org/10.1016/j.dsr.2013.05.006 [ Links ]
45. Peng X, Dasgupta S, Zhong G, Du M, Xu H, Chen M, et al. Large debris dumps in the northern South China Sea. Mar Pollut Bull. 2019;142:164-168. https://doi.org/10.1016/j.marpolbul.2019.03.041 [ Links ]
46. Matsuguma Y Takada H, Kumata H, Kanke H, Sakurai S, Suzuki T, et al. Microplastics in sediment cores from Asia and Africa as indicators of temporal trends in plastic pollution. Arch Environ Contam Toxicol. 2017;73:230-239. https://doi.org/10.1007/s00244-017-0414-9 [ Links ]
47. Ryan PG, Moloney CL. Plastic and other artefacts on South African beaches: Temporal trends in abundance and composition. S Afr J Sci. 1990;86:450-452. [ Links ]
48. Ryan PG, Perold V, Osborne A, Moloney CL. Consistent patterns of debris on South African beaches indicate that industrial pellets and other mesoplastic items mostly derive from local sources. Environ Pollut. 2018;238:1008-1016. https://doi.org/10.1016/j.envpol.2018.02.017 [ Links ]
49. De Villiers S. Quantification of microfibre levels in South Africa's beach sediments, and evaluation of spatial and temporal variability from 2016 to 2017. Mar Pollut Bull. 2018;135:481-489. https://doi.org/10.1016/j.marpolbul.2018.07.058 [ Links ]
50. Dixon TR, Cooke AJ. Discarded containers on a Kent Beach. Mar Pollut Bull. 1977;8:105-109. https://doi.org/10.1016/0025-326X(77)90132-1 [ Links ]
51. Ryan PG, Lamprecht A, Swanepoel D, Moloney CL. The effect of fine-scale sampling frequency on estimates of beach litter accumulation. Mar Pollut Bull 2014;88:249-254. https://doi.org/10.1016/j.marpolbul.2014.08.036 [ Links ]
52. Ryan PG, Swanepoel D. Cleaning beaches: Sweeping litter under the carpet. S Afr J Sci. 1996;92:275-276. [ Links ]
53. Glovovic BC, Boonzaaier S. Confronting coastal poverty: Building sustainable coastal livelihoods in South Africa. Ocean Coastal Managem. 2007;50:1-23. https://doi.org/10.1016/j.ocecoaman.2006.07.001 [ Links ]
54. Ribic CA, Sheavly SB, Rugg DJ, Erdmann ES. Trends and drivers of marine debris on the Atlantic coast of the United States 1997-2007. Mar Pollut Bull. 2010;60:1231-1242. https://doi.org/10.1016/j.marpolbul.2010.03.021 [ Links ]
55. Schulz M, Neumann D, Fleet DM, Matthies M. A multi-criteria evaluation system for marine litter pollution based on statistical analyses of OSPAR beach litter monitoring time series. Mar Environ Res. 2013;92:61-70. https://doi.org/10.1016/j.marenvres.2013.08.013 [ Links ]
56. Edyvane KS, Dalgetty A, Hone PW, Higham JS, Wace NM. Long-term marine litter monitoring in the remote Great Australian Bight, South Australia. Mar Pollut Bull. 2004;48:1060-1075. https://doi.org/10.1016/j.marpolbul.2003.12.012 [ Links ]
57. Eriksson C, Burton H, Fitch S, Schulz M. Daily accumulation rates of marine debris on sub-Antarctic island beaches. Mar Pollut Bull. 2013;66:199-208. https://doi.org/10.1016/j.marpolbul.2012.08.026 [ Links ]
58. Swanepoel D. An analysis of beach debris accumulation in Table Bay, South Africa [MSc thesis]. Cape Town: University of Cape Town; 1995. [ Links ]
59. Lamprecht A. The abundance, distribution and accumulation of plastic debris in Table Bay, Cape Town, South Africa [MSc thesis]. Cape Town: University of Cape Town; 2013. [ Links ]
60. Chitaka TY Von Blottnitz H. Accumulation and characteristics of plastic debris along five beaches in Cape Town. Mar Pollut Bull. 2019;138:451-457. https://doi.org/10.1016/j.marpolbul.2018.11.065 [ Links ]
61. Barnardo T, Ribbink AJ, editors. African Marine Litter Monitoring Manual. Port Elizabeth: African Marine Waste Network / Sustainable Seas Trust; 2020. [ Links ]
62. Moreira FT, Prantoni AL, Martini B, De Abreu MA, Stoiev SB, Turra A. Small-scale temporal and spatial variability in the abundance of plastic pellets on sandy beaches: Methodological considerations for estimating the input of microplastics. Mar Pollut Bull. 2016;102:114-121. https://doi.org/10.1016/j.marpolbul.2015.11.051 [ Links ]
63. Collins C, Hermes JC. Modelling the accumulation and transport of floating marine micro-plastics around South Africa. Mar Pollut Bull. 2019;139:46-58. https://doi.org/10.1016/j.marpolbul.2018.12.028 [ Links ]
64. Hinata H, Mori K, Ohno K, Miyao Y Kataoka T. An estimation of the average residence times and onshore-offshore diffusivities of beached microplastics based on the population decay of tagged meso- and macrolitter. Mar Pollut Bull. 2017;122:17-26. https://doi.org/10.1016/j.marpolbul.2017.05.012 [ Links ]
65. Ryan PG. Ingestion of plastics by marine organisms. In: Takada H, Karapanagioti HK, editors. Hazardous chemicals associated with plastics in the environment. The handbook of environmental chemistry. Vol. 78. Cham: Springer; 2016. p. 235-266. https://doi.org/10.1007/698_2016_21 [ Links ]
66. Rochman CM, Browne MA, Underwood AJ, Van Franeker JA, Thompson RC, Amaral-Zettler LA. The ecological impacts of marine debris: Unraveling the demonstrated evidence from what is perceived. Ecology. 2016;97:302-312. https://doi.org/10.1890/14-2070.1 [ Links ]
67. Beer S, Garm A, Huwer B, Dierking J, Nielsen TG. No increase in marine microplastic concentration over the last three decades - A case study from the Baltic Sea. Sci Total Environ. 2018;621:1272-1279. https://doi.org/10.1016/j.scitotenv.2017.10.101 [ Links ]
68. Ryan PG. The incidence and characteristics of plastic particles ingested by seabirds. Mar Environ Res. 1987;23:175-206. https://doi.org/10.1016/0141-1136(87)90028-6 [ Links ]
69. Cliff G, Dudley SFJ, Ryan PG, Singleton N. Large sharks and plastic debris in KwaZulu-Natal, South Africa. Mar Freshw Res. 2002;53:575-581. https://doi.org/10.1071/MF01146 [ Links ]
70. Matiddi M, Hochsheid S, Camedda A, Baini M, Cocumelli C, Serena F, et al. Loggerhead sea turtles (Caretta caretta): A target species for monitoring litter ingested by marine organisms in the Mediterranean Sea. Environ Pollut. 2017;230:199-209. https://doi.org/10.1016/j.envpol.2017.06.054 [ Links ]
71. Ryan PG, Jackson S. Stomach pumping: Is killing seabirds necessary? Auk. 1986;103:427-428. https://doi.org/10.1093/auk/103.2.427 [ Links ]
72. Bond AL, Lavers JL. Effectiveness of emetics to study plastic ingestion by Leach's Storm-petrels (Oceanodroma leucorhoa). Mar Pollut Bull. 2013;70:171-175. https://doi.org/10.1016/j.marpolbul.2013.02.030 [ Links ]
73. Roman L, Hardesty BD, Hindell MA, Wilcox C. A quantitative analysis linking seabird mortality and marine debris ingestion. Sci Rep. 2019;9:3202. https://doi.org/10.1038/s41598-018-36585-9 [ Links ]
74. Ryan PG, Jackson S. The lifespan of ingested plastic particles in seabirds and their effect on digestive efficiency. Mar Pollut Bull. 1987;18:217-219. https://doi.org/10.1016/0025-326X(87)90461-9 [ Links ]
75. Naidoo T, Smit AJ, Glassom D. Plastic ingestion by estuarine mullet Mugil cephalus (Mugilidae) in an urban harbour, KwaZulu-Natal, South Africa. Afr J Mar Sci. 2016;38:145-149. https://doi.org/10.2989/1814232X.2016.1159616 [ Links ]
76. Ross KJ. Ingestion of microplastics by epipelagic and mesopelagic fish in South African waters: A species comparison [Hons report]. [ Links ] Cape Town: University of Cape Town; 2017. https://bit.ly/2kbWp64
77. Ryan PG, De Bruyn PJN, Bester MN. Regional differences in plastic ingestion among Southern Ocean fur seals and albatrosses. Mar Pollut Bull. 2016;104:207-210. https://doi.org/10.1016/j.marpolbul.2016.01.032 [ Links ]
78. Li J, Lusher AL, Rotchell JM, Deudero S, Turra A, Brate ILN, et al. Using mussel as a global bioindicator of coastal microplastic pollution. Environ Pollut. 2019;244:522-533. https://doi.org/10.1016/j.envpol.2018.10.032 [ Links ]
79. Schöne BR, Krause RA. Retrospective environmental biomonitoring - Mussel Watch expanded. Glob Planet Change. 2016;144:228-251. https://doi.org/10.1016/j.gloplacha.2016.08.002 [ Links ]
80. Ryan PG. Entanglement of birds in plastics and other synthetic materials. Mar Pollut Bull. 2018;135:159-164. https://doi.org/10.1016/j.marpolbul.2018.06.057 [ Links ]
81. Shaughnessy PD. Entanglement of Cape fur seals with man-made objects. Mar Pollut Bull. 1980;11:332-336. https://doi.org/10.1016/0025-326X(80)90052-1 [ Links ]
82. Arnould JPY Croxall JP Trends in entanglement of Antarctic fur seals (firctocephalus gazella) in man-made debris at South Georgia. Mar Pollut Bull. 1995;30:707-712. https://doi.org/10.1016/0025-326X(95)00054-Q [ Links ]
83. Hofmeyr GJG, Bester MN. Entanglement of pinnipeds at Marion Island. S Afr J Mar Sci. 2002;24:383-386. https://doi.org/10.2989/025776102784528295 [ Links ]
84. Hartwig E, Clemens T, Heckroth M. Plastic debris as nesting material in a kittiwake (Rissa tridactyla) colony at the Jammerbugt, northwest Denmark. Mar Pollut Bull. 2007;54:595-597. https://doi.org/10.1016/j.marpolbul.2007.01.027 [ Links ]
85. Witteveen M, Brown M, Ryan PG. Anthropogenic debris in the nests of kelp gulls in South Africa. Mar Pollut Bull. 2017;114:699-704. https://doi.org/10.1016/j.marpolbul.2016.10.052 [ Links ]
86. Nel HA, Froneman PW. Presence of microplastics in the tube structure of the reef-building polychaete Gunnarea gaimardi (Quatrefages 1848). Afr J Mar Sci. 2018;40:87-89. https://doi.org/10.2989/1814232X.2018.1443835 [ Links ]
87. Hardesty BD, Holdsworth D, Revill AT, Wilcox C. A biochemical approach for identifying plastics exposure in live wildlife. Meth Ecol Evol. 2015;6:92-98. https://doi.org/10.1111/2041-210X.12277 [ Links ]
88. Tanaka K, Takada H, Yamashita R, Mizukawa K, Fukuwaka MA, Watanuki Y Accumulation of plastic-derived chemicals in tissues of seabirds ingesting marine plastics. Mar Pollut Bull. 2013;69:219-222. https://doi.org/10.1016/j.marpolbul.2012.12.010 [ Links ]
89. Wardrop P Shimeta J, Nugegoda D, Morrison PD, Miranda A, Tang M, et al. Chemical pollutants sorbed to ingested microbeads from personal care products accumulate in fish. Env Sci Tech. 2016;50:4037-4044. https://doi.org/10.1021/acs.est.5b06280 [ Links ]
90. Makinwa T, Uaadia P Occurrence of bisphenol A (BPA) in ponds, rivers and lagoons in south-western Nigeria and uptake in cat fish - evidence of environmental contamination. Food Publ Health. 2017;7:1-6. https://doi.org/10.5923/j.fph.20170701.01 [ Links ]
91. Jinhui S, Sudong X, Yan N, Xia P Jiahao Q, Yongjian X. Effects of microplastics and attached heavy metals on growth, immunity, and heavy metal accumulation in the yellow seahorse, Hippocampus kuda Bleeker. Mar Pollut Bull. 2019;149:110510. https://doi.org/10.1016/j.marpolbul.2019.110510 [ Links ]
92. Carpenter A, Macgill SM. The EU Directive on port reception facilities for ship-generated waste and cargo residues: The results of a second survey on the provision and uptake of facilities in North Sea ports. Mar Pollut Bull. 2005;50:1541-1547. https://doi.org/10.1016/j.marpolbul.2005.06.021 [ Links ]
 Correspondence:
Peter Ryan
peter.ryan@uct.ac.za
Received: 27 Nov. 2019
Revised: 26 Feb. 2020
Accepted: 18 Mar. 2020
Published: 27 May 2020
Editors: Jane Carruthers, Linda Godfrey
Funding: Waste RDI Roadmap, Council for Scientific and Industrial Research, Department of Science and Innovation (South Africa); Commonwealth Litter Programme, Centre for Environment, Fisheries and Aquaculture Science, Department for Environment, Food and Rural Affairs (UK)
Supplementary Data
The supplementary data is available in pdf:[Supplementary Data]

