


Serviços Personalizados
Artigo
 Inglês (pdf)
 Artigo em XML
 Referências do artigo
Indicadores

Links relacionados
-
 Citado por Google
 -
 Similares em Google
Compartilhar

 Permalink
South African Journal of Science
versão On-line ISSN 1996-7489
versão impressa ISSN 0038-2353
S. Afr. j. sci. vol.116 no.5-6 Pretoria Mai./Jun. 2020
http://dx.doi.org/10.17159/sajs.2020/7700
MARINE PLASTIC DEBRIS: REVIEW ARTICLE
Land-based sources and pathways of marine plastics in a South African context
Carina Verster; Hindrik Bouwman
Unit for Environmental Sciences and Management, North-West University, Potchefstroom, South Africa
ABSTRACT
We review and evaluate the major land-based sources and pathways of plastic waste that lead to marine pollution in a South African context. Many of the formal solid waste and waste-water management facilities in South Africa are not fully functional, contributing towards plastic releases to the environment. Much plastic also enters the environment directly by informal and illegal dumping. Once in the environment, plastic is transported and distributed by air, inland waterways and human activity, with complex dynamics that are not fully understood. Depending on the size and type of plastic and environmental factors like wind action and run-off, plastic can be deposited into sinks such as soil, river sediments and vegetation, or carried to the ocean. Contrary to an initial assumption that South Africa is the 11th worst contributor to marine plastic pollution, we estimate from more accurate and recent data that between 15 000 and 40 000 tonnes per year is carried to the oceans. This amount is six-fold less than a previous estimate. Despite many data and information gaps that require urgent attention through research and monitoring, it is clear that the status quo will lead to a worsening of already severe plastic pollution of all environments. South Africa needs to reduce plastic entering the environment by reducing illegal and informal dumping, effectively implementing and improving waste management infrastructure, and intensifying long-term awareness campaigns. Most importantly, however, immediate and effective mitigation is required.
SIGNIFICANCE:
• More accurate and recent data show that between 15 000 and 40 000 tonnes of plastic is carried to the oceans from South Africa per year - six-fold less than the widely used previous estimate.
• Riverine sediments are potentially major sinks for plastic en route to the ocean.
• Management of treated waste-water sludge, as well as the state of waste-water treatment plants (WWTPs) are key concerns. WWTPs are reported to remove most plastic from the water content. The state of South African WWTPs have deteriorated to such an extent that up to 40% of the country's waste water is untreated and data and management practices of sludge are unavailable.
• There are major data gaps in the South African waste sector, which lead to miscalculations and uncertainties about the country's contribution to marine plastic debris.
Keywords: microplastic, waste management, socio-economics, industry, transport
Introduction
Marine plastic debris is a global concern that needs urgent attention and mitigation.1 Although numerical estimates differ2, the majority of plastic reaching the marine environment comes from land-based sources. Li et al.3 estimate that up to 80% of marine plastic debris is from land-based sources3, but this estimate is largely based on data from the Caribbean islands and the proportions of land-based to sea-based sources show great regional variation4. Land-based plastic debris enters the marine environment mainly as formal, informal and illegal debris, carried by rivers, waste- and storm-water outlets, or is blown directly into the oceans by wind.5 Recently, microplastic has also been found in air6,7 - a finding that expands our knowledge of plastic mobility and long-range distribution. Although most literature on plastic pollution remains marine based, more attention is being given to riverine research as rivers act as a major transport pathway of plastics to the oceans.8-13 Rivers play a role in the transformation of plastic into smaller pieces through abrasion, chemical, biological or UV degradation.14 Freshwater sediments also act as sinks for plastic that may become secondary sources during floods or high-flow conditions.
Generally, one can distinguish three major categories of plastics found in the environment. Large plastic items, arbitrarily termed macroplastics (>5 mm in longest dimension) are items such as packaging, foams, plastic bags and ear bud stems. Large debris breaks down through a myriad of processes into smaller pieces called microplastics (<5 mm in longest dimension). Fibres released from fabrics (often from washing of clothes) are also considered microplastics due to their size. Not only do macroplastics cause direct harm to larger animals through ingestion, suffocation and entanglement15, but microplastics cause similar problems to smaller animals.
Many plastics are manufactured as complex mixtures of chemicals. Plastics can also take up additional chemicals from the environment such as persistent organic pollutants and metals such as mercury. The incorporated and accumulated chemicals could be transferred to terrestrial, freshwater and marine organisms that have taken them up through ingestion or assimilation, posing a threat to human, biotic and ecosystem health.16,17
Here, in a South African context, we consider the land-based sources of macro- and microplastics. We discuss the sources of plastic that can become marine plastic, its distribution mechanisms, and how plastics eventually reach the oceans. An understanding of the underpinning factors and knowledge gaps is necessary to inform effective and integrated land-based remediation and intervention options and policies.
Plastics are complex
There are many types of polymers and many ways to characterise their properties, such as chemical and crystalline structures, production processes, design, density, hardness, capacity to absorb water, electrical conductivity, and degradability.18Table 1 provides a summary of common polymers, some common uses, as well as their typical densities. The density of a polymer is important as it relates to buoyancy in fresh and marine water which is pertinent to the current series of articles. It should be noted that densities given here are approximate.
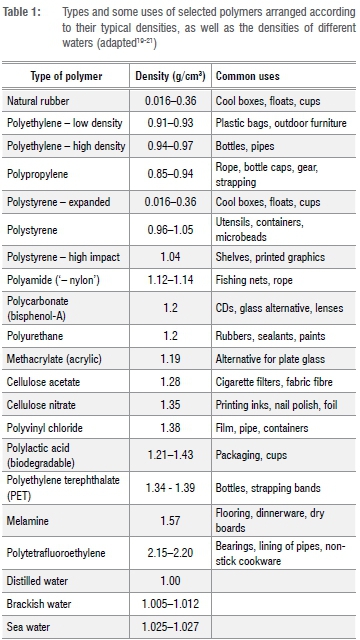
Although many plastic items consist of only one monomer such as ethylene or propylene, there are plastic products that consist of multiple monomers called co-polymers15,22 to address existing or specific needs. Depending on polymerisation efficiency, monomers trapped in the polymer matrix may leach or desorb to the environment, or into organisms that have ingested them. Bisphenol-A is one such monomer that is known to leach and has endocrine disruptive properties.15,22
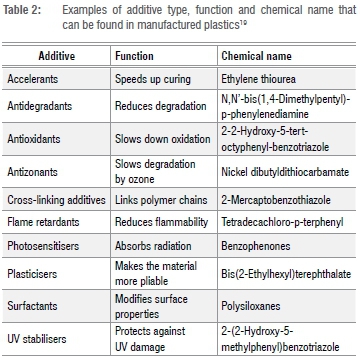
Many kinds of additives are incorporated into plastics to attain desired properties; some are listed in Table 2.19 Some of these additives (up to 70% of the mass) may be released from the article to the environment and to organisms that have ingested them. There are many known toxicological implications associated with both the monomers and additives.15
In addition to the chemicals incorporated during manufacture, synthetic polymers that are mostly made up of non-water soluble organic materials, act as organisms do by absorbing or adsorbing pollutants such as metals and persistent organic pollutants from the environment, concentrating pollutants from land, refuse dumps, water, and perhaps even from air.2325 Mercury and DDT for instance, have been detected at higher concentrations in plastics than in water, supporting a concentration effect akin to bio-concentration. Plastics, suspended matter, and biota passively concentrate hydrophobic molecules from water through adsorption (therefore remaining in solution in the plastic matrix), absorption (such as ionic, steric or covalent binding), or a combination thereof depending on matrix volume, polymer characteristics and ambient concentrations.26 Plastics that thus had their chemical compositions altered in fresh water and reach the marine environment via rivers and outflows (such as industrial and sewage outflows) should therefore be considered as transport facilitators of concentrated chemicals to the oceans. The incorporated and accumulated chemicals could be transferred to terrestrial, freshwater and marine organisms that take them up through ingestion or assimilation, posing a threat to human, biotic and ecosystem health.16,17
Sources of plastic in the environment
Waste in South Africa
Jambeck et al.27 ranked South Africa 11th in a list of countries contributing an estimated 90 000 to 250 000 tonnes to marine plastic in 2010, based on an estimate of 56% mismanaged waste with little actual supporting data. Key reasons considered for the loss of plastics to the environment were lack of waste removal infrastructure, logistical challenges in informal settlements and out-lying communities, poorly managed waste, and littering.28 There are, however, concerns that some of the quantitative assumptions used in various assessments may not be accurate and therefore result in an over-estimation of the actual amounts that enter the South African marine environment.2
Solid waste removal is primarily a function of local government.29 According to the 2018 South African State of Waste report (SoWR)30, total non-mining waste generated in South Africa for 2017 was 54.2 million tonnes, which is 1.0 tonne per capita of 56.5 million people. South Africa generated 1.1 million tonnes of plastic waste in 201730 equating to 19 kg plastic per capita per year, or 53 g per person per day. Jambeck et al.27 used a figure of 2 kg per day of all waste (not only plastic waste) and an estimate of 12.9 million people living within 50 km of the coast of South Africa, to obtain an amount of 505 000 tonnes of plastic waste per year in the coastal areas (assuming equal distribution between inland and coastal plastic waste generation figures).
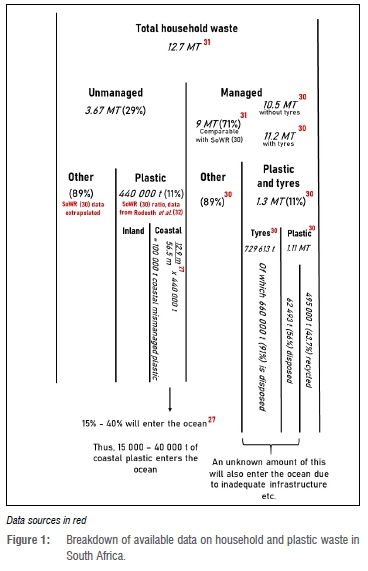
SoWR30 reported that 43.7% of plastic waste is recovered and/or recycled, with the remainder disposed of (618 880 tonnes). Assuming that 29% of the 12.7 million tonnes of household waste does not enter the formal waste management stream, 3.67 million tonnes of waste is mismanaged plastic in South Africa31 (Figure 1). Of the domestic waste handled (GW01, GW50, GW51, GW52, GW54), 11% per mass is plastic and tyre waste.30 Assuming a similar proportion of unmanaged waste is plastic and tyre waste, South Africa releases 440 000 tonnes of unmanaged plastic waste into the environment. The 12.9 million coastal inhabitants living within 50 km from the coast release 100 000 tonnes of plastic waste into the coastal environment. Jambeck et al.27 assumed that 15-40% of the mismanaged plastic waste would enter the oceans. For South Africa's coastal population, we calculate that 15 00040 000 tonnes of plastic could reach the oceans (Figure 1) - more than six-fold less than Jambeck et al.'s27 estimate of 90 000 to 250 000 tonnes coastal plastic waste. Although this figure does not include formally managed waste that also enters the environment via secondary pathways and other factors, such as burning of portions of formally unmanaged waste, we highlight that the estimated contribution of South Africa's plastic input to the ocean is significantly less than previously claimed.
However, an important data uncertainty remains: illegal and informal waste dumping. Illegal waste was recognised in the SoWR30, but no estimates were provided. However, we do not believe that the difference between estimates can be made up by illegal waste dumping. For higherresolution and more accurate numbers, more data should be collected locally and used to improve estimates.
Socio-economics and mismanagement of waste
Major drivers associated with plastic debris in the environment of an area are economic challenges and disadvantaged communities.30 Most South African households (91%) are low-income households.29 In urban municipalities, 82.7% of households have weekly solid waste removal services, while only 4.9% make use of their own dumpsites.29 In rural municipalities, only 1% of households have formal waste collection at least once a week, while 75.1% make use of own refuse dumps.29 Poverty combined with rapid urbanisation and insufficient waste management results in logistical challenges in waste collection.30 Roads in informal settlements are often too narrow to be accessed by garbage trucks. Weak waste management by municipalities leaves many individuals, households and communities with the responsibility of disposing of their own domestic waste. Waste that is not formally collected is disposed of on communal dumps.30 Without proper infrastructure, plastic and other waste is lost to the environment through wind and water run-off.30 Vandalism of fencing at waste management sites also allows the leakage of plastic through wind (personal observations of C.V. and H.B.).
Waste removal includes removal by local authorities, private companies or community members (Table 3). It ranges from 92% in the Western Cape to 20% in the Limpopo Province. Of the South African provinces, the Western Cape and Gauteng have the most efficient formal waste collection systems, while Limpopo and the Eastern Cape have the lowest formal waste collection availability and inevitably the highest portions of informal or communal refuse dumps.30

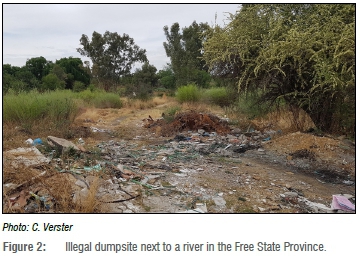
Excluded from the SoWR and data used for national waste estimates is the portion of mismanaged waste.31 Of total domestic waste generated in South Africa, 29% (3.67 million tonnes per annum) is not collected or treated via formal waste management processes.31 Because of inadequate waste management and a lack of consumer awareness and education, waste that is not collected is littered or illegally dumped30,31 (Figure 2). Rural communities may be largely ignorant of the adverse effects of plastics in the environment, resulting in a lack of motivation to keep the area clean.32 We highlight the need for education about proper waste disposal practices and the provision of formal waste management services, especially in rural communities, as both income and settlement type largely determine the efficiency of waste management.31
Coastal cities report large debris loads deposited into the ocean directly via storm-water drainage systems.33-36 Between 2000 and 2002, some 3000 to 4000 tonnes of debris were estimated to be deposited into the ocean by the City of Cape Town each year, most of which originated from informal settlements on the banks of canals.33 Data from beach cleanups and debris booms in Cape Town suggest an increase in the plastic load during rainy seasons.35 Recent beach clean-up data from Cape Town shows 9 of the 10 most frequently found items are associated with fast food containers, with the 10th being earbud sticks.37
Access to running water for households is related to microplastic concentrations in rivers - particularly to the concentration of fibres.38 If access to running water and proper waste-water treatment is limited, as is the case for many rural communities in South Africa, waste water is discharged directly from households into river systems and clothes are often washed directly in rivers. As mechanical19 and handwashing of fabrics in water releases fibres, washing may contribute significant amounts of fibres to rivers. An average mechanical wash load of 6 kg of clothes can release more than 700 000 fibres per wash.39 However, we could find no useful data on laundry activities in South Africa.
Waste management in South Africa is mainly not compliant with applicable regulations.30 Some issues that were identified at disposal sites were lack of access control, daily covering, auditing, and monitoring. To tackle this problem, infrastructure is needed, and waste removal and treatment services should be delivered to all communities. Education and awareness will lay the groundwork to reduce littering and burning. Education campaigns in schools and local authorities have been implemented in Gauteng, North West, Western Cape and the Free State.
The informal waste sector is an integral part of the South African waste removal and recycling system, with more than 25 000 trolley pickers at kerbside and 36 000 landfill waste pickers in 2014.30 Waste pickers tend to select high-value products and often leave the rest, which can then enter the environment.
Transport sector
Global estimates conclude that automotive tyre wear or 'rubber dust' contributes up to 0.81 kg/year/person to the environmental microplastic load.40 Road transport is the dominant mode of transport in South Africa. It will continue to be so in the foreseeable future as 71% of the national transport infrastructure budget in 2018 went to road infrastructure improvement.41 Although no data are available on tyre wear in South Africa, it is likely to be a source contributing to the environmental microplastic load that will also reach the oceans.
Industry
The plastic manufacturing and packaging industries contribute to the load of environmental plastic debris, but the amount of leakage is poorly understood. Much of the leakage is in the form of primary pellets, recyclate flakes, and powders released to the environment during manufacturing or transport. During the 2015 coastal clean-up campaign, 53.9% of the number of microplastics found on beaches were industrial pellets.42 Microscopic plastic particles are mixed with silica and other materials as abrasives and in sandblasting, and are likely to leak to the environment if not properly contained.19
Operation Clean Sweep was initiated in the USA and globally launched in 2011 to contain primary plastic and recyclates within the manufacturing process; which is a goal endorsed by Plastics SA to combat the release of plastics into the environment during production and recycling.28
Microplastics
Microplastics in aquatic ecosystems come from sources such as wastewater treatment plant (WWTP) effluent, sewer overflows, discharge, and run-off from sludge used in agricultural applications and industries.43 In South Africa, urban run-off and informal settlements are other possible sources due to littering and inadequate waste management.
Microplastics may enter an aquatic system in two different forms. They can enter the system as primary microplastics44 or as secondary microplastics that form as breakdown products of larger items. When using cosmetic products like facial scrubs, between 4600 and 94 500 microbeads, which are primary microplastics, can be released45 but little data are available on their retention by WWTPs44. Microbeads are also used in other applications such as sandblasting, soaps and washing powder. Although microbeads have not been banned in South Africa unlike in Canada, the USA, United Kingdom, France, Sweden, Taiwan, South Korea and New Zealand, the South African cosmetics industry has implemented some initiatives to replace microbeads with other materials. Where WWTP outflows are directly to the sea, any microplastics that remain in the effluent will also be directly released to the sea.
When released into the environment untreated, waste water can add large amounts of microplastics, especially microbeads, to riverine loads. Even though international results show that WWTPs can remove 9799% of microplastics, treated waste water still releases large numbers of microplastics due to the high initial volume.43,44 Many of the WWTPs in South Africa are no longer fully functional. Of 68 audited WWTPs, only 8.2% were compliant with effluent quality.30 In 2014, about 30% of the country's sewage treatment plants were considered to be in a 'critical state' (needing urgent intervention), and another 25% in a 'high risk' state.46 This leaves up to 40% of the country's waste water untreated47, increasing the likelihood of increased microplastic release to receiving marine and fresh waters. This plastic then becomes trapped in sludge, which is then often deposited on agricultural land.48 Run-off by water and pickup of microplastics by wind from agricultural land should therefore be considered a possible source of microplastic to rivers and oceans.
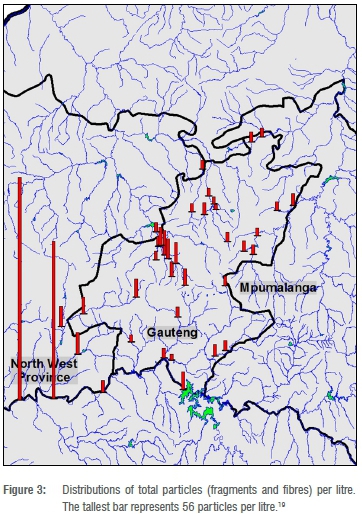
Only a handful of studies have looked at microplastics in South African freshwater systems.19,49 High concentrations of microplastic fragments were found in sections of the Vaal River associated with more turbulent flow19 (Figure 3). Urban rivers like the Crocodile and Klip Rivers had microplastic levels up to 4.5 particles per litre (Figure 3). Levels of microplastic in sediments of the Bloukrans River ranged between 6 and 160 particles per kg dry sediment in summer (high flow) and winter (low flow), respectively.49
Pathways
The size of a plastic item influences its environmental transport after release. Small microplastics (<200 μm), even heavier-than-water polymers like PET (Table 1), tend to be retained in the water column, while larger particles precipitate faster.48 Larger, less buoyant items like bottles with air trapped inside, foams, and low-density polymer items, are found in surface water and riparian zones.
Plastic in the water column becomes covered by layers of biofilm through biofouling.50 The more biotic material attaches to the plastic particle, the heavier it becomes, and sinks. This happens quicker for smaller particles. This process affects the movement and distribution of plastic particles and debris in fresh water50, and probably its transportation potential to the marine environment.
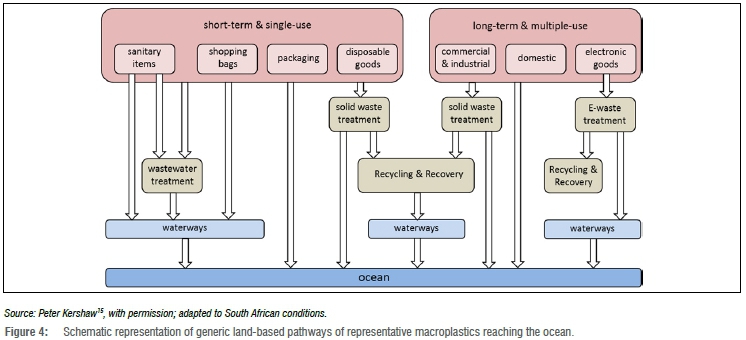
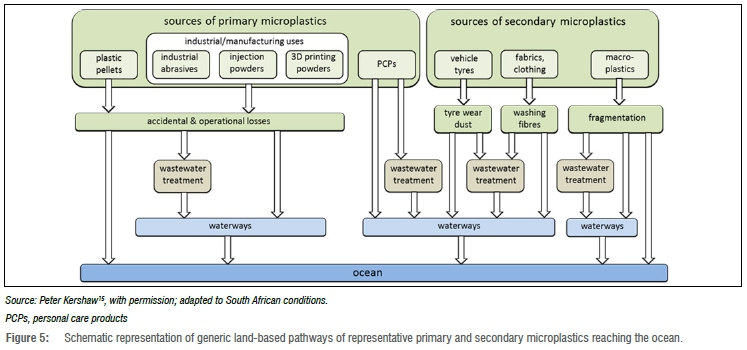
Figures 4 and 5 illustrate the major sources and pathways of examples of macro- and microplastics reaching the marine environment. The reality is, however, far more complex and nuanced. Plastic in the environment is subjected to many factors that influence its movement, distribution, shape and toxicity. Rivers act as the main conduits for marine plastic (Figure 4). Rivers also play a role in the transformation of plastic. As plastic can sink, especially in less dense fresh water (Table 1), riverbeds can act as temporary sinks for plastic that can get resuspended and carried further downstream during high flow events.
Hydrodynamics and the effect of impoundments play a critical role in the movement and distribution of plastics in any freshwater system.49 These movements and interactions are quite well documented for marine systems51,52, but such understanding for riverine systems is lacking for South Africa. A scoping study on microplastic for riverine surface water found microplastic concentrations (both fibres and fragments at near equal proportions) ranging between 0.32 particles per litre in the Suikerbosrand River to 56 particles per litre in the Vaal River after heavy rains.19 Preliminary results for South African groundwater indicate the presence of predominantly fibres at 0.17 particles per litre.19
Airborne
Microplastic fibres have been found all over the globe in the remotest of environments.53 It is assumed that these fibres are deposited via air (Figures 4 and 5). Although the study of microplastic pollution in air is in its infancy, significant numbers of plastic, especially fibres, have been found in settled dust and atmospheric fallout.53 It is estimated that between 1600 and 11 000 fibres/m2/day can be deposited in urban areas.7 Most are natural fibres like cellulose and an estimated 29% are petrochemical-based synthetic fibres.6 There is a strong correlation between anthropogenic activity in an area and the amount of fibres found in the air.6 Although a novel field of enquiry19, microplastics have been shown to travel more than 95 km from point sources54. An estimated 7% of the number of ocean plastic may be deposited through atmospheric fallout.5 Although no data have been published for airborne plastic settling in South Africa, preliminary results indicate the presence of fibres in remote arid areas in the country, suggesting deposition of plastic much further than the 95 km suggested by Bank and Hansson54. Plastic fibres were found in dry run-off sediments (up to 315 particles/m2; Louw J 2019 October, personal communication, and H.B. personal observations) in the Nama Karoo near Brandvlei where it had not rained for many years.
Lightweight macro- and microplastics are also transported by wind. Distances travelled might not be as far as those of smaller particles and fibres, but Jambeck et al.55 suggest that areas downwind from sources act as plastic sinks. Especially in rural areas without proper waste disposal infrastructure, plastic debris can spread quickly outside the bounds of informal dumps, contaminating large areas of rural land. Plastic debris can thus be directly transported to the ocean, carried by wind or blown into rivers that carry debris to the ocean (Figures 4 and 5).
Sinks
Riverine sediments can act as a sink for plastics released into the environment, containing 40 times more microplastic than in surface waters.56 Sediments in weirs had increased levels of plastic because particles settle in these slower flowing parts of rivers.43 Some 16-38% of microplastic denser than water settles out into sediments.50 Particles larger than 200 μm are also retained in riverine sediment with possible resuspension during high flow periods.48 From 0 to 567 fibres/dm3 was found in sediments of lower reaches of water catchments along the South African coast.38 Although no data are available, this is likely to be the case for macro-debris as well. Microfibre content in river sediments of KwaZulu-Natal and the Eastern Cape also show a very strong association with socio-economic development indicators like access to water.38
Elevated levels of micro-litter are found in rivers associated with densely populated areas.43 There are some conflicting findings in the literature as to how far plastic will flow down a river before it becomes stuck in sediment or vegetation. Mani et al.43 claim that plastic loads increase immediately downstream of sources, while Jambeck et al.55 states that downstream areas of high plastic input in rivers act as plastic sinks. Bouwman et al.19 suggest that in the Gauteng study area, microplastics show little pattern in terms of population or downstream accumulation. Larger fragments were slightly more common upstream closer to the Vaal Dam, while smaller particles dominated downstream sites of presumed sources, which suggest that larger particles do not stay suspended in the water column as long, and sites downstream of sources most likely act as sinks for larger plastic pieces. This is in accordance with findings by Nel et al.49 in the Bloukrans River system in the Eastern Cape where low-flow winter periods yielded higher sediment microplastic concentrations (160 particles per kilogram dry mass) when compared with high-flow periods (6.3 particles per kilogram dry mass). There are indications of very high microplastic loadings in sediment from rivers flowing through the Kruger National Park (Shikwambana P 2018, personal communication). Although not conclusive, flow rate seems to be an important hydrodynamic factor with the greatest effect on the plastic load in rivers of South Africa due to settling out in low-flow areas and seasons.
Soil
Although images of land-based environmental macro-debris are common, scant data are available in a South African context on amounts and distribution. The largest data sets available in this regard report amounts and composition of plastic on beaches42, which indicate a recent increase in disposable nappies on beaches close to informal settlements. Interaction with biota on land is also less reported on, but examples include reports of cattle eating plastic in grazing areas.32
Current uncertainties
Compared with marine plastic debris research, information and data on inland sources and pathways in South Africa are scarce. To some extent, data, findings and models can be extrapolated from research done elsewhere. However, as pointed out by Jambeck et al.55, South Africa faces distinct socio-economic challenges and unique environmental and ecological dynamics affecting the load and movement of land-based plastic. Wrong assumptions may lead to wrong conclusions that may adversely affect policy and interventions. Here we discuss some of these uncertainties in terms of difficulties to extrapolate global findings to a South African context.
• Although visibly an issue, volumes and hotspots of illegal dumping and informal dumps are still unknown and need to be quantified in order to motivate mitigation.
• Considering the unique socio-economic issues faced by South Africa when compared with countries with more complete data sets for sources and pathways of plastic, plastic management and regulations implemented in other parts of the world might not be as effective here or have unintended consequences.57 In order to tailor a plastic policy for South Africa, more spatial and temporal data are needed for freshwater bodies to determine areas in need of protection, areas of highest threat, and processes that may be targeted for intervention.
• The deposition of plastic in riverine sediment as a possible plastic sink49 correlates with global findings. Deposition or transport of plastic in or by rivers in these different regions need to be better understood and might be part of the answer to the missing plastic problem.2 If rivers do act as a temporary sink for plastic, more emphasis will have to be placed on determining the amounts and impacts of plastic in freshwater systems.
• Freshwater and estuarine sediments may act as a long-term secondary source of plastics to the oceans, possibly long after effective mitigation on plastic releases has been achieved.
• Preliminary results19 show low microbead counts in South African rivers compared with those of developed countries. Although surface water microplastic concentrations in the Gauteng and North West Province rivers ranged between 0.33 and 56 particles per litre, microbeads were found at only two of the sites, and in very low concentrations (<0.01 particle per litre). Microbead data from South Africa's freshwater sediments are yet to be reported but can be expected to be higher than that of surface water - international data range up to 103 beads per litre of sediment.11 Global estimates show microbeads originating from cosmetics make up only 2% of the marine plastic load by number.5 It would be beneficial to consider import, production, application and distribution of plastic microbeads as it attracts much international attention. South Africa needs to determine whether banning microbeads is a realistic and achievable national priority, and an easy first action to reduce the release of manufactured microplastics.
• A lack of data about polymer and pollutant composition of plastic debris in the environment is another area of study that will help refine, identify and mitigate the greatest threats.
• Recently it has been suggested that antimicrobial resistance genes are associated with microplastic biofilms. These microplastic particles act as vectors for these genes, especially in plastics released by WWTPs.58 This will possibly translate to agricultural sludge applications as media in which antimicrobial resistance genes spread through the environment. The movement of antimicrobial genes from land-based sources to the sea is a threat that needs further investigation.
Evidence gaps
• Plastic debris from land-based sources reaches the ocean largely by means of rivers and rivers could act as sinks for plastic. When considering that many out-lying communities in South Africa source water, often untreated, directly from these systems and the country has limited freshwater resources, several concerns arise. Knowledge gaps in this regard include the volume of plastic trapped in freshwater systems and the retention time of plastic in freshwater sediment acting as a temporary sink and possible secondary source of plastic debris.
• Due to the diverse marine and freshwater aquatic biodiversity of South Africa, very little is known about specific ecosystem health risks of plastic debris in South Africa. To our knowledge, no published toxicity tests or ecological risk assessments have been conducted on freshwater organisms. Because it is evident that plastic is present in South African aquatic systems, we need to know its effect on freshwater ecosystems.
• Factors affecting the breakdown of plastic in terrestrial and freshwater ecosystems are inadequately quantified in South African conditions. There are many physical and biological factors that play a role and the effects on eventual microplastic and nanoplastic (<100 nm in longest dimension) formation remains unknown.
• Global estimates show that WWTPs remove more than 99% of microplastic from waste water.59 Sludge from the waste-water treatment process is often applied as fertiliser to agricultural soils, transferring microplastics to agricultural soil.48 However, the retention rate of South Africa's WWtPs has not been tested, and the extent of sludge addition is not well documented. It is thus necessary to determine the amount of plastic in sludge. Sludge is also a secondary source via wind and run-off. Therefore, more information is needed on how sludge is managed in South Africa, to determine whether intervention is needed.
• Vehicle tyre wear could be a significant source of microplastics in developed countries. The South African transportation system relies heavily on road transport. One can therefore expect notable additions to the freshwater and marine environments. This topic has not yet been considered in South Africa.
• Preliminary results indicate the cosmopolitan distribution of microplastic fibres.60 The extent to which this is true in South Africa is worth examining. Certain aspects of dust models are available for South Africa and may be adapted, but this will require additional information on the plastic content of dust in air. Long-range transport of plastic is an issue of concern as it can lead to contamination of remote environments, including marine ecosystems.
Implications and actions
Municipalities should prioritise improvements in waste removal and management - especially in informal settlements, for hygienic and environmental reasons. Systems must be designed and/or implemented for the needs and conditions of communities5 to improve recycle supply chains, and lose less plastic to the environment.
We encourage the development of a standardised solid waste monitoring programme to monitor high risk areas.61 Issues such as illegal dumping need to be monitored and enforced.
Further public and private sector incentives, awareness raising, and civil society pressures are needed to improve the situation to reduce land-based sources to both freshwater and marine environments. Risk communication and education efforts about the environmental and possible health effects of plastic are of great importance if public participation is to be expected.19 Public realisation of the value of plastic as an economic resource could motivate public participation in recycling and clean-up efforts.28 Public sector assistance in extended producer responsibility programmes will assist industry mediators, e.g. PETCO62, to encourage and administer producer responsibility and contribute to the circular economy concept.
In moving towards a circular economy, research and development resources must be applied to develop alternatives for difficult-to-recycle plastics, e.g. polystyrene.28 As certain polymers and polymer compositions are less economically rewarding to recycle, much of these are sent to landfill. However, it should be noted that landfill space is limited and so diversion from landfill is ideal.30
However, it is clear that maintaining the status quo in the face of increasing population growth, industry, consumerism and wealth, will increase the land-based plastic loadings to the sea. Urgent interventions, awareness, voluntary actions, and regulations are needed to stem the flow of plastics to our oceans. An understanding of the underpinning factors and knowledge gaps is necessary to inform effective and integrated land-based remediation and intervention options and policies.
Acknowledgements
We acknowledge the funding support for the preparation of this review paper from the South African Department of Science and Innovation (DSI), through the Waste RDI Roadmap, managed by the Council for Scientific and Industrial Research (CSIR). Subsidiary funding was provided under the umbrella of the Commonwealth Litter Programme (CLiP) implemented by the Centre for Environment, Fisheries and Aquaculture Science (Cefas), funded by the United Kingdom Government's Department for Environment, Food and Rural Affairs (Defra). Parts of this work are based on research supported by the South African Water Research Commission (K5/2610) and parts were funded by the National Research Foundation of South Africa (grant no. 117400). Opinions expressed and conclusions arrived at are our own and are not necessarily attributed to any of the funders. We also acknowledge and value the reviews and inputs of Fiona Preston-Whyte, Linda Godfrey, Peter Ryan and the anonymous reviewers.
Authors' contributions
C.V.: Writing - the initial draft; writing - revisions; project management. H.B.: Writing - revisions; student supervision; funding acquisition; project leadership.
References
1. Kühn S, Bravo Rebolledo EL, Van Franeker JA. Deleterious effects of litter on marine life. In: Bergmann M, Gutow L, Klages M, editors. Marine anthropogenic litter. Cham: Springer; 2015. p. 75-116. https://doi.org/10.1007/978-3-319-16510-3_4 [ Links ]
2. Ryan PG. The transport and fate of marine plastics in South Africa and adjacent oceans. S Afr J Sci. 2020;116(5/6), Art. #7677, 9 pages. https://doi.org/10.17159/sajs.2020/7677 [ Links ]
3. Li W, Tse HF, Fok L. Plastic waste in the marine environment: A review of sources, occurrence and effects. Sci Total Environ. 2016;566-567:333-349. https://doi.org/10.1016/j.scitotenv.2016.05.084 [ Links ]
4. Ryan P Dilleya BJ, Ronconi RA, Connan M. Rapid increase in Asian bottles in the South Atlantic Ocean indicates major debris inputs from ships. Proc Natl Acad Sci USA. 2019;116(42):20892-20897. https://doi.org/10.1073/pnas.1909816116 [ Links ]
5. Boucher J, Friot D. Primary microplastics in the oceans: A global evaluation of sources. Gland: International Union for Conservation of Nature; 2017. https://doi.org/10.2305/IUCN.CH.2017.01.en [ Links ]
6. Dris R, Gasprei J, Saad M, Mirande C, Tassin B. Synthetic fibres in atmospheric fallout: A source of microplastics in the environment? Mar Pollut Bull. 2016;104:290-293. https://doi.org/10.1016/j.marpolbul.2016.01.006 [ Links ]
7. Dris R, Gasperi J, Mirande C, Mandin C, Guerrouache M, Langlois V, et al. A first overview of textile fibres, including microplastics, in indoor and outdoor environments. Environ Pollut. 2017;221:453-458. https://doi.org/10.1016/j.envpol.2016.12.013 [ Links ]
8. Eriksen M, Lebreton LCM, Carson HS, Thiel M, Moore CJ, et al. Plastic pollution in the world's oceans. More than 5 trillion pieces weighing over 250,000 tons afloat at sea. PLoS ONE. 2014;10;9(12), e111913. https://doi.org/10.1371/journal.pone.0111913 [ Links ]
9. Leslie H, Van Velzen MJM, Vethaak AD. Microplastic survey of the Dutch environment: Novel data set of microplastics in North Sea sediments, treated wastewater effluents and marine biota. Amsterdam: Institute for Environmental Studies, Vrije Universiteit; 2013. [ Links ]
10. Gasprei J, Dris R, Bonin T, Rocher V, Tassin B. Assessment of floating plastic debris in surface water along the Seine River. Environ Pollut. 2014;195:163-166. https://doi.org/10.1016/j.envpol.2014.09.001 [ Links ]
11. Castaneda R, Avlijas S, Simard MA, Ricciardi A. Microplastic pollution in St. Lawrence River sediments. Can J Fish Aquat Sci. 2014;71:1-5. https://doi.org/10.1139/cjfas-2014-0281 [ Links ]
12. Zhang K, Gong W, Lv J, Xiong X, Wu C. Accumulation of floating microplastics behind the Three Gorges Dam. Environ Pollut. 2015;204:117-123. https://doi.org/10.1016/j.envpol.2015.04.023 [ Links ]
13. Lebreton L, Greer SD, Borrero JC. Numerical modelling of floating debris in the world's oceans. Mar Pollut Bull. 2012;64(3):653-661. https://doi.org/10.1016/j.marpolbul.2011.10.027 [ Links ]
14. Andrady A. Microplastics in the marine environment. Mar Pollut Bull. 2011;62:1596-1605. https://doi.org/10.1016/j.marpolbul.2011.05.030 [ Links ]
15. Kershaw PJ, Rochman CM, editors. IMO/FAO/UNESCO-IOC/UNIDO/WMO/ IAEA/UN/ UNEP/UNDP Joint Group of Experts on the Scientific Aspects of Marine Environmental Protection (GESAMP) Report no. 93. Sources, fate and effects of microplastics in the marine environment: A global assessment. London: International Maritime Organization; 2015. [ Links ]
16. Van Cauwenberghe L, Claessens M, Vandegehuchte MB, Janssen CR. Microplastics are taken up by mussels (Mytilus edulis) and lugworms (Arenicolamarina) living in natural habitats. Environ Pollut. 2015;199:10-17. https://doi.org/10.1016/j.envpol.2015.01.008 [ Links ]
17. Woodall L, Robinson CL, Rogers AD, Narayanaswamy BE, Paterson GE. Deep-sea litter: A comparison of seamounts, banks and a ridge in the Atlantic and Indian Oceans reveals both environmental and anthropogenic factors impact accumulation and composition. Front Mar Sci. 2015;2, Art. #3, 10 pages. https://doi.org/10.3389/fmars.2015.00003 [ Links ]
18. Elberg F, Schirber H, Huberth H, Schlor N. Polymer materials handbook. Würzburg: Plastics Federation of South Africa; 1995. [ Links ]
19. Bouwman H, Minnaar K, Bezuidenhout C, Verster C. Microplastic in freshwater environments - A scoping study. Pretoria: Water Research Commission; 2018. [ Links ]
20. Schwarz O, Ebling F, Lupke G. Plastic processing. Durban: Process Litho; 1995. [ Links ]
21. Lehner R, Weder C, Petri-Fink A, Rothen-Rutishauser B. Emergence of nanoplastic in the environment and possible impact on human health. Environ Sci Technol. 2019;53(4):1748-1765. https://doi.org/10.1021/acs.est.8b05512 [ Links ]
22. Hahladakis J, Velis CA, Weber R, lacovidou E, Purnell P An overview of chemical additives presents in plastics: Migration, release, fate, and environmental impact during their use, disposal and recycling. J Hazard Mater. 2018;344:179-199. https://doi.org/10.1016/j.jhazmat.2017.10.014 [ Links ]
23. Wagner M, Lambert S. Freshwater microplastics. Emerging environmental contaminants? The handbook of environmental chemistry vol. 5. Cham: Springer Open; 2018. https://doi.org/10.1007/978-3-319-61615-5 [ Links ]
24. Eriksson C, Burton H, Fitch S, Schulz M, Van den Hoff J. Daily accumulation rates of marine debris on sub-Antarctic island beaches. Mar Pollut Bull. 2013;66:199-208. https://doi.org/10.1016/j.marpolbul.2012.08.026 [ Links ]
25. Graca B, Betdowska M, Wrzesien P Zgrundo A. Styrofoam debris as a potential carrier of mercury within ecosystems. Environ Sci Pollut Res. 2014;21:2263-2271. https://doi.org/10.1007/s11356-013-2153-4 [ Links ]
26. Hartmann N, Rist S, Bodin J, Jensen LSH, Schmidt SN, Mayer P et al. Microplastics as vectors for environmental contaminants: Exploring sorption, desorption, and transfer to biota. Integr Environ Assess Manag. 2017;13(3):488-493. https://doi.org/10.1002/ieam.1904 [ Links ]
27. Jambeck J, Geyer R, Wilcox C, Siegler TR, Perryman M, Andrady A, et al. Plastic waste inputs from land into the ocean. Science. 2015;347(6223):768-771. https://doi.org/10.1126/science.1260352 [ Links ]
28. Plastics S. National plastics recycling survey 2018. Executive summary. Johannesburg: Plastics SA; 2019. [ Links ]
29. Statistics South Africa (Stats SA). The state of basic service delivery in South Africa: In-depth analysis of the Community Survey 2016 data. Pretoria: Stats SA; 2016. [ Links ]
30. South African Department of Environmental Affairs (DEA). South African state of waste. A report on the state of the environment. Final draft report. Pretoria: DEA; 2018. [ Links ]
31. Rodseth C, Notten P Von Blottnitz H. A revised approach for estimating informally disposed domestic waste in rural versus urban South Africa and implications for waste management. S Afr J Sci. 2020;116(1/2), Art. #5635, 6 pages. https://doi.org/10.17159/sajs.2020/5635 [ Links ]
32. Wiseman M, Vurayayi MR. The incidence of plastic debris along Tyume river in Alice, South Africa. Int J Asian Stud. 2012;2(10):1801-1814. [ Links ]
33. Marais M, Armitage N, Wise C. The measurement and reduction of urban litter entering stormwater drainage systems: Paper 1 - Quantifying the problem using the City of Cape Town as a case study. Water SA. 2004;30(4):469-482. https://doi.org/10.4314/wsa.v30i4.5099 [ Links ]
34. Marais M, Armitage N. The measurement and reduction of urban litter entering stormwater drainage systems: Paper 2 - Strategies for reducing the litter in the stormwater drainage systems. Water SA. 2004;30(4):483-492. https://doi.org/10.4314/wsa.v30i4.5100 [ Links ]
35. Armitage N, Rooseboom A. The removal of urban litter from stormwater conduits and streams: Paper 1 - The quantities involved and catchment litter management options. Water SA. 2000;26(2):181-188. [ Links ]
36. Armitage N, Rooseboom A. The removal of urban litter from stormwater conduits and streams: Paper 2 - Model studies of potential trapping structures. Water SA. 2000;26(2):189-194. [ Links ]
37. Chitaka T, Von Blottnitz H. Accumulation and characteristics of plastic debris along five beaches in Cape Town, South Africa. Mar Pollut Bull. 2019;138:451-457. https://doi.org/10.1016/j.marpolbul.2018.11.065 [ Links ]
38. De Villiers S. Microfibre pollution hotspots in river sediments adjacent to South Africa's coastline. Water SA. 2019;45(1):97-102. https://doi.org/10.4314/wsa.v45i1.11 [ Links ]
39. Napper I, Thompson RC. Release of synthetic microplastic plastic fibres from domestic washing machines: Effects of fabric type and washing conditions. Mar Pollut Bull. 2016;112:39-45. https://doi.org/10.1016/j.marpolbul.2016.09.025 [ Links ]
40. Kole P Löhr AJ, Van Belleghem FGAJ, Ragas AMJ. Wear and tear of tyres: A stealthy source of microplastics in the environment. Int J Environ Res Public Health. 2017;14(1265):1-35. https://doi.org/10.3390/ijerph14101265 [ Links ]
41. South African Department of Transport (DoT). Transport statistics bulletin: 2015. Pretoria: DoT; 2018. [ Links ]
42. Plastics, people and partnerships: An annual review. Johannesburg: Plastics SA; 2015. [ Links ]
43. Mani T, Hauk A, Walter U, Burkhardt-Holm P. Microplastics profile along the Rhine River. Sci Rep. 2016;5(1), Art. #17988, 7 pages. https://doi.org/10.1038/srep17988 [ Links ]
44. Mintenig S, Int-Veen I, Loder M, Primpke S, Gerdts G. Identification of microplastic in effluents of waste water treatment plants using focal plane array-based micro-Fourier-transform infrared imaging. Water Res. 2017;108:365-372. https://doi.org/10.1016/j.watres.2016.11.015 [ Links ]
45. Napper I, Bakir A, Rowland SJ, Thompson RC. Characterisation, quantity and sorptive properties of microplastics extracted from cosmetics. Mar Pollut Bull. 2015;99:178-185. https://doi.org/10.1016/j.marpolbul.2015.07.029 [ Links ]
46. South African Department of Water and Sanitation (DWS). Executive summary for the 2014 Green Drop PAT report. Pretoria: DWS; 2014. [ Links ]
47. Donnenfeld D, Crookes C, Hedden S. A delicate balance: Water scarcity in South Africa. Pretoria: Institute for Security Studies; 2018. [ Links ]
48. Nizzetto L, Bussy G, Futter NM, Butterfield D, Whitehead PG. A theoretical assessment of microplastic transport in river catchments and their retention by soils and river sediments. Environ Sci Process Impacts. 2016;18(8):1050-1059. https://doi.org/10.1039/C6EM00206D [ Links ]
49. Nel H, Dalu T, Wasserman RJ. Sinks and sources: Assessing microplastic abundance in river sediment and deposit feeders in an Austral temperate urban river system. Sci Total Environ. 2018;612:950-956. https://doi.org/10.1016/j.scitotenv.2017.08.298 [ Links ]
50. Fazey F, Ryan PG. Biofouling on buoyant marine plastics: An experimental study into the effect of size on surface longevity. Environ Pollut. 2016;210:354-360. https://doi.org/10.1016/j.envpol.2016.01.026 [ Links ]
51. Sherman P Van Sebille E. Modeling marine surface microplastic transport to assess optimal removal locations. Environ Res Lett. 2016;11(1), Art. #041001, 6 pages. https://doi.org/10.1088/1748-9326/11/1/014006 [ Links ]
52. Hardesty B, Harari J, Isobe A, Lebreton L, Maximenko N, Potemra J, et al. Using numerical model simulations to improve the understanding of micro-plastic distribution and pathways in the marine environment. Front Mar Sci. 2017;4, Art. #30, 9 pages. https://doi.org/10.3389/fmars.2017.00030 [ Links ]
53. Prata J. Airborne microplastics: Consequences to human health? Environ Pollut. 2018;234:115-126. https://doi.org/10.1016/j.envpol.2017.11.043 [ Links ]
54. Bank M, Hansson SV. The plastic cycle: A novel and holistic paradigm for the Anthropocene. Environ Sci Technol. 2019;53:7177-7179. https://doi.org/10.1021/acs.est.9b02942 [ Links ]
55. Jambeck J, Hardesty BD, Brooks AL, Friends T, Teleki K, Fabres J, et al. Challenges and emerging solutions to the land-based plastic waste issue in Africa. Mar Pollut Bull. 2018;96:256-263. https://doi.org/10.1016/j.marpol.2017.10.041 [ Links ]
56. Kawecki D, Nowack B. Polymer-specific modeling of the environmental emissions of seven commodity plastics as macro- and microplastics. Environ Sci Technol. 2019;53(16):9664-9676. https://doi.org/10.1021/acs.est.9b02900 [ Links ]
57. Verster C, Minnaar K, Bouwman H. Marine and freshwater microplastic research in South Africa. Integr Environ Assess Manag. 2017;13(3):533-535. https://doi.org/10.1002/ieam.1900 [ Links ]
58. Eckert E, Di Cesare A, Kettner MT, Arias-Andres M, Fontaneto D, Grossart HP, et al. Microplastics increase impact of treated wastewater on freshwater microbial community. Environ Pollut. 2018;234:495-502. https://doi.org/10.1016/j.envpol.2017.11.070 [ Links ]
59. UK Water Industry Research (UKWIR). Sink to river - river to tap: A review of potential risks from nanoparticles and microplastics. London: UKWIR; 2019. [ Links ]
60. Gasprei J, Dris R, Rocher V Tassin B. Microplastics in the continental area: An emerging challenge. The Norman Network Bulletin. 2015;4:18-19. [ Links ]
61. Ryan PG, Moore CJ, Van Franeker JA, Moloney CL. Monitoring the abundance of plastic debris in the marine environment. Phil Trans R Soc B. 2009;364(1526):1999-2012. https://doi.org/10.1098/rstb.2008.0207 [ Links ]
62. Sustainable Seas Trust. Strategies for marine waste: A guide to action for Africa. Port Elizabeth: Sustainable Seas Trust; 2017. [ Links ]
 Correspondence:
Carina Verster
cverstersa@gmail.com
Received: 04 Dec. 2019
Revised: 20 Mar. 2020
Accepted: 15 Apr. 2020
Published: 27 May 2020
Editors: Jane Carruthers Linda Godfrey
Funding: Waste RDI Roadmap, Council for Scientific and Industrial Research, Department of Science and Innovation (South Africa); Commonwealth Litter Programme, Centre for Environment, Fisheries and Aquaculture Science, Department for Environment, Food and Rural Affairs (UK); Water Research Commission (South Africa); National Research Foundation (South Africa)

