


Services on Demand
Article
 English (pdf)
 Article in xml format
 Article references
Indicators

Related links
-
 Cited by Google
 -
 Similars in Google
Share

 Permalink
South African Journal of Science
On-line version ISSN 1996-7489
Print version ISSN 0038-2353
S. Afr. j. sci. vol.116 n.3-4 Pretoria Mar./Apr. 2020
http://dx.doi.org/10.17159/sajs.2020/6838
RESEARCH ARTICLE
Research productivity in science and its relationship to race in South Africa
Radhamany Sooryamoorthy; Mduduzi N.G. Mtshali
Sociology Programme, School of Social Sciences, University of KwaZulu-Natal, Durban, South Africa
ABSTRACT
The research productivity of scholars is ordinarily affected by a combination of factors such as their age, gender, academic age, rank, qualification, experience, discipline, collaboration and co-authorship. A factor not often included in the analysis of research productivity is race. We examined the inter-relationship between race and other pertinent variables of research productivity of scholars in South Africa, drawing data from two waves of study. We found that there was an increase in the proportion of African respondents and in the productivity of both African and Indian respondents. Compared to 2008, African respondents had higher mean values than the rest in measures such as papers written in the last year, papers published in foreign journals, combined measure of journal publications and in total productivity in 2014. A significant proportion of African respondents has been moved to South Africa.
SIGNIFICANCE:
• The study reveals the complexities of research productivity of scholars in higher education and research institutions in South Africa and offers insights into the influence of race.
• The findings contribute to the study of transformation that is underway in higher education and research institutions in the country.
Keywords: publications, transformation, collaboration, higher education
Introduction
For some time now, science and scientific research have been gaining increased attention, interest and recognition in South Africa. One of the measures to understand the growth, development and trends in scientific research is to study the research productivity of scientists in higher learning and research institutions where most of the research activities are being undertaken.
A few studies have specifically examined research productivity in South Africa. Matthews1 for instance, focused on the relationship between the productivity (the number of papers and author's share) and rank of academics in South African universities. North et al. 2 explored demographic and academic factors in research productivity.
A number of factors are responsible for research productivity. Age, gender, qualification, academic experience and rank are some of them. Race is another variable that determines varying levels of research productivity. However, race as an influencing factor in research productivity has not been studied sufficiently. The analysis done by Eagan and Garvey3 revealed that race and ethnicity are associated with differences in research productivity. Sooryamoorthy's4 study of South African scholars also showed how research activities are differentially influenced by race.
We undertook this empirical study to understand the relationship between race and the research productivity of academics and researchers in South Africa. We specifically focused on publication productivity. This study was conducted in two waves in 2008 and 2014 and was driven by the following research questions:
1. Has there been a change in the publication productivity of academics and researchers in universities and research institutions in South Africa between the two periods of study?
2. What relationship between publication productivity and race is evident in South Africa? How are the African respondents different from the other racial groups in their publication productivity in higher learning and research institutions?
3. Is there any evidence in the data to suggest that transformation in terms of race has occurred in the higher learning and research institutions in the country?
Background of the study
Research productivity has been defined and studied widely in varied contexts. A number of measures prominently appear in the literature, including publications (peer-reviewed articles, chapters, and authored and edited books), citations, h-index, fields or disciplines1,3,5,6, qualifications2,6, age6,7, gender3,8-10, academic rank1,11, study abroad12, collaboration or co-authorship11,13-16, career path17,18, and so on.
Data and methods
The analysis presented covers publications in peer-reviewed journals (both national and foreign origin), and chapters in edited volumes and books (edited and monographs) that were published by the respondents during the 5 years prior to the date of the interview. The measure also included the number of papers written in the previous year. Specific periods (for instance, between 2003 and 2007, and between 2000 and 2014) were considered so that the respondents could provide accurate information. From these individual measures, total publication productivity was computed as the dependent variable. Relying on the review of literature, relevant independent variables were identified: race, rank, age, academic age, gender, education, field of study, immigration, time spent on doing research (in hours per an average day), years spent outside the country for higher education, professional meetings attended (in the country and overseas), and collaboration (collaborated years and partners in the career). These independent variables were tested for their significance in publication productivity before they were finally adopted for correlational and regression analyses.
Two waves of data were used. One was collected in 2008 and the other in 2014. In both waves, sample respondents were drawn from two higher learning institutions and four research institutes in the province of KwaZulu-Natal in South Africa. There were 22 science departments (in the disciplines of agricultural science, engineering science, life sciences, natural sciences and medical sciences) in the selected institutions. As we intended to have as many respondents as possible, all those who were employed in these departments were approached for a face-to-face interview, using a structured interview schedule. Race and gender were self-described by respondents. Ethical clearance was obtained from the University of KwaZulu-Natal (ref. HSS/0336/014).
Analysis and findings
Background of the respondents
The demographic and professional details of the sample respondents are presented in Table 1. A total of 204 academics and researchers were interviewed in 2008 and 113 in 2014. Respondents were sampled from two sectors namely, academic and research institutions. Academics formed 69% of the sample and the remaining respondents were researchers. In this proportion no significant association between the samples for 2008 and 2014 was observed, three-fourths of the respondents belonged to the university sector and the remaining to the research institute sector.
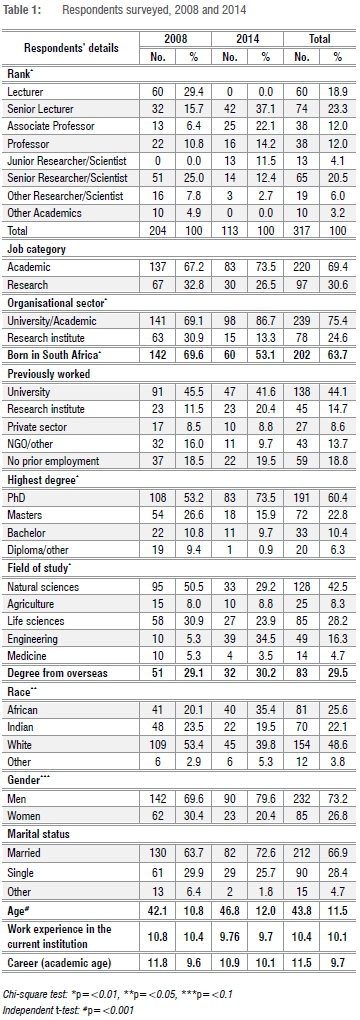
The majority of respondents (79%) were in senior ranks such as senior lecturer (23%), associate or full professor (35%), and senior researcher/ scientist (21%). The year-wise breakdown showed association between junior ranks and 2008, except for the rank of senior researcher/scientist.
The greatest proportion of respondents (43%) was from the natural sciences, followed by the life sciences (28%) and engineering (16%). Only a few came from agriculture and medicine. A difference in association between fields and the year of survey was evident. There were more respondents who worked in the natural sciences in 2008 than in 2014, and more engineering respondents in 2014 than in 2008. One-third of the total sample obtained degrees at overseas institutions.
About three-fourths of respondents were men and one-fourth women. The men:women ratio was 70:30 in 2008 and 80:20 in 2014. Two-thirds of the respondents in the whole sample were married and 28% were single at the time of the interview. Between the two waves, these percentages did not show any significant association. The mean age of the respondents for the entire sample was 44 years, which differed significantly between 2008 (42 years) and 2014 (47 years), as shown in the independent f-test. The career age of the respondents was about 11 years. The same was observed for both sets of respondents. The work experience of the respondents in the institutions where they worked at the time of the survey was less than their career age. This figure was about 10 years for both the whole sample and the sub-samples for 2008 and 2014.
Four major racial groups were identified in the sample: Africans, Indians, whites and coloureds. In South Africa in 2011, the population percentages were 79.5% African, 9% white, 9% coloured and 2.5% Indian.19 In the total sample, the majority were white (49%), followed by African (26%) and Indian (22%). Coloured respondents, who also included some Asians, were in the minority (4%). The percentages of racial representation in the two periods did show a statistically significant difference of association in the chi-square test. The proportion of the African respondents increased from 20% in 2008 to 35% in 2014. Meanwhile the percentage of white respondents had decreased from 53 in 2008 to 40 in 2014. The same pattern was observed for the Indian respondents (24% in 2008 to 20% in 2014). The details of other variables are shown in Table 1.
Respondents and race
Almost two-fifths (39%) of the African respondents in 2008 were lecturers, as were 46% of Indians, but only 17% of whites. The percentage of respondents in the rank of senior lecturer was higher for Africans than for whites and Indians. In the first wave of the study, there were fewer associate professors and no professors among the African respondents. This was also the case for senior researcher/scientists among this racial group. By 2014, the proportion of African respondents in the various ranks had improved: there were more senior lecturers, associate professors and professors who were Africans. This finding is comparable with those for Indians and whites. However, representation in the rank of senior researcher/scientist was lower for African respondents than for Indian and white respondents in 2014.
The association between academics and racial groups was statistically significant based on the chi-square test. At the same time, there was an increase in the percentage of African academics (from 68% in 2008 to 88% in 2014) but not in that of Indian and white academics in 2014. In 2008, 50% of the African respondents were born in South Africa compared with 94% of Indians, 67% of whites and 70% of all respondents. By 2014 the percentage had decreased significantly for Africans (23%), than for Indians (77%) and whites (71%). In the sub-sample of 2014, the overall percentage was 53. This difference is large for Africans. This information should be considered in conjunction with the years of being in the country after they had moved to South Africa. In 2008, the average years of stay in the country for the whole sample was 17 years. Amongst the different racial categories, the average years of stay were 5.6 for Africans, 3.7 for Indians, 25 for whites and 3.8 for 'Others'. Africans and Indians (and Others) came to the country quite recently. In 2014, the figures were 10.5 years for Africans, 5.8 for Indians, 14.2 for whites and 7.7 for Others. The average for the population was 13 years. Here again both Indians and Africans were the most recently migrated respondents. For both surveyed years the difference was statistically significant.
In the 2008 sample, 50% of the African respondents had previous experience of working in a university and 13% in research institutes. The white respondents (64%) had prior working experience in similar work environments of universities and research institutes. The combined percentage for prior experience in universities and research institutes was higher (75%) for the African respondents in 2014 and higher than those of Indians (44%) and whites (58%). Compared to whites and Indians, fewer Africans had a PhD at the time of the survey in 2008. About 66% of the African respondents were from the field of natural sciences followed by 20% who worked in the field of life sciences. This finding can be compared with a similar percentage for the Indian respondents in the natural sciences and in the life sciences and a different percentage for the white respondents (37% natural sciences and 42% life sciences). By 2014, there was a similar percentage (30% each) of Africans in the fields of the natural sciences, life sciences and engineering. A diverse pattern emerged for the Indian and the white respondents. For most of the Indians the preferred fields were engineering (55%) and the natural sciences (36%). A more or less even spread across the fields of the natural sciences, agriculture, life sciences and engineering was the observed pattern for the whites. About one-third of the African respondents in the sample for 2008, which was similar to the percentage for the whole sample for 2008, had a degree earned overseas. This proportion is higher than that of the Indians (13%) but lower than that of the whites (37%). By 2014, the proportion had changed to 56% for Africans, 5% for Indians and 23% for whites, while the sample as a whole remained at 30%.
The ratio of men and women among the African sample for the year 2008 was similar to that of the entire sample. Men formed more than two-thirds of the African sample, and the percentage was not different from those for Indians and whites. The mean age of the African respondents was 5 years less than that of the 2008 sample. They were also younger than the Indians (by 4 years), and the whites (by 8 years). In the 2014 sample, the average age of the Africans was close to the average age for the sample, higher than that of the Indians by 9 years, and about the same as that of the white respondents. In regard to the work experience in their present institutions, the African respondents had one of the lowest figures in the 2008 sample: 59% lower than the average for the sample, 61% lower than the Indians and 66% lower than the whites. In the 2014 sample, this gap closed for the sample (28% lower), the Indians (17% lower) and the whites (47% lower). In academic age, Africans were the junior ones among all the groups in the 2008 sample: an average of 6.8 years compared with 8.9 for Indians and 15.2 for whites. Clearly, Africans had far less academic experience than their counterparts. In the 2014 sample, the African respondents had a similar academic age as the sample, higher than that of Indians by 3 years and lower than that of whites by 4 years. This means Africans had a higher academic age in 2014 than in 2008.
Publication productivity and race
The productivity variables chosen for the analysis were papers written in the last year and work published during the previous 5 years. The publications included in the analysis were papers published in national and foreign journals, chapters in edited volumes, edited books and monographs. Because the focus of the study was on peer-reviewed academic publications, those written in English were analysed. From these variables a combined publication productivity was computed. These variables were examined across the racial categories of Africans, Indians, whites and Others using an analysis of variance (ANOVA) test.
Before examining racial differences, the publication productivity of the samples across the two years, 2008 and 2014, were examined. These data are shown in Table 2. ANOVA results indicate that there were significant differences between 2008 and 2014 in the number of papers produced in the previous year of the survey, papers in foreign journals, papers in both foreign and national journals combined, edited books, and in the combined productivity. In all these variables the mean was higher for 2014 than for 2008. Statistically insignificant differences between 2008 and 2014 were found in the number of papers in national journals and in chapters in books.
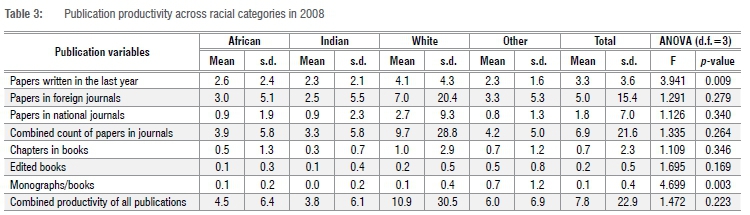
The publication productivity of the respondents across races is presented separately for the samples for 2008 and 2009 in Tables 3 and 4. In the number of papers written in the previous year of the survey, the African respondents reported a mean value below that of the sample for 2008. They also wrote fewer papers in comparison to their white colleagues but slightly more than their Indian colleagues (Table 3). Peer-reviewed papers were published more in foreign journals than in national journals. African academics published 3 papers in foreign journals, which was more than the number the Indian respondents published (by 0.5 paper), fewer than the white respondents (by 4 papers) and less than all respondents in the sample for 2008 (by 2 papers). In the number of papers published in national journals, the African respondents also lagged behind the sample and the white respondents, while they were on a par with the Indian respondents. When the papers in national and foreign journals were combined, Africans published fewer papers than the sample overall for 2008 by 3 papers and than whites by 5.8 papers. However, they published 0.3 papers more than their Indian peers.
The combined measure of all publication variables provides an overall picture of the full publication productivity of the respondents. In this measure for 2008, the African respondents were below the average for the combined sample and the white respondents (Table 3). The mean figure for Africans was 4.5 against 7.8 for the sample, 10.9 for the white respondents, and 3.8 for the Indians. This means they produced 43% less than an average respondent for the year, 59% less than the white respondents and 16% more than the Indian respondents.
The African respondents in the 2014 sample did well in the measures of productivity (Table 4). They wrote more papers than the sample as a whole (1.4 more), and than the Indian (1.8 more) and white (0.6 more) respondents. They published more papers in foreign journals than the sample (4.4 papers more), Indian (7.5 papers more) and white colleagues (3 papers more). In national journals, Africans published more than the sample and Indians (by 0.1 and 0.3 papers, respectively). In comparison with whites, the percentage was 0.1% lower for the Africans. They also published more chapters in edited volumes than the sample and the white respondents but about the same as the Indians. Finally, in the total publication productivity, African academics and researchers had a higher score than the sample mean, whites and Indians: about 83% over the Indians, 55% over the whites and 74% over the sample mean.
As seen in the analysis, there has been a substantial increase in the productivity of African and Indian respondents from 2008 to 2014. One reason for this increase can be attributed to the concerted efforts by the institutions to encourage them to develop academically, which forms part of the national policy to support previously disadvantaged groups. On the other hand, the small percentage of African respondents who were born in South Africa might raise questions about the intended or unintended consequences of the BEE (Black Economic Empowerment) policy of the government.
In order to determine the significant differences between the African respondents and other groups in the measures of publication productivity, we ran an independent f-test. Significant differences in the two-tailed f-test were obvious in the number of papers written in the previous year, papers in both national and foreign journals, combined measure for journal publications, edited books and in the total productivity. In all these measures, the white respondents reported higher mean values than did the Africans. In 2014, there were three measures that showed significant mean differences between Africans and whites: papers in foreign journals, the combined count of papers in journals, and total productivity of all publications. In all these three measures, Africans had a higher average than whites. No statistically significant difference was observed between Africans and Indians for any measure. This picture, however, changed in 2014: African respondents reported higher mean values than the other groups in four measures - papers written in the last year, papers published in foreign journals, combined count of journal papers, and combined total productivity.
The increase in the number of publications in foreign journals by African respondents, and to some extent Indian respondents, could be for two reasons. The first is the possibility of previous exposure to foreign journals by being born outside South Africa, and the second is the effect of overseas-based education and obtaining a degree overseas.
Publication productivity and influencing variables
The total publication productivity of the African respondents in 2008 was significantly and positively correlated with age, having a PhD, the number of years spent outside the country for educational and professional purposes, the number of collaborated years in career, and the number of collaborated partners in career (Table 5). Along with this, the number of publications in national and foreign journals and the number of co-published papers were significantly associated with total publication productivity. In 2014, the total publication productivity of Africans was influenced by the number of publications in foreign journals, co-published papers, having a PhD, and collaborated years in their career. In comparison to the African respondents, both Indian and white respondents showed similar correlations between the total publication productivity with papers in national and foreign journals and co-published papers. In the case of the white respondents for 2008, age, academic age, PhD and the time spent on doing research were important. These variables were not significant for the 2014 sample. The number of professional meetings attended overseas, collaborated years and collaborated partners also had a positive effect on the total productivity of white respondents in 2008, but only collaborated partners had an association in 2014. Among the Indian respondents in 2008, three factors - namely having a PhD, the number of overseas professional meetings attended and collaborated years - were significant along with papers in national and foreign journals and co-published papers. In 2014, the total publication productivity of the Indian respondents was positively affected by papers in foreign journals, co-published papers, the number of overseas professional meetings attended in the previous 5 years and collaborated partners in their career.
Productivity is affected by rank, age, academic age, gender, marital status, race, highest degree, exposure to overseas education, and collaboration.
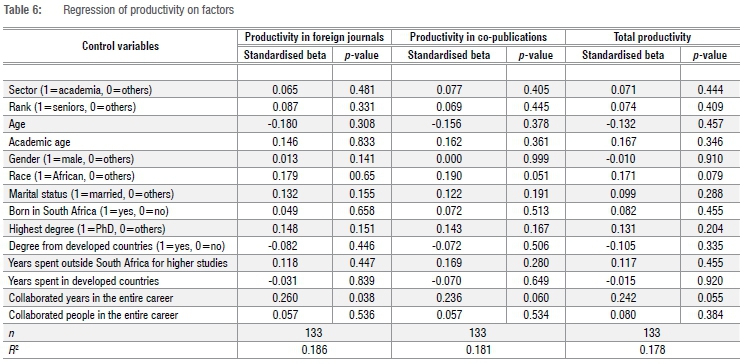
In order to explore the influence of these factors we ran regression of productivity on the selected control variables. Multicolinearity was checked for highly correlated variables. Three models with their standardised beta coefficients and significance are presented in Table 6. The first model on the productivity of publications in foreign journals indicates that two factors - race and collaborated years - are positively correlated. The model explains 19% of variance in the productivity of publications in foreign journals. In agreement with the previous findings, African respondents were correlated with their publication productivity in foreign journals. It is also evident that the number of collaborated years in a person's career is positively correlated with their publications in foreign journals. The second and third models relating to the productivity of co-publications and total productivity also showed significant correlation of the same two variables (race and collaborated years), and explains 18% of variance.
Discussion
The objective of this study was to analyse the relationship between the publication productivity and racial categories of academics and researchers in South African higher learning and research institutions. In particular, it was our intention to examine how transformation in the academic and research environment has occurred in South Africa. It should be noted that the sample was derived from only one of the provinces in South Africa and therefore the generalisability of the findings are limited.
The proportion of respondents in the sample did not correspond with the national demographic composition, in which Africans are the majority with 79.5% of the total population.19 This finding has been confirmed by several authors, including Govinder et al.20 and Habib and Morrow21. Staffing in the premier institutions in the country, as Soudien22 reported, remains largely white. Transformation in higher education is part of a broader process of South Africa's political, social and economic transition.23
There has been a positive change in the proportion of African respondents, particularly in higher-ranking positions, between 2008 and 2014. By 2014, the publication productivity of African respondents had changed for the better and in total productivity they performed better than the sample as a whole and the other racial categories. In a recent analysis, Mouton et al.24 reported that the proportion of papers by black authors increased substantially from 16% in 2005 to 31% in 2016, which is in line with our findings.
Conclusion
The analysis presented in this paper brings forth issues that relate to productivity and race in South Africa. Notable and significant changes in the publication productivity of scholars were evident in the two waves of data. Racial transformation is key for developmental goals, but is not occurring based on our sample. This has implications for the scientific personnel in the country and the efforts to address issues of skills shortage and capacity. The study showed that there were African respondents who had moved to South Africa to take up positions as academics and researchers. This, however, cannot be regarded as something that facilitates transformation. If that were the case, there should have been more native Africans and Indians than foreign nationals. We do not suggest that South Africa should be a closed society for foreign nationals, but it should focus more on its own people to achieve the ideals of transformation. One of the recommendations of the Soudien Committee was that there should be a GOOT (grow one's own timber) programme. This is pertinent to make transformation a reality and meaningful for both the higher education and research system and for the country.
Acknowledgement
We acknowledge funding received from the National Research Foundation (South Africa) to conduct this study.
Authors' contributions
R.S. conceptualised the study and collected the data. R.S. and M.N.G.M. analysed the data and wrote the draft and final versions.
References
1. Matthews AFP Physics publication productivity in South African universities. Scientometrics. 2013;95:69-86. https://doi.org/10.1007/s11192-012-0842-2 [ Links ]
2. North D, Zewotir T, Murray M. Demographic and academic factors affecting research productivity at the University of KwaZulu-Natal. S Afr J High Educ. 2015;25:1416-1428. [ Links ]
3. Eagan Jr MK, Garvey JC. Stressing out: Connecting race, gender, and stress with faculty productivity. High Educ. 2015;86:924-954. https://doi.org/10.1353/jhe.2015.0034 [ Links ]
4. Sooryamoorthy R. Internet technology and the epistemic strategies of scientists in post-apartheid South Africa: Race as a decisive factor. Tech Soc. 2015;40:73-81. https://doi.org/10.1016/j.techsoc.2014.08.003 [ Links ]
5. Abramo G, D'Angelo CA. How do you define and measure research productivity? Scientometrics. 2014;101:1129-1144. https://doi.org/10.1007/s11192-014-1269-8 [ Links ]
6. Prpic K. The publication productivity of young scientists: An empirical study. Scientometrics.2000;49:453-f90.https://doLorg/10.1023/A:1010541707878 [ Links ]
7. Bonaccorsi A, Daraio C. Age effects in scientific productivity: The case of the Italian National Research Council (CNR). Scientometrics. 2003;58:49-90. https://doi.org/10.1023/A:1025427507552 [ Links ]
8. Van Arensbergen P Van der Weijden I, Van den Besselaar FF Gender differences in scientific productivity: A persisting phenomenon? Scientometrics. 2012;93:857-868. https://doi.org/10.1007/s11192-012-0712-y [ Links ]
9. König CJ, Fell CB, Kellnhofer L, Schui G. Are there gender differences among researchers from industrial/organizational psychology? Scientometrics. 2015;105(3):1931-1952. https://doi.org/10.1007/s11192-015-1646-y [ Links ]
10. Mayer SJ, Rathmann JMK. How does research productivity relate to gender? Analyzing gender differences for multiple publication dimensions. Scientometrics. 2018;117:1663-1693. https://doi.org/10.1007/s11192-018-2933-1 [ Links ]
11. Abramo G, D'Angelo CA, Costa FD. Research collaboration and productivity: Is there correlation? High Educ. 2009;57:155-171. https://doi.org/10.1007/s10734-008-9139-z [ Links ]
12. Shin JC, Jung J, Postiglione GA, Azman N. Research productivity of returnees from study abroad in Korea, Hong Kong, and Malaysia. Minerva. 2014;52:467-487. https://doi.org/10.1007/s11024-014-9259-9 [ Links ]
13. Duque RB, Ynalvez M, Sooryamoorthy R, Mbatia Fp Dzorgbo D-B, Shrum W. Collaboration paradox: Scientific productivity, the internet, and problems of research in developing areas. Soc Stud Sci. 2005;35:755-785. https://doi.org/10.1177/0306312705053048 [ Links ]
14. Lee S, Bozeman B. The impact of research collaboration on scientific productivity. Soc Stud Sci. 2005;35:673-702. https://doi.org/10.1177/0306312705052359 [ Links ]
15. Sooryamoorthy R. Publication productivity and collaboration of researchers in South Africa: New empirical evidence. Scientometrics. 2014;98:531-545. https://doi.org/10.1007/s11192-013-0990-z [ Links ]
16. Sooryamoorthy R. Transforming science in South Africa: Development, collaboration and productivity. Hampshire and New York: Palgrave Macmillan; 2015. [ Links ]
17. Fukuzawa N. An empirical analysis of the relationship between individual characteristics and research productivity. Scientometrics. 2014;99:785-809. https://doi.org/10.1007/s11192-013-1213-3 [ Links ]
18. Lee DH. Predicting the research performance of early career scientists. Scientometrics. 2019;121:1481-1504. https://doi.org/10.1007/s11192-019-03232-7 [ Links ]
19. Statistics South Africa. Mid-year population release 2011. Pretoria: Statistics South Africa; 2011. [ Links ]
20. Govinder KS, Zondo NP Makgoba MW. A new look at demographic transformation for universities in South Africa. S Afr J Sci. 2013;109:86-96. http://dx.doi.org/10.1590/sajs.2013/20130163 [ Links ]
21. Habib A, Morrow S. Research, research productivity and the state in South Africa. Transformation. 2006;62:9-29. https://doi.org/10.1353/trn.2007.0006 [ Links ]
22. Soudien C. Transformation in higher education: A briefing paper. Johannesburg: Development Bank of Southern Africa; 2010. [ Links ]
23. South African Department of Education. Education White Paper 3: A programme for the transformation of higher education. Pretoria: Department of Education; 1997. [ Links ]
24. Mouton J, with Basson I, Blanckenber J, Boshoff N, Prozesky H, Redelinghuys H, et al. The state of the South African research enterprise. Stellenbosch: DST-NRF Centre of Excellence in Scientometrics and Science, Technology and Innovation Policy, Stellenbosch University; 2019. [ Links ]
 Correspondence:
Radhamany Sooryamoorthy
sooryamoorthyr@ukzn.ac.za
Received: 21 Aug. 2019
Revised: 28 Nov. 2019
Accepted: 21 Dec. 2019
Published: 26 Mar. 2020
Editors: Jane Carruthers, Hester du Plessis
Funding: National Research Foundation (South Africa)

