


Services on Demand
Article
 English (pdf)
 Article in xml format
 Article references
Indicators

Related links
-
 Cited by Google
 -
 Similars in Google
Share

 Permalink
South African Journal of Science
On-line version ISSN 1996-7489
Print version ISSN 0038-2353
S. Afr. j. sci. vol.116 n.1-2 Pretoria Jan./Feb. 2020
http://dx.doi.org/10.17159/sajs.2020/5635
RESEARCH ARTICLE
A revised approach for estimating informally disposed domestic waste in rural versus urban South Africa and implications for waste management
Clare RodsethI; Philippa NottenII; Harro von BlottnitzI
IDepartment of Chemical Engineering, University of Cape Town, Cape Town, South Africa
IIThe Green House, Cape Town, South Africa
ABSTRACT
A major limitation to improved waste management in South Africa lies in the paucity of reliable waste data and the exclusion of the contribution of the informal sector from reporting. Due to the disparity in the provision of formal waste management services across households in South Africa, omission of the quantified contribution of informal management practices leads to an inaccurate representation of waste management practices in existing waste data repositories. Given the potentially adverse social and environmental consequences of unregulated waste management practices, a lack of representation thereof has the potential to underestimate impacts. As of 2015, 31% of households are reported as lacking a basic refuse removal service; however, this number cannot necessarily be applied directly to waste quantities, given the regional and socio-economic differences that occur in per capita waste generation rates. The total quantity of domestic waste in South Africa and fraction disposed informally are estimated here, taking into account differences in waste generation rates based on income and settlement type. The characterisation and quantification of unregulated waste streams is beneficial in assessing the magnitude of the problem and, where necessary, identifying mitigation action. The results obtained show that 29% (3.67 million tonnes per annum) of domestic waste generated is not collected or treated via formal management options. Of this waste, the majority (85%) is generated in rural areas. The most common waste management option for unserviced households is a private dump. An estimated 94% of households in unserviced rural areas make use of private dumps, while in unserviced urban and metro areas this decreases to 74% and 71% of households, respectively. Illegal dumping is the next most common waste management option for unserviced areas. The proportion of household waste disposed of via illegal dumping ranges from an estimated 5% for unserviced rural households to 27% in metro areas with the balance made up by 'other' disposal/treatment options.
SIGNIFICANCE:
•The proportion of domestic waste that is mismanaged in South Africa is significant and its exclusion from national waste estimates leads to the inaccurate representation of waste management practices in existing waste data repositories. Unregulated waste management practices can have potentially adverse social and environmental consequences, i.e. leakage into the environment, or if burnt, the generation of atmospheric pollutants.
•The quantity of mismanaged waste and distribution of this waste between different management options is important for the development of improved National Waste Management Plans.
•Waste generation rates and subsequent waste quantities estimated using this approach are strongly dependent on both income and settlement type (rural vs urban). For countries such as South Africa where there exist large disparities in income and population distribution, understanding waste generation as a function of these factors is critical for accurately modelling waste quantities
Keywords: informal disposal, dumping, service delivery, inequality
Introduction
According to global standards, South Africa is classified as a developing country. However, in many respects this classification is contentious. As the biggest economy of the southern African region1, South Africa reflects a number of the characteristics of a developed country with a high level of urbanisation, wealth and infrastructure. However, this level of development is unequally distributed amongst the population, and a notable disparity exists from both an economic and social perspective. The effect of this disparity is particularly evident in service delivery. According to the results of the Community Survey 20162, households in rural municipalities typically receive fewer and inferior services than households in more affluent, urban municipalities3. Whilst various factors contribute towards this discrepancy, significant factors include the historical inequalities in the provision of development support and services (evident predominantly in former homeland areas) due to the country's political past, the high level of poverty (resulting in the inability to pay for services), and the practical and financial constraints associated with extending services to remote rural or inaccessible informal areas.3
Waste management, in particular, illustrates this disparity. Within South Africa, waste management is the responsibility of local government; however, large discrepancies exist in the level of service provided by different municipalities. Where most larger municipalities provide a complete service, including waste collection and appropriate disposal (albeit not consistently meeting regulated environmental controls), many smaller municipalities - typically rural - lack the capacity for any form of waste service delivery.4 While the range in waste service delivery is most notable between urban and rural municipalities, it has been suggested that variation can, and does, occur across provinces, district councils and local municipalities.3 For example, while relatively affluent urban areas typically receive a complete waste service, certain urban communities - specifically in informal settlements - may lack even basic refuse removal.5 This disparity can in part be attributed to the fundamental, unserviceable nature of informal settlements, where limited road access, high settlement density, poor spatial planning and layout of settlements, and illegal land tenure complicate or prohibit the delivery of waste collection services.6
Given the disparity in the provision of formal waste management services across the country, the determination of a representative waste scenario (as for example needed for product environmental stewardship) for South Africa is complicated, and requires consideration of both formal and informal management scenarios. A lack of formalised waste management can result in unregulated management practices, i.e. waste management or disposal occurring outside of, or separate to, formal waste systems. These include for example, illegal dumping, uncontrolled burning, the operation of illegal dumpsites, and unlicensed landfills.7 Such practices typically provide poor management and containment of the waste stream, resulting in a high potential for leakage of waste and contaminants into the environment.7
In South Africa, national waste estimates are typically modelled, based on per capital waste generation rates and waste characterisation and distribution studies. The allocation of national waste quantities between management systems tends to be limited to formal systems such as municipal landfill sites and recycling facilities. Given the potentially adverse social and environmental consequences of unregulated waste management practices (i.e. leakage into the environment, or if burnt, the generation of atmospheric pollutants), the lack of recognition (or distinction) of informal, unregulated waste management practices in waste studies has the potential to underestimate impacts. The characterisation and quantification of unregulated waste streams can therefore be beneficial in assessing the magnitude of the problem and, where necessary, identifying mitigation action.
It is therefore the objective of this paper to report on a model developed to inspect formally reported domestic waste quantities generated in South Africa by including the portion managed via informal practices, as well as to identify what fraction of domestic waste is disposed of in this manner and where this disposal may occur.
Review of waste services and generation rates
The occurrence of informal waste management practices is common amongst developing countries. Unlike developed countries, where a high level of wealth and infrastructure supports the provision of a complete and efficient waste service with an emphasis on waste diversion and material/energy recovery8, waste management in developing countries is typically characterised by ineffective or partial waste service provision9. The lack of consistent waste services, combined with limited environmental and waste awareness among the general public, can result in the occurrence of practices such as illegal dumping, waste scavenging and littering.9 Informal waste management practices are fast falling under global scrutiny, as increasing waste generation rates in developing countries, coupled to population growth, increases the threat that poor waste management practices can pose to both public health and the environment.10 Understanding the various waste systems in operation and the magnitude of each is an important first step in addressing the challenges of informal waste management; however, the availability of the necessary waste data is frequently lacking in developing countries.8
Indeed, in South Africa the lack of data availability poses a key challenge in the characterisation and quantification of unregulated waste. However, the challenge of data availability is not limited to informal practices, and even for so-called formal waste management there is a paucity of consistent and reliable waste data.11 For example, the South African Waste Information System was established in terms of Section 60 of the National Environmental Management Waste Act (Act 59 of 2008)12 with the objective of addressing the paucity of reliable waste data through the provision of a national repository of waste data for both organs of state and the public. However, the system is not yet fully representative, with only a proportion of active facilities reporting data, and furthermore, doing so with a questionable accuracy. In lieu of a fully functioning and verified national waste repository, the most comprehensive source of quantified waste data is that contained in the National Waste Baseline Report.11 However, not only are these results somewhat outdated, but they are also of unspecified precision and partly based on questionable assumptions.13
A further limitation in the South African Waste Information System data in providing a quantified national waste estimate lies in its omission of informally managed waste, resulting in the potential under-representation of both waste quantities and waste management practices. The quantification of national waste tonnages is therefore likely to be more accurate in the National Waste Baseline Report11 given that this is modelled from per capita waste generation rates (as opposed to collection rates). However, the allocation of waste in this report is limited to formal management systems, thus providing a limited view of waste management practices in the country. The disparity in the level of waste services between South African households highlights the necessity of accounting for informal waste when developing a national waste estimate. Considering the results of the General Household Survey 20155 (shown in Table 1), if it is assumed that any form of regular waste collection service and centralised communal dumps constitute a formal waste management service, with the latter three categories shown in Table 1 constituting informal waste management, then overall, only approximately 69% of households in South Africa receive some form of formal waste management service. The results of this survey also show that there are large discrepancies between waste services provided to households in rural and urban areas and, to a lesser extent, between urban and metropolitan areas. Considering waste service delivery per settlement type (i.e. services received by households in rural, urban and metropolitan areas) shows that 94.5% and 87% of households in metropolitan and urban areas, respectively, receive some form of waste management service, while in rural areas this decreases to just 13%.
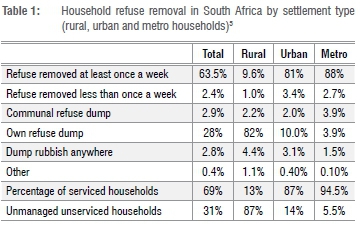
It should be noted that access to a formal waste management service does not preclude unregulated waste management practices from occurring. Illegal dumping can occur across serviced and unserviced areas, particularly for construction and demolition waste and garden waste. Recognition of the prevalence of unregulated waste management therefore challenges the assumption that the latter three categories in Table 1 occur exclusively in unserviced areas. For the sake of accuracy, the necessity of adapting the approach to allow for overlap in management options between serviced and unserviced areas should be considered. However, the quantity of waste in serviced areas falling into one of these three informal management categories is likely to be relatively low for the following reasons: (1) where formal waste services are available these are likely to be used and (2) illegally dumped waste in serviced areas will be recovered and thus enter the formal waste stream. It is unlikely that this allowance would make a significant difference to the overall distribution of waste between formal and informal streams.
Following the assumption that private refuse dumps, dumping, and 'other' can be considered informal waste management, the relative uptake of informal options by households in different settlement types is illustrated in Figure 1.
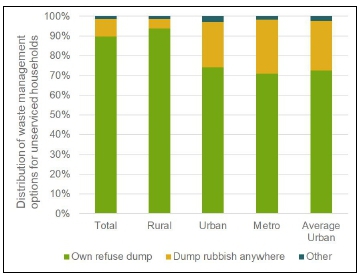
Figure 1 suggests that the most common waste management option for unserviced households is the use of a private refuse dump. The use of private dumps by unserviced households is most prominent in rural areas (94%) but is also relatively high in urban and metro areas (74% and 71%, respectively). Illegal dumping of household waste ranges from 5% for unserviced rural households to 27% in metro areas, with the balance made up by 'other' disposal/treatment options. Although further detail with regards to the nature of these management options is limited, it can be assumed that private refuse dumps lack any form of engineering or control (essentially an open dump) and 'other' refers to treatment such as open burning. Whilst Figure 1 and Table 1 provide information with regard to the service level received by different households, this should not necessarily be applied directly to waste quantities, given the regional and socio-economic differences that occur in per capita waste generation rates.14 In other words, although approximately 31% of South African households do not receive a formal waste management service, this figure does not necessarily equate to 31% of the total domestic waste generated in the country. Obtaining accurate waste generation rates that are sensitive to income and settlement type is therefore an important aspect of waste modelling.
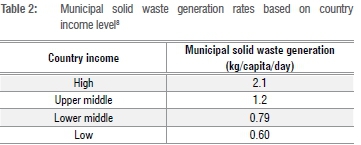
In the absence of a fully functioning and representative national waste data repository, per capita waste generation rates provide a cost-effective and quick estimate of waste quantities without undertaking primary data collection.11 Although this method provides an indication of total waste generation rather than the management distribution thereof, it is a useful starting point for determining waste generation volumes and assessing the recovery potential for different waste types. Whilst regional per capita municipal solid waste generation rates have been proposed by both the Intergovernmental Panel on Climate Change15 and Hoornweg and Bhada-Tata8, both sources acknowledge the lack of available and accurate waste data in developing countries - particularly in Africa - as prohibitive in the development of waste generation rates for these regions. Following the limitations in obtaining regionalised waste generation data for certain countries/regions, country income-specific waste generation rates have been proposed by Hoornweg and Bhada-Tata8 (Table 2) and provide a useful alternative to waste modelling in countries lacking regionalised rates.
Despite the benefit of waste generation rates in terms of quantifying waste, the availability of South African specific rates is limited. Few independent waste generation studies have been undertaken in South Africa and of those that exist, limited socio-economic distinction in the waste generation rate has been made. A comparison of independent studies reporting South African specific waste generation rates is shown in Table 3. This comparison indicates the variability in existing waste generation rates, with different sources providing a different level of disaggregation in terms of regional and socio-economic influences. While it is unlikely that Table 3 provides an exhaustive summary of available domestic waste generation rates for South Africa, it provides further indication of the disparate and inconsistent nature of waste reporting at a national level.
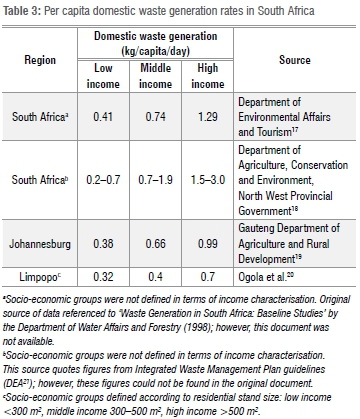
Comparison of Table 2 and Table 3 suggests that there is a wide range in South African waste generation rates when using income based population grouping. This discrepancy is in part due to variations in the definition of socio-economic groupings used. Given the high income inequality in South Africa, conducting a reasonable grouping of individual or household income presents a particular challenge. The development of income groupings to establish a representative South African 'middle class' is particularly complicated, with the low average and median levels of income and wide income distribution being recognised as particularly challenging in this regard.16
Another factor contributing to this variability is the definition of the waste generation rate in terms of what waste it encompasses. Waste generation rates frequently vary in definition, with some sources reporting a municipal waste generation rate, some a domestic waste generation rate, and others an unspecified waste generation rate. This variability challenges the translation of this information into comparable waste estimates. It is unclear whether domestic waste is comparable to municipal waste, and indeed to what extent municipal waste is representative of general waste categories. Extrapolating the domestic or municipal component of waste determined using waste generation rates to a national waste estimate is particularly challenging as it is dependent on accurate waste characterisation data.
The quantified mapping of waste flows in South Africa is further challenged by the interaction between the informal and formal waste sectors. Although it is a requirement stipulated in Chapter 5 of the National Environmental Management: Waste Act, No. 59 of 200812 that all waste management activities with the potential to cause a detrimental effect on the environment obtain a waste management licence, the current number of unlicensed waste management facilities is unknown. In 2006, according to the Department of Environmental Affairs and Tourism (DEAT)17, 760 sites (both illegal and legal) were operating without a permit. This figure excludes small, unrecorded sites in rural areas, and hence is likely to be higher with their inclusion. This implies that waste that is formally collected can be disposed of in either municipal or privately owned and managed, but unlicensed, landfill sites or treatment facilities. Furthermore, waste which is informally disposed of can be recovered and enter into the formal waste stream. This is typically seen in the municipal clearing of dumped waste, or the informal scavenging of recyclable materials from dumped or littered waste.
It should be considered that although the distinction between formal and informal waste management based on waste service delivery is convenient, it does not necessarily provide an indication of 'good' and 'bad' environmental performance. For example, while the environmental impacts of landfilling can be controlled if operations are adequately managed, so-called formal landfill sites can vary in terms of design and management, with shortcomings in siting, design and operation presenting a significant potential for pollution.22 Quantifying this mismanaged formal waste fraction is in itself difficult, owing to the paucity of consistent and reliable waste data.11
Approach for the estimation of informally managed household waste
Given the lack of quantified information regarding waste managed outside of formal waste streams in South Africa, an estimate of the quantity of household waste managed informally via unregulated waste management practices was developed. The starting point in this analysis was the distribution of waste management services in South Africa, as available in the General Household Survey 20155 (Table 1). As previously noted, the distribution of waste services does not necessarily translate into an equivalent distribution of waste quantities owing to regional and socio-economic differences in the per capita waste generation rate. Therefore, in order to estimate the total quantity of domestic waste generated that is informally managed in South Africa, a model was developed taking into account differences in waste generation rates based on income and settlement type.
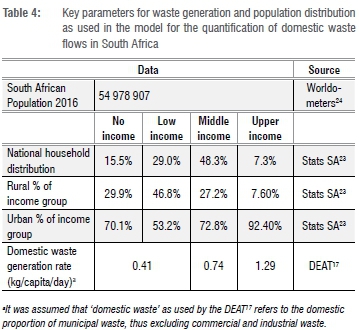
In addition to the national distribution of waste management services, key modelling parameters included national waste generation rates and population statistics. The waste generation rates used in this model were those provided by the DEAT17 (Table 3). Despite being based on 1998 waste generation and population statistics, in lieu of more updated information, these rates were considered to be the most representative of national waste generation rates, as they are recommended for use in the determination of municipal waste quantities in the national guidelines for the development of integrated waste management plans.21 Household income distribution was as reported by Stats SA.23 The key modelling parameters considered (excluding national waste service delivery, as available in Table 1) are shown in Table 4.
The intention of this model was to provide an estimate of domestic waste flows and thus several simplifying assumptions were used. Key assumptions used in this model were.
1.Household settlement (rural, urban and metro) distribution and income distribution based on number of households in each category could be used as a proxy for urban, rural and metro population distribution and income distribution, even though rural households typically have a higher number of inhabitants than households in urban and metropolitan areas.
2.Statistical data for 2011 and 2015 are representative of the 2016 status quo with regard to household waste service delivery and income distribution between settlement types.
3.Waste generation rates in no-income and low-income population groups are directly comparable.
4.The level of waste service delivery in rural areas is consistent across income groups.
5.In urban and metro areas, 100% of unserviced households fall within the no-income/low-income population group.
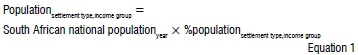
The first step in the modelling approach required the determination of the population per income group and settlement type. This was undertaken using Equation 1, with the necessary parameters obtained from Table 4.
The next step required the determination of total domestic waste generation per income group and settlement type. This was undertaken using Equation 2, utilising the data shown in Table 4 and the results obtained from Equation 1.

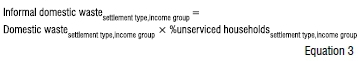
The final step required the estimation of the informal proportion of waste per income group and settlement type. This was based on the distribution of waste services (Table 1). It was assumed that any form of regular waste collection service and centralised communal dumps constitute a formal waste management service, with the last three categories shown in Table 1 constituting informal waste management. Informal domestic waste generation per income group and settlement type was then calculated according to Equation 3. Further assumptions regarding the distribution of waste services are as reported in the list of assumptions provided above. Equation 3 was applied to each income group for rural and urban settlements.
Results and discussion
The resulting model provides an estimate for both total domestic waste generation and the amount of waste that is informally managed in South Africa. The results obtained from this model are shown in Table 5.
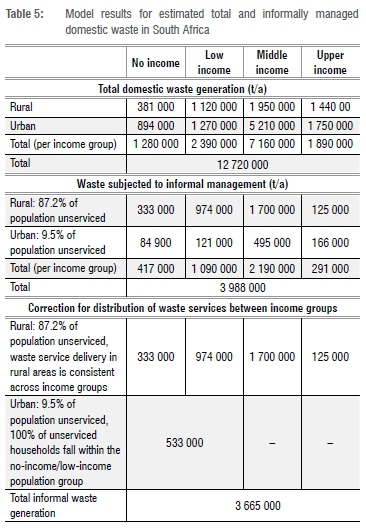
If income-specific waste generation rates are considered, it is estimated that South Africa generates approximately 12.7 million tonnes of domestic waste per annum. This amount is comparable to the 15.9 million tonnes of domestic waste (GW01, excluding commercial and industrial waste) reported in the National Waste Baseline Report11 for 2011. The higher value reported in the Baseline Report is likely due to the calculation approach, which applied an average per capita waste generation rate across the population, unlike the model approach where different rates were applied by population grouping. Using the model output and 2016 population statistics, an average per capita domestic waste generation rate for South Africa can be estimated at 0.63 kg/capita/day. Comparison of this figure to the domestic waste generation rates reported by the DEAT17 (Table 3) suggests that this generation rate lies between that of low- and middle-income groups. This provides a more realistic estimate for average per capita waste generation in South Africa as opposed to using the arithmetic mean of the domestic waste generation rates reported by the DEAT17 (0.81 kg/capita/day), which suggests that average waste generation lies between middle-income and high-income groups. Given the income inequality in South Africa, the arithmetic mean is unlikely to be representative of the actual mean, as a large proportion of the population falls below the middle-income grouping. Indeed, if the arithmetic mean is used to determine annual waste generation in South Africa, this results in an estimated 44 million tonnes of domestic waste. This is notably higher than the quantity reported by either the National Waste Baseline Report11 or that estimated by means of the modelled approach.As shown in Table 5, accounting for both settlement type and income distribution suggests that informal household waste generation in South Africa is in the order of 3.67 million tonnes. Comparison of this figure to the 12.7 million tonnes estimated for total domestic waste generation suggests that approximately 29% of domestic waste generated in South Africa is not collected or treated via formal management options. Although the model was developed to take into account income specific waste generation rates and the population and income distribution of different settlement types, it was assumed that waste generation rates were not affected by settlement type. While settlement type has been recognised as a factor in terms of waste generation14, this observation was not applied to the model due to limitations in the availability of national waste generation rates accounting for both income and settlement type. The model output could be improved with further refinement of the waste generation rates used. However, this would require - amongst others - the development of more representative national waste generation rates.
In lieu of a more detailed estimate, the model result for domestic waste that is informally managed can be used in conjunction with Figure 1 to estimate the quantity of waste per management option utilised by unserviced households. This result is shown in Figure 2. According to this figure, the use of a private dump is the most common waste management option for unserviced households, with an estimated 3 million tonnes of waste disposed of annually in this way. It is important to note that the results in Figure 2 are intended as an approximation only and are based on a number of assumptions and a high level of uncertainty. All results presented should therefore be regarded as indicative rather than absolute and interpreted as such.
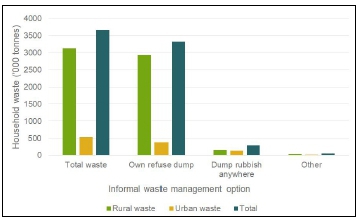
Given that the model result provides an estimate for domestic waste managed informally, it represents only a portion of the total informal general waste generated in South Africa. If all general waste is considered, the contribution of categories such as builder's waste (widely recognised as the most frequently dumped material) and commercial and industrial waste is likely to increase the estimated quantity of informal waste further. However, limited quantified information is available to obtain an estimate for such illegally dumped materials. Furthermore, given that the clearing of illegally dumped material is the responsibility of the municipality, such material is frequently re-incorporated into formal waste streams. Limited documentation of this recovered material further complicates the quantification of informal waste tonnages. A similar challenge exists with regard to quantifying both recovered and unrecovered litter. Despite the extent of littering being visually obvious in many parts of South Africa, the availability of studies which focus on the quantification and characterisation of litter are limited. Available studies also tend to represent litter occurring in a relatively defined area and, as such, have limited application to the national level.
Conclusion
Given the current limitations in the availability of accurate and reliable waste data at the national level, a model was described in this paper to develop a basic mapping of domestic waste flows in South Africa, providing an estimate for both formally and informally managed waste. The results suggest that 29% of domestic waste generated by weight in South Africa is not collected or treated via formal management options. Of this waste, the majority (85%) is generated in rural areas. For all settlement types, the most common waste management option for unserviced households is a private dump, with the remaining proportion of waste either dumped illegally or managed through alternative treatment such as uncontrolled burning. The quantification of informal waste flows not only contributes towards a more realistic representation of national waste flows and management practices, but further, given the potentially adverse social and environmental consequences of informal waste practices, clearly indicates the lack of a standard for domestic waste management in rural settings as a major problem.
The waste generation rate is a key parameter within the model. While the waste generation rates used in this model take into account differences in household income, no data were available to distinguish between those in rural and urban areas. The lack of reliable South African specific waste generation rates reflects the paucity of focused waste generation studies undertaken in the region. Therefore, given the sensitivity of this parameter to a variety of factors including settlement type, in order to improve the accuracy of the model, further investigation into waste generation rates reflecting both income and settlement type should be undertaken.
Acknowledgements
The financial support of the South African National Research Foundation's Global Change, Society and Sustainability Research Programme is gratefully acknowledged.
Authors' contributions
C.R.: Conceptualisation, methodology, data collection, data analysis, and writing. P.N.: Student supervision. H.v.B.: Conceptualisation and student supervision.
References
1.World Bank. The World Bank in Africa: Overview. Washington DC: The World Bank Group; 2018. Available from: http://www.worldbank.org/en/region/afr/overview [ Links ]
2.Statistics South Africa (Stats SA). Community survey 2016, statistical release P0301. Report number: 03-01-22. Pretoria: Stats SA; 2016. [ Links ]
3.Statistics South Africa (Stats SA). The state of basic service delivery in South Africa: In-depth analysis of the Community Survey 2016 data. Report No. 03-01-22. Pretoria: Stats SA; 2016. [ Links ]
4.Friedrich E, Trois C. Greenhouse gases accounting and reporting for waste management - a South African perspective. Waste Manag. 2010;30(11):2347-2353. https://doi.org/10.1016/j.wasman.2010.05.016 [ Links ]
5.Statistics South Africa (Stats SA). General household survey 2015. Pretoria: Stats SA; 2016. [ Links ]
6.Von der Heyde V. Towards a sustainable incremental waste management system in Enkanini: A transdisciplinary case study [dissertation]. Stellenbosch: Stellenbosch University; 2014. [ Links ]
7.Fiehn H, Ball J. Integrated waste management: Background research paper produced for the South Africa Environment Outlook Report on behalf of the Department of Environmental Affairs and Tourism. Unpublished report 2005. [ Links ]
8.Hoornweg D, Bhada-Tata P. What a waste: A global review of solid waste management. Washington DC: Urban Development and Local Government Unit, World Bank; 2012. [ Links ]
9.Matete N, Trois C. Towards zero waste in emerging countries - a South African experience. Waste Manag. 2008;28(8):1480-1492. https://doi.org/10.1016/j.wasman.2007.06.006 [ Links ]
10.Minghua Z, Xiumin F, Rovetta A, Qichang H, Vicentini F, Bingkai L, et al. Municipal solid waste management in Pudong new area, China. Waste Manag. 2009;29(3):1227-1233. https://doi.org/10.1016/j.wasman.2008.07.016 [ Links ]
11.Department of Environmental Affairs. National waste information baseline report. Pretoria: Department of Environmental Affairs; 2012. [ Links ]
12.Act No. 59 of 2008, South Africa. National Environmental Management: Waste Act. [ Links ]
13.Von Blottnitz H. Waste management reform and the green economy: When will they meet? In: Swilling M, Musango J, Wakeford J, editors. Greening the South African economy: Scoping the issues, challenges and opportunities. Cape Town: UCT Press; 2016. p. 252-267. https://doi.org/10.18820/2415-0495/trp72i1.8 [ Links ]
14.Bogner J, Pipatti R, Hashimoto S, Diaz C, Mareckova K, Diaz L, et al. Mitigation of global greenhouse gas emissions from waste: Conclusions and strategies from the Intergovernmental Panel on Climate Change (IPCC). Fourth assessment report of Working Group III (Mitigation). Waste Manag Res. 2008;26(1):11-32. https://doi.org/10.1177/0734242x07088433 [ Links ]
15.Intergovernmental Panel on Climate Change. Solid waste disposal. In: Eggleston S, Buendia L, Miwa K, Ngara T, Tanabe K, editors. 2006 IPCC guidelines for national greenhouse gas inventories. Volume 5. Hayama: Institute for Global Environmental Strategies; 2006. p. 3.1-3.40. [ Links ]
16.Visagie J. Who are the middle class in South Africa? Does it matter for policy? Econ 3x3 [website on the Internet]. c2013 [cited 2018 Apr 22]. Available from: http://www.econ3x3.org/article/who-are-middle-class-south-africa-does-it-matter-policy [ Links ]
17.South African Department of Environmental Affairs and Tourism (DEAT). South Africa environment outlook. A report on the state of the environment. Pretoria: DEAT; 2006. [ Links ]
18.North West Provincial Government Department of Agriculture, Conservation and Environment. Provincial integrated waste management plan (PIWMP) status quo report. Rustenburg: North West Department of Agriculture, Conservation and Environment; 2008. [ Links ]
19.Gauteng Department of Agriculture and Rural Development. General waste minimisation plan for Gauteng. Johannesburg: Gauteng Department of Agriculture and Rural Development; 2009. [ Links ]
20.Ogola J, Chimuka L, Tshivhase S. Management of municipal solid wastes: A case study in Limpopo Province, South Africa. In: Kumar S, editor. Integrated Waste Management. Volume I. IntechOpen; 2011. https://doi.org/10.5772/18655 [ Links ]
21.South African Department of Environmental Affairs (DEA). Guideline for the development of Integrated Waste Management Plans (IWMP). Unpublished; no date. [ Links ]
22.South African Department of Water Affairs and Forestry (DWAF). Minimum requirements for waste disposal by landfill. Pretoria: DWAF; 1998. [ Links ]
23.Statistics South Africa (Stats SA). Census 2011. Income dynamics and poverty status of households in South Africa. Report number: 03-10-10. Pretoria: Stats SA; 2015. [ Links ]
24.Worldometers. South African population (live) [database on the Internet]. c2017 [cited 2018 Apr 22]. Available from: http://www.worldometers.info/world-population/south-africa-population/ [ Links ]
 Correspondence:
Clare Rodseth
clare.rodseth@gmail.com
Received: 08 Nov. 2018
Revised: 17 Oct. 2019
Accepted: 18 Oct. 2019
Published: 29 Jan. 2020
Editors: Nic Beukes; Hester du Plessis; Yali Woyessa
Funding: National Research Foundation (South Africa)

