


Servicios Personalizados
Articulo
 Inglés (pdf)
 Articulo en XML
 Referencias del artículo
Indicadores

Links relacionados
-
 Citado por Google
 -
 Similares en Google
Compartir

 Permalink
South African Journal of Science
versión On-line ISSN 1996-7489
versión impresa ISSN 0038-2353
S. Afr. j. sci. vol.115 no.9-10 Pretoria sep./oct. 2019
http://dx.doi.org/10.17159/sajs.2019/5737
RESEARCH LETTER
Natural ventilation as a means of airborne tuberculosis infection control in minibus taxis
Munyaradzi. T. Matose; Mladen Poluta*; Tania S. Douglas
Division of Biomedical Engineering, University of Cape Town, Cape Town, South Africa
ABSTRACT
Airborne infection control measures are used extensively in health-care settings to curtail the spread of airborne infectious diseases. Few such measures are applied in public congregate spaces outside health facilities, such as those associated with public transport. In minibus taxis - a popular form of public transport in South Africa - poor ventilation creates conditions that allow for transmission of airborne diseases, particularly tuberculosis. In this study, we focused on developing quantitative ventilation profiles for the 16-seater Toyota Quantum Ses'fikile model commonly used in the Cape Town metropole. We studied the ventilation rates achievable in an occupied taxi under varying operational conditions, such as driving speed and open window configurations, which were based on observations made during preliminary taxi journeys. Two open-window configurations were found to provide ventilation rates close to or exceeding WHO recommended per-person requirements for high-risk clinical areas and are therefore likely to be effective in reducing the risk of tuberculosis transmission.
SIGNIFICANCE:
•The results obtained augment the limited data available on the role that natural ventilation can play in reducing TB transmission in minibus taxis.
•Ventilation rates were shown to depend on both the taxi speed and specific open window configuration, countering the notion that simply opening a random selection of windows provides adequate reduction in the transmission risk
Keywords: ventilation rate, airborne infection control, tracer-gas concentration, window configuration, transmission risk
Introduction
With some of the highest recorded infection and prevalence rates globally,1 tuberculosis (TB) is a leading cause of both mortality and morbidity in South Africa, and particularly so in the Western Cape. From an infection control perspective, individuals most likely to transmit TB are those who are infected but undiagnosed and not receiving treatment and therefore highly contagious.2 By the time many of these individuals present themselves at health-care facilities, they may inadvertently have transmitted TB to several people.
In addressing the TB burden in South Africa,3 it is essential to consider the congregate settings outside health-care facilities as hotspots of transmission. A study conducted in a high incidence township in Cape Town estimated that transmission of TB outside the households of infected individuals contributed significantly to the spread of the disease.4 Public transport studies conducted in Cape Town, Peru and Tanzania have shown that the risk of transmission in modes such as minibus taxis is high.5-7 In South Africa, minibus taxis are an important component of the public transport system, accounting for 68% of public transport commutes to work nationally.8 In the Western Cape, minibus taxis were found in a 2013 survey8 to account for 39% of public transport commutes to work, followed by trains and buses at 34% and 18%, respectively.
In this study, ventilation refers to bringing and distributing outdoor air into or out of the interior space using natural forces such as wind pressures, thereby diluting the number of infectious particles within the indoor space.1 In minibus taxis, ventilation is typically achieved through window opening during transit and door opening when passengers enter and exit the vehicle. Poor ventilation increases risk to passengers as conditions within the minibus taxi allow for transmission of airborne diseases. Studies exploring the achievable ventilation in taxis are limited5-7,9 and the ventilation resulting from the combined changes in taxi speeds and window opening configurations has not been examined.
Both experimental and mathematical methods have been used in the study of airborne disease transmission risk in congregate settings (health care, public transport, prisons and public buildings)10-14, and include airflow measurement and visualisation techniques15, tracer gas techniques9, the Wells-Riley deterministic model16 and modifications to that model17,18, dose-response numerical models19,20, and computational fluid dynamics modelling21. A 2012 study by Johnstone-Robertson5 investigated the risk of TB transmission in minibus taxis in South Africa by monitoring the CO2 concentration as an indicator for ventilation (or lack thereof). Ventilation characteristics were explored in a stationary taxi for four ventilation scenarios using repeated CO2 tracer gas tests and the Wells-Riley numerical model to determine the transmission probabilities for these scenarios. The study by Johnstone-Robertson5 showed that ventilation rates from 1.31 L/s to 25.09 L/s could be achieved in a stationary taxi with three-open-window configurations.
In the current study, we examined the ventilation profiles associated with varying open-window configurations in operational transit, and aimed to determine whether ventilation rates above those recommended by the World Health Organization (WHO) could be achieved. This study differed from previous studies5-7,9 in that the number of occupants in the taxi was controlled, the taxi speed was controlled and monitored, and the distinct open window configurations used were based on observed configurations in operational taxis.
Methods
Prior to establishing minibus taxi operating conditions for testing, 23 preliminary journeys were taken in taxis operating within the Cape Town metropole during which operating conditions that would potentially affect ventilation were recorded. The average taxi speeds on highways and main roads, passenger occupancy (the number and location of passengers within the taxi) between peak morning and late afternoon rush hours, open window patterns (configurations, opening and closing frequency, duration of opening and the degree of window opening), as well as the routes taken, were recorded on journeys to and from the Cape Town central business district. From the preliminary data, the experimental taxi speeds, window configurations and passenger occupancy were determined.
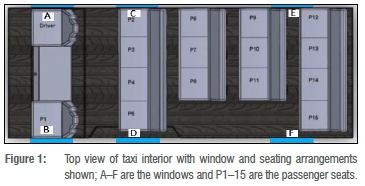
CO2 tracer gas decay tests were used to estimate ventilation rates. The experiments were carried out in a fully occupied minibus taxi (emulating high passenger occupancy rates observed in the preliminary journeys), with seating arrangement shown in Figure 1. The aim was to determine the range of ventilation rates achievable by changing the open window configurations at operating speeds of 40 km/h, 80 km/h and 100 km/h.
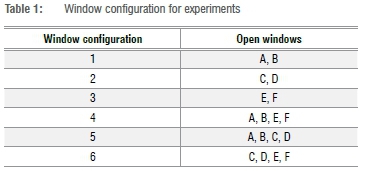
Six window configurations (three double and three multiple open window configurations), shown in Table 1, were tested to provide a range of ventilation rates; the windows were always opened fully during the experiments. Taxi occupants comprised the driver, a researcher and 14 volunteer participants. Each configuration was tested twice at each speed.
CO2 decay was measured with a data-logging CO2/humidity/temperature sensor (Extech®SD800) with a resolution of 1 ppm, accuracy of ±40 ppm (<1000 ppm), ±5% reading (>1000 ppm) and range of 0-4000 ppm. The data logger was placed centrally, where the CO2 concentration is highest. The use of a single CO2 sensor was a limitation in the study, as more sensors would have yielded localised ventilation estimates that could reveal the higher risk seat positions with lowest ventilation rates per window configuration. The taxi speed and position were tracked using a front-mounted GPS unit linked to a separate data logger. The sampling frequency for the CO2 sensor was set at 0.2 Hz and that of the GPS unit was set at 1 Hz, the highest that each would allow.
The CO2 concentration was allowed to rise to above 2000 ppm when the windows were closed, while the participants fanned the air to ensure uniform CO2 distribution; they then opened the windows to create each configuration while the taxi maintained the test speed. The gas was allowed to decay for 5 min or until the concentration decreased to within 200 ppm of baseline concentrations. The process was repeated at the same speed until all the test window configurations were completed within a 1-h experimental time frame. The taxi travelled on routes that would allow movement at the predetermined speeds: 40 km/h off the highway (non-residential roads) and both 80 km/h and 100 km/h on the highway. Ventilation was expected to increase as either the taxi speed increased or the total number of open windows increased.
The straight-line slope of the natural log (ln) of the CO2 concentration decay curve was used to calculate ventilation rate for each window configuration.
Results
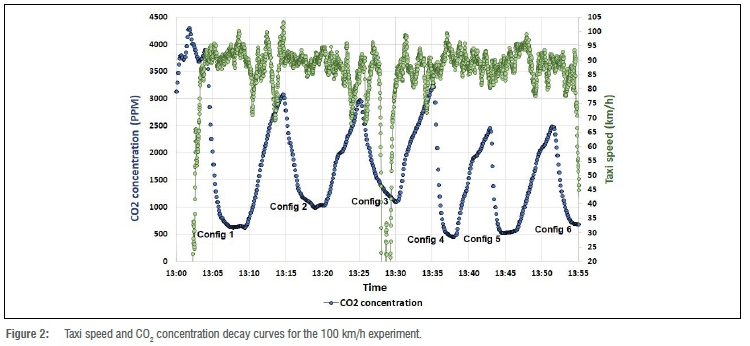
Ventilation data were recorded for the six window configurations in a fully occupied taxi over 7 days. A sample of the CO2 concentration decay data for a journey with a target speed of 100 km/h is shown in Figure 2 with the accompanying recorded taxi speed. Each peak on the CO2 concentration decay curve represents the moment before a window configuration was changed (shown in sequence from Configurations 1 to 6 in Table 1).
In Figure 2, the average speed achieved when the tests were conducted was 89 km/h, with fluctuations reflecting the conditions encountered on the highway. The corresponding average speeds attained for the target speeds of 40, 80 and 100 km/h were within 2.5%, 5% and 11%, respectively.
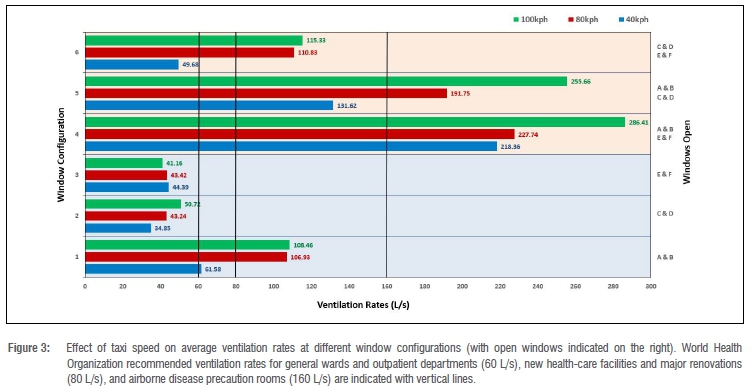
Figure 3 shows the average ventilation rate at each target speed compared against WHO recommended rates for three settings. The ventilation rates varied with changes in open window configurations, with Configurations 1, 4 and 5 achieving the highest rates at all speeds. Among the two-open-window configurations (Configurations 1, 2 and 3), Configuration 1 alone resulted in nearly double the ventilation rates seen in Configurations 2 and 3 at all test speeds. For the four-open-window configurations (Configurations 4, 5 and 6), Configuration 4 resulted in nearly double the rates produced by Configuration 6 at all speeds. For each individual configuration, apart from Configuration 3 (in which the rear windows were open), as the speed increased, the average ventilation rate increased. Configuration 1, with two open windows, resulted in ventilation rates similar to those of Configuration 6 (with four open windows) implying that the ventilation flow rates could depend as much on interior flow resulting from window configuration as on the number of open windows. Configurations 4 and 5 provided ventilation rates ranging from 132 L/s to 286 L/s.
Discussion
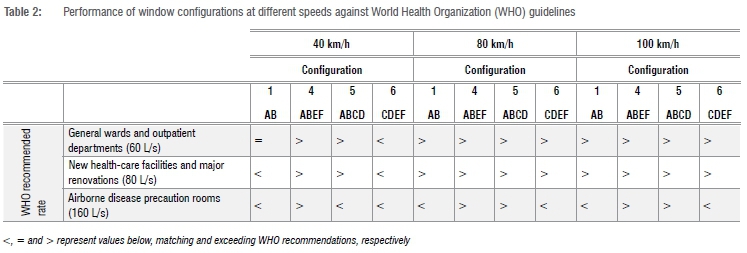
In Table 2, WHO recommended per-person ventilation rates for different kinds of health-care settings are provided12; these recommended rates are compared with the ventilation rates achieved in the interior of the taxi during the test periods.
The six configurations showed a wide ventilation range (34.85-286.41 L/s) when combined with variations in taxi speed. At all three test speeds, Configuration 1 produced ventilation rates that matched and exceeded that suggested for general wards and outpatient departments (60 L/s), whereas Configuration 6 only produced similar results at 80 km/h and 100 km/h. Configuration 4 produced the best ventilation rate, exceeding that suggested for airborne infection prevention rooms (160 L/s) at all three test speeds with a minimum ventilation rate of 218 L/s measured at 40 km/h. Configuration 5 similarly produced ventilation rates exceeding the highest recommended ventilation rates with 190 L/s at 80 km/h and 255 L/s at 100 km/h, whilst also exceeding the new health-care facility minimum ventilation rate (80 L/s) at 40 km/h with a ventilation rate over 130 L/s. Thus ventilation is a viable means of airborne infection control22 in the confined environment studied. Configurations 4 and 5 are recommended for minibus taxis.
The high CO2 concentrations, exceeding 4000 ppm (Figure 2), agree with the findings of Andrews et al.9, confirming the high transmission risk environment in taxis. We have shown the impact of open window configurations on ventilation during operational transit, augmenting the ventilation profiles explored by Johnstone-Robertson5 for a stationary taxi.
Despite the ventilation capabilities achieved in the study, passengers might not tolerate the fully open window configurations, for example due to discomfort caused by temperature changes, safety concerns, or inclement weather. Overloading would also alter the ventilation rates achieved with the window configurations considered in this study; taxis are often congested or overloaded during peak-traffic commuting journeys.8 The potential role of airborne infection control devices (similar to those employed in health-care settings) to address the suboptimal ventilation scenarios must be considered; these devices include ultraviolet germicidal irradiation devices, filtration devices or mechanical ventilation.
Conclusion
Our results show that in a fully occupied taxi, ventilation rates that match and surpass the WHO recommended ventilation guidelines for airborne infection settings can be achieved at a range of speeds. Thus ventilation is a viable means of airborne infection control22 in such confined environments. However, driver and passenger education on the TB transmission risks in taxis and the importance of maintaining ventilation is necessary. Despite the ventilation rates achieved in the study, scenarios in which natural ventilation cannot be maintained, are still of concern, as passenger behaviour in operating taxis might not support the fully open window configurations. Taxi loads during peak-traffic commuting journeys are also of concern. The potential use of additional measures to address suboptimal ventilation scenarios must be considered.
Authors' contributions
M.T.M.: Study and manuscript conceptualisation, study design, data collection and analysis, manuscript preparation. M.P.: Study conceptualisation, funding acquisition, initial study supervision, manuscript editing. T.S.D.: Manuscript conceptualisation, project management, manuscript editing.
References
1.World Health Organization (WHO). Global tuberculosis report. Geneva: WHO; 2017. [ Links ]
2.Calligaro G, Esmail A, Mnguni T, Mottay I, Dheda K. The diagnostic gap: Characterising the profile of undiagnosed infectious tuberculosis patients in the community. S Afr Respir J. 2016;22(4):93-98. https://doi.org/10.7196/SARJ.2016.v22i4.100 [ Links ]
3.Pooran A, Pieterson A, Davids M, Theron G, Dheda K. What is the cost of diagnosis and management of drug resistant tuberculosis in South Africa? PLoS ONE. 2013;8(1), e54587, 11 pages. https://doi.org/10.1371/journal.pone.0054587 [ Links ]
4.Wood R, Racow K, Bekker LG, Morrow C, Middelkoop K, Mark D, et al. Indoor social networks in a South African township: Potential contribution of location to tuberculosis transmission. PLoS ONE. 2012;7(6), e39246, 5 pages. https://doi.org/10.1371/journal.pone.0039246 [ Links ]
5.Johnstone-Robertson S. Calculating the risk of infection of Mycobacterium tuberculosis in endemic settings [master's thesis]. Stellenbosch: Stellenbosch University; 2012. [ Links ]
6.Zamudio C, Krapp F, Choi HW, Shah L, Ciampi A, Gotuzzo E, et al. Public transportation and tuberculosis transmission in a high incidence setting. PLoS ONE. 2015;10(2), e0115230, 8 pages. https://doi.org/10.1371/journal.pone.0115230 [ Links ]
7.Hella J, Morrow C, Mhimbira F, Ginsberg S, Chitnis N, Gagneux S, et al. Tuberculosis transmission in public locations in Tanzania: A novel approach to studying airborne disease transmission. J Infect. 2017;75(3):191-197. https://doi.org/10.1016/j.jinf.2017.06.009 [ Links ]
8.Statistics South Africa. National Household Travel Survey 2013. Pretoria: Department of Transport; 2014. [ Links ]
9.Andrews JR, Morrow C, Wood R. Modeling the role of public transportation in sustaining tuberculosis transmission in South Africa. Am J Epidemiol. 2013;177(6):556-561. https://doi.org/10.1093/aje/kws331 [ Links ]
10.Gammaitoni L, Nucci MC. Using a mathematical model to evaluate the efficacy of TB control measures. Emerg Infect Dis. 1997;3(3):335-342. https://doi.org/10.3201/eid0303.970310 [ Links ]
11.Kale SR, Veeravalli SV, Punekar HD, Yelmule MM. Air flow through a non-airconditioned bus with open windows. Sadhana. 2007;32(4):347-363. https://doi.org/10.1007/s12046-007-0029-3 [ Links ]
12.World Health Organization (WHO). Natural ventilation for infection control in health-care settings. Geneva: WHO; 2009. [ Links ]
13.Zhang Z, Chen X, Mazumdar S, Zhang T, Chen Q. Experimental and numerical investigation of airflow and contaminant transport in an airliner cabin mockup. Build Environ. 2009;44(1):85-94. https://doi.org/10.1016/j.buildenv.2008.01.012 [ Links ]
14.Johnstone-Robertson S, Lawn SD, Welte A, Bekker LG, Wood R. Tuberculosis in a South African prison - a transmission modelling analysis. S Afr Med J. 2011;101(11):809-813. [ Links ]
15.Cao X, Liu J, Jiang N, Chen Q. Particle image velocimetry measurement of indoor airflow field: A review of the technologies and applications. Energy Build. 2014;69:367-380. https://doi.org/10.1016/j.enbuild.2013.11.012 [ Links ]
16.Noakes CJ, Sleigh PA. Mathematical models for assessing the role of airflow on the risk of airborne infection in hospital wards. J R Soc Interface. 2009;6(suppl.6):S791-S800. https://doi.org/10.1098/rsif.2009.0305.focus [ Links ]
17.Rudnick SN, Milton DK. Risk of indoor airborne infection transmision estimated from carbon dioxide concentration. Indoor Air. 2003;13(3):237-245. https://doi.org/10.1034/j.1600-0668.2003.00189.x [ Links ]
18.Yan Y, Li X, Shang Y, Tu J. Evaluation of airborne disease infection risks in an airliner cabin using the Lagrangian-based Wells-Riley approach. Build Environ. 2017;121:79-92. https://doi.org/10.1016/j.buildenv.2017.05.013 [ Links ]
19.Issarow CM, Robin W, Nicola M. Modelling the risk of airborne infectious disease using exhaled air. J Theor Biol. 2015:100-106. https://doi.org/10.1016/j.jtbi.2015.02.010 [ Links ]
20.Sze To GN, Chao CYH. Review and comparison between the Wells-Riley and dose-response approaches to risk assessment of infectious respiratory diseases. Indoor Air. 2009;20(1):2-16. https://doi.org/10.1111/j.1600-0668.2009.00621.x [ Links ]
21.Hathway EA, Noakes CJ, Sleigh PA, Fletcher LA. CFD Simulation of airborne pathogen transport due to human activities. Build Environ. 2011;46:2500-2511. https://doi.org/10.1016/j.buildenv.2011.06.001 [ Links ]
22.Meadow JF, Altrichter AE, Kembel SW, Kline J, Mhuireach G, Moriyama M, et al. Indoor airborne bacterial communities are influenced by ventilation occupancy and outdoor air source. Indoor Air. 2014;24(1):41-48. https://doi.org/10.1111/ina.12047 [ Links ]
 Correspondence:
Munyaradzi Matose
munya.matose@gmail.com
Received: 02 Nov. 2018
Revised: 04 Jan. 2019
Accepted: 11 Aug. 2019
Published: 26 Sep. 2019
* Current: Department of Health, Western Cape Government, Cape Town, South Africa
EDITOR: Pascal Bessong
FUNDING: None

