


Servicios Personalizados
Articulo
 Inglés (pdf)
 Articulo en XML
 Referencias del artículo
Indicadores

Links relacionados
-
 Citado por Google
 -
 Similares en Google
Compartir

 Permalink
South African Journal of Science
versión On-line ISSN 1996-7489
versión impresa ISSN 0038-2353
S. Afr. j. sci. vol.115 no.9-10 Pretoria sep./oct. 2019
http://dx.doi.org/10.17159/sajs.2019/5578
RESEARCH ARTICLE
Shellfish exploitation during the Oakhurst at Klipdrift Cave, southern Cape, South Africa
Kokeli P. RyanoI, IV; Karen L. van NiekerkII; Sarah WurzII, III; Christopher S. HenshilwoodII, IV
IDepartment of History, School of Humanities, University of Dodoma, Dodoma, Tanzania
IISFF Centre for Early Sapiens Behaviour (SapienCE), Department of Archaeology, History, Cultural Studies and Religion, University of Bergen, Bergen, Norway
IIISchool of Geography, Archaeology and Environmental Studies, University of the Witwatersrand, Johannesburg, South Africa
IVEvolutionary Studies Institute, University of the Witwatersrand, Johannesburg, South Africa
ABSTRACT
Klipdrift Cave in the southern Cape, South Africa, provides new insights into shellfish harvesting during the Later Stone Age (14-9 ka) period associated with the Oakhurst techno-complex. Two shellfish species dominate: Turbo sarmaticus and Dinoplax gigas. An abrupt shift in the relative frequencies of these species occurs in the middle of the sequence with T. sarmaticus almost completely replacing D. gigas. The shift in dominant species is likely due to environmental change caused by fluctuating sea levels rather than change in sea surface temperatures. The shellfish assemblage shows that local coastal habitats at Klipdrift Cave were somewhat different from those of contemporaneous sites in the southern Cape. Although the shellfish specimens are smaller at Klipdrift Cave than those from Middle Stone Age localities such as Blombos Cave, there is no robust indication that larger human populations at Klipdrift Cave during the Oakhurst period might have caused this change in size. Environmental or ecological factors could have restricted shellfish growth rates as some experimental works have suggested, but this possibility also remains to be further explored.
SIGNIFICANCE:
•The dominance of D. gigas and T. sarmaticus at Klipdrift Cave is surprising, as it indicates a local habitat slightly different from other similar sites during the Oakhurst period.
•The shift in dominance from D. gigas to T. sarmaticus indicates changing climatic and environmental conditions during the Oakhurst period, 14-7 ka
Keywords: shell-fishing, predation pressure, palaeoclimate, environment, Terminal Pleistocene, coastal subsistence
Introduction
Early evidence for the exploitation of shellfish for subsistence traces back to at least 164 ka during the Middle Stone Age (MSA) in South Africa1, and by 100-60 ka shellfish were systematically and intensively exploited at a handful of sites2-5. Evidence for the use of shellfish for purposes other than food, such as making containers and ornaments, appears from 100 ka to 75 ka in the southern Cape.6-8 It is, however, possible that many older sites containing shellfish remains were destroyed by the Marine Isotope Stage 5e sea level transgression.1 Further, there is little evidence for shellfish exploitation between 50 ka and 14 ka, mainly because of the paucity of coastal sites from this time period.
Evidence for shell-fishing re-appears at around 14 ka in the southern Cape,9 at the end of the period associated with the Robberg techno-complex. Shellfish become more abundant in sites during the subsequent period linked to the Oakhurst techno-complex, around 14-7 ka, although sites from this period with shellfish are still relatively uncommon.10,11 The most abundant evidence for intensive shellfish exploitation comes from the 'megamidden' period, between 3 ka and 2 ka, from the West coast, which is dotted with extensive open shell middens.12
Here we present new data on shellfish exploitation during the Oakhurst period from a recently excavated Later Stone Age (LSA) site - Klipdrift Cave (KDC) - situated in the southern Cape. We compare our data to those from contemporary sites in the region by examining the role that shellfish played in the subsistence of these coastal dwellers. Climatic and predation pressure hypotheses are examined against these data. We investigate three main issues: the nature of marine shellfish exploitation; the intensity of shellfish collection; and the extent to which climate and environmental conditions can be deduced from shellfish remains.
The Oakhurst period in context
The term Oakhurst techno-complex is used here for sites that typically date to ~14-7 ka10,13 and that follow the Robberg techno-complex, although regional variants occur across southern Africa14. Furthermore, the transition between entities such as the Robberg and Oakhurst in the Cape region was not synchronous.11 The Oakhurst is characterised by non-microlithic and bladelet poor lithic assemblages dominated by unstandardised flakes, and frequent use of coarser grained lithic raw materials.15-17 Formal tools are rare and consist mainly of medium to large scrapers. Non-lithic artefacts associated with the Oakhurst include worked bone, ostrich eggshell beads and ornaments as well as worked marine shell and beads.10 The Robberg period is characterised by relatively few shellfish remains, but during the Oakhurst, shellfish, fish, marine mammals and seabirds are present in the deposits. Initially the Oakhurst people also hunted large-to-medium-sized game such as eland and warthog, but these prey were later replaced by browsers, likely reflecting a change towards a woodier habitat.18
Shellfish remains during the Oakhurst Complex on the southern Cape coast
Of the eight securely dated Oakhurst sites (Figure 1a) in the southern Cape10, four - Nelson Bay Cave (NBC)9, Matjes River Shelter (MRS)19, Byneskranskop 1 (BNK 1)20, and Oakhurst Shelter21 - contain significant shellfish remains, probably because they were close to the coast. At inland sites such as Boomplaas Cave (BPA) and Kangkara Cave,15 Wilton Large Rock Shelter22 and Melkhoutboom Cave23, shellfish are rare, and, when present, may have predominantly been used for non-subsistence purposes such as the manufacture of ornamental and decorative items.
The shellfish from three of the four sites have been described to varying degrees. The shellfish from Oakhurst Shelter were listed to species level but not quantified. The impression is that the shellfish samples were not retained during excavation.24 It is, however, evident that the white sand mussel (Donax serra) is the most common species in the Oakhurst levels.21 Therefore, NBC, MRS and BNK 1 are described in more detail below.
NBC and MRS are situated approximately 10 km apart with similar rocky shores and sandy beaches in close vicinity. The most common species in the Oakhurst levels are the bivalves Perna perna (brown mussel), D. serra and Choromytilus meridionalis (black mussel). At both sites, there is an inverse correlation in the frequency of these species over time.9,19 At NBC, C. meridionalis is replaced by P. perna around 10 ka whilst D. serra frequencies increase at the same time.9,11 At MRS, P. perna increases sharply relative to C. meridionalis by 9.5 ka13, but, unlike at NBC, D. serra is most common in the earlier layers, dated to 10 ka, and decreases as P. perna increases19. These changes in species representation over time have been interpreted as indicative of changing environmental conditions.9,19
At BNK, shellfish are present in the Oakhurst layers in relatively low frequencies; the total minimum number of individuals (MNI) is 310. The frequencies gradually increase from the oldest 13 ka to the youngest 7 ka Oakhurst layers, but only become significantly abundant in the overlying layers attributed to the Wilton period.11,20 The low numbers probably reflect an increased distance from the shore prior to the Wilton. Numbers of C. meridionalis and P. perna are negligible, although the former outnumbers the latter in all the Oakhurst layers. D. serra is the most common species in all but the youngest Oakhurst layer, dated to 7 ka, where Turbo sarmaticus (alikreukel) become more common. Although the authors listed non-modified D. serra under the general shellfish table, they were not convinced that they were brought in primarily as food, but suggest that they had been used as artefacts, as some perforated fragments were found.20 Modified D. serra shells have not been reported from NBC and MRS.
Shellfish as a proxy for human population sizes
It has been argued that the sizes of gastropods, and variation in shellfish species, from archaeological sites may provide an estimate of the extent and intensity of harvesting of these animals as food, which in turn can be used as a reflection of human population size.4,25,26 The reduced size of gastropods in LSA sites relative to those from MSA localities in southern Africa has been used to imply intensified collection due to higher human population size during the LSA.4,25,27 In addition, MSA assemblages tend to contain a smaller range of mostly larger species, and the few smaller species tend to occur in low numbers relative to LSA assemblages.26 As such, gastropod size and species abundance have been used to argue for smaller human population sizes during the MSA.4,25,27 Another argument is that the reduced gastropod size could be due to environmental factors affecting shell growth rates, particularly as non-food species are also reduced in size in the LSA compared to MSA.28 It is also interesting that data on Nerita tessellata (tessellated nerite snail) from the Caribbean island of Nevis indicate that shellfish size increased despite intensive exploitation by human populations between 890 and 1440 AD.29
Site background
KDC (34o27.0963'S 20o43.4582'E) is located on the coast in the De Hoop Nature Reserve on Portion 20 of farm 516, Swellendam District in the southern Cape, South Africa (Figure 1a and 1b). It forms part of the Klipdrift Complex where Klipdrift Shelter, a Howiesons Poort locality, is also found.5 KDC was first excavated in 2010 and subsequently in 2011. The surface of the deposit in KDC is truncated possibly by mid-Holocene higher sea levels, but excavations over an area of 2.75 m2 revealed horizontal in-situ depositional layers with exceptional preservation of bone, shell, charcoal and ostrich eggshell. The lithics are assigned to the Oakhurst techno-complex, and the top and bottom of the excavated sequence have been dated to approximately 10 ka and 13 ka, respectively (Figure 1c).13
Materials and methods
All the shellfish remains retained in the 3-mm sieve from layers JY through KAE, which form 85% of the total excavated volume (0.93 m3) at KDC, were analysed. Whole shellfish <2 cm are not considered to be food items30 but rather animals that landed up in the site incidentally, for example through attachment to bigger shells, and are not included in this analysis.
The methods and techniques adopted for analysing marine shellfish from KDC involve species identification, determining the MNI, weighing the shells, and measurements of the maximum 'length' of T. sarmaticus opercula and limpet shells. Both MNI and weight are used as rare species may be underrepresented when only MNI is used31 and further because post-depositional damage can affect the MNI counts32.
MNI counts for T. sarmaticus are derived from counting apices and opercula and the highest value is considered the MNI. The weight for T. sarmaticus species given here includes the opercula and shell weights. The MNI values for other gastropods are calculated by counting the apices. For Dinoplax gigas (the giant chiton), the front, middle (the number of middle valves divided by six), and rear valves were counted separately. The greatest total for the three categories was taken as the MNI. Left and right hinges of bivalves were counted separately, and the highest value taken as the MNI.
Results
Species composition
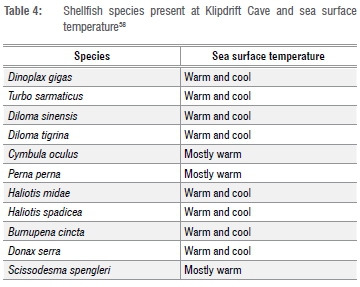
Eleven mollusc species with a total MNI of 5330 were identified from 197.69 kg of shellfish remains (Table 1). Both Diloma sinensis and D. tigirina (periwinkles) are present, but, as the apices are usually separate from the identifiable body whorl, the shell weights and MNI have been combined for these two species and listed as Diloma spp. No shell fragments of D. variegata were found, and it is therefore assumed that only the former two species are represented by the apices of this family at KDC. All the species identified occur in the southern Cape today,33 and no cold-water indicator species (e.g. Cymbula granatina, granite limpet) are present.
All species listed in Table 1 are edible, and most were presumably collected primarily as food. It is possible that the white mussels (D. serrra) were first eaten, and some shells subsequently used for other purposes, as 14 of the valves have ~10 mm circular perforations near the centre. The angular surf clam, Scissodesma spengleri, present in small numbers throughout the sequence, may also have been used for purposes other than food.34 This species occurs subtidally in the deeper surf zone, and is therefore difficult to collect live but specimens do wash up after storms.35 The KDC specimens do not appear waterworn, but, according to G. Branch (2013, written communication, May 15), these washed up shells are seldom damaged or waterworn. Thus, it is not clear whether these specimens were collected dead or alive. Some of the valves have what appears to be retouch on the ventral side, and might have functioned as a sort of scraper, but this possibility needs further investigation. Incidental, non-food species consist mostly of barnacle fragments and juvenile limpets.
Shellfish exploitation through time
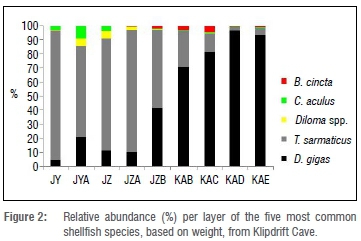
T. sarmaticus and D. gigas are the most frequently occurring species throughout the assemblage (Tables 1 and 2), contributing over 93% in terms of MNI and 95% in terms of weight. All other species combined contribute <4% in terms of weight, and 7% in terms of MNI to the total assemblage (Table 2). P. perna, Haliotis midae (abalone), Haliotis spadicea (Venus ear, a small abalone), Scutellastra longicosta (long-spined limpet) and S. spengleri (surf clam) occur in negligible numbers. Cymbula oculus (goat's eye limpet), Diloma spp. and Burnupena cincta (whelk) occur in slightly higher numbers than the aforementioned, but still at very low frequencies relative to D. gigas and T. sarmaticus.
D. gigas is the most abundant species in the site, both in terms of weight and MNI (Table 1). There is an inverse relationship in frequency between D. gigas and T. sarmaticus through time, with the former being most abundant in the lower part of the sequence (layers KAE-JZB), and the latter in the upper four layers (JZA-JY). On a much smaller scale, the frequencies of B. cincta, C. oculus and Diloma spp. follow a similar pattern: B. cincta is most common in the lower layers associated with D. gigas and all but disappears in the upper layers, whereas the relative frequencies of C. oculus and Diloma spp. increase in the upper layers (Figure 2). D. serra is present in all layers in low numbers, but its relative frequency is highest in the same layers where B. cincta is most common.
P. perna are absent from the lowermost two layers and layer JZA, and constitute only between 0.2% and 2.2% of MNI in the layers in which they do occur (Table 2). H. midae and H. spadicea occur in negligible quantities, but it is notable that they are only present in layers above JZB, except for a few fragments in KAB (Table 2).
KDC contains a limited number of species (n=11) relative to the other sites, particularly MRS (n=20). Some shellfish species, such as the Aulacomya atra (ribbed mussel), C. compressa (kelp limpet) and C. granatina, are restricted to one site (MRS). Limpets are rare at KDC and BNK 1 and more common at NBC and MRS. S. spengleri is present only at KDC and BNK 1 (Supplementary table 1).
Shellfish density through time
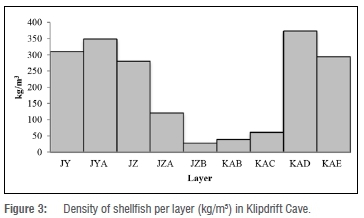
Shellfish densities at KDC are very high in the three uppermost and two lowermost layers of the sequence (Figure 3). Densities are the lowest between layers KAC and JZA. Layer KAD has the highest shell density (~374 kg/m3) and JZB the lowest, at ~28 kg/m3. Jerardino36 cautions against using density measures particularly when making inter-site subsistence comparisons. However, as KDC is a 'closed' cave (as opposed to open air sites), intra-site density comparisons are less likely to be significantly problematic, although deposition rates may have differed between layers.
Shellfish size
Turbo sarmaticus opercula
The southern Cape species most frequently used for size measurements are various limpets and the opercula of T. sarmaticus. The latter are used as a proxy for shell size as shells tend to be fragmented in archaeological assemblages.37 Descriptive statistics for T. sarmaticus opercula from KDC are given in Table 3 and summarised using box plots (Figure 4).
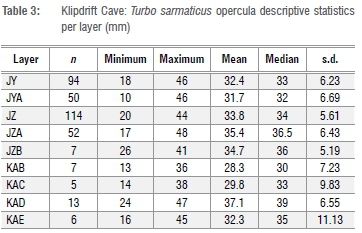
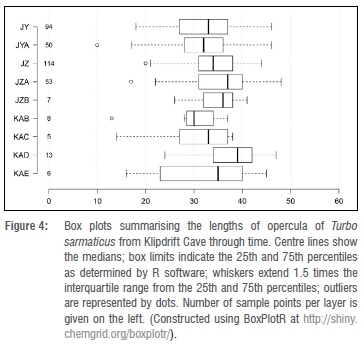
Opercula lengths range between 10 mm and 48 mm through the sequence. The median value is highest in layer KAD, at 39 mm, and lowest in KAB (30 mm) (Table 3). The data for opercula are also presented using box plots (Figure 4). This figure shows some variations within the sequence. For example, larger individuals are apparent in layers KAD and JZA while KAB and JYA have proportionally smaller individuals.
KDC measurements were compared with those from other LSA localities (Blombosfontein [BBF], Blombos Cave [BBC], and NBC) and MSA sites (Klasies River [KR], Klipdrift Shelter [KDS], and BBC) from the southern Cape (Supplementary table 2; Supplementary figure 1). BBF 2 specimens are slightly larger than those from both KDC and NBC sites while there is a progressive decrease in size of Turbo opercula for younger LSA sites. The difference in size of specimens between Oakhurst and post-Oakhurst assemblages such as BBF 3 is significant (Supplementary figure 1). The general trend is that specimens from MSA sites are larger than those from LSA ones; for example, there is a significant difference between BBC M2 and KDC (Supplementary figure 1).
Cymbula oculus shells
The most common limpet species present at KDC is C. oculus. As whole (measurable) C. oculus shells were rare (n=17), the measurements were combined for all layers (Supplementary table 3). While the sample size is small, we include the data here as a contribution to the available information on shellfish size patterns during the Oakhurst period in the southern Cape. As with the T. sarmaticus measurements, C. oculus measurements from KDC were plotted against those from other MSA and LSA sites in the southern Cape (Supplementary figure 2). C. oculus specimens from KDC are smaller in size than those from NBC Oakhurst layers (Supplementary table 3) using the median index (66.5 mm against 62 mm). C. oculus specimens from MSA sites such as KR and BBC are larger than those from KDC by at least 7 mm (Supplementary figure 2).
Discussion
We address two main issues here: first, whether the change in shellfish species over time at KDC could be attributed to climate, environment and/or human choices; and second, whether human agents were responsible for the differences in the shellfish sizes observed at KDC.
Change of shellfish species composition at Klipdrift Cave
The KDC data present two clear patterns of exploitation: (1) the dominance of D. gigas in the lower layers, with AMS dates centring on 14 ka and 13 ka and (2) the high frequency of T. sarmaticus in the upper layers, from layer JZA (Figures 2 and 3). The question we explore here is whether this shift in the presence of species is related to changes in sea surface temperatures, habitat change or deliberate human choice.
Shellfish species composition has often been used as an indicator of sea surface temperatures.2,9,19 However, only a few species are effective temperature indicators. These species include C. granatina and A. atra35,38 that occur on the west coast and are indicative of cool temperatures. The (non-food) species such as Cellana radiata capensis and Alaba pinnae indicate warmer waters38 but these species do not occur at KDC. The species conventionally used as temperature indicators - C. meridionalis for 'mostly cool' temperatures and P. perna and C. oculus for 'mostly warm' sea surface temperatures - cannot be regarded as reliable proxies for sea surface temperatures.38 An experimental study has suggested that C. meridionalis do not thrive in temperatures above 18 °C39, but C. meridionalis can co-exist with P. perna in the south coast surviving in sea surface temperatures above 20 °C40. This supports the Langejans et al.38 suggestion that C. meridionalis and P. perna may not be reliable temperature indicators. Furthermore, there are minor differences in habitat preferences between C. meridionalis and P. perna that may cause them to co-exist spatially separated in the same locality. C. meridionalis, for example, occurs on rocks on the low shore that are associated with sand while P. perna occurs on the high shore on rocks which are not usually covered by sand.40
As most of the species that occur at KDC thrive in both warm and cool sea temperatures (Table 4), it is difficult to infer sea surface temperatures at the times of occupation. However, the absence of C. granatina, a more reliable cold-water indicator species35,38 at KDC, NBC and MRS suggests that sea surface temperatures in the southern Cape coast were mildly warm during the Oakhurst period.
Species representation can also reflect past habitats. In this regard it is surprising that C. meridionalis is not present, even in the lower KDC sequence, as the dominant presence of D. gigas suggests sand inundated rocky shores - a habitat that is attractive to C. meridionalis. This species is also present at the other Oakhurst sites mentioned. The low incidence of sessile mussels such as P. perna at KDC (Tables 1 and 2) is also unusual as they are typically common in LSA sites of the southern Cape coast such as NBC9, MRS19 and the BBF sites (dating from ca 6 ka to 0.5 ka)32.
The fluctuating presence of D. gigas and T. sarmaticus at KDC may be due to changes in the habitat best suited to each species over time. The shift from the dominance of the more sand-tolerant species, D. gigas, in the lower layers (12 ka) to the dominance of T. sarmaticus in the upper layers may suggest scouring out of sand in the later period. T. sarmaticus would have thrived in a habitat with more exposed rocks and less sand. The near absence of sessile mussels at KDC may suggest a sheltered sandy bay in front of the cave at times - an environment not favoured by these species.41 The slight increase in sessile mussels towards the top of the sequence could indicate a change to rockier shores and rock pools that would also have attracted T. sarmaticus and limpets such as C. oculus.41
The subtle changes in coastal morphology suggested by the shifting dominance of the species may have been a result of rising sea levels and is less likely due to changing sea surface temperatures. The rising sea levels signalled the transition from the Last Glaciation towards the Holocene epoch. The complete absence of H. midae and the low incidence of P. perna and C. oculus (species that do not tolerate overly sandy environments) in the ca 10 ka layers42 support a scenario of a sandy dominated marine environment around this time.
A final scenario to consider for the change of species composition at KDC is whether this change relates to human choice, acknowledging that it is complicated to discriminate between changes resulting from human choice and those from the environment.28,43 Although the dominant species at KDC prefer slightly different habitats, it is common for them to, at times, occur in close vicinity, suggesting that both could have been available for collection during gathering events.
One possible indication that human choice was responsible for the difference in representation through time is the size of T. sarmaticus in the lower layers. If the coastal zones were newly colonised by this species in the lower layers, then one would expect the population to consist of smaller animals, migrating from crowded subtidal populations, not the larger ones that tend to stay in the lower subtidal areas.33,44 While Turbo opercula measurements in the lower layers at KDC (Table 3) indicate a relatively small average size, there are some large individuals present, particularly in layers KAE and KAD (Figure 4). The presence of such large individuals suggests that a mature Turbo population was present and available and could be tentative evidence that people actively chose to collect D. gigas in the older levels, despite the availability of good-sized T. sarmaticus. However, it seems more convincing at present to suggest that the shifting dominance of D. gigas and T. sarmaticus at KDC was caused by habitat change rather than human preference. A similar scenario is suggested for the MSA site of KDS at the same locality, where D. gigas replaces T. sarmaticus and H. midae in the upper layers.5 This argument may be tested by future research when refined palaeoenvironmental reconstructions of KDC become available. In the instance of C. meridionalis and P. perna, it is unlikely that people would discriminate between the former and the latter when collecting, as they are presumably the same in terms of size and taste.9 Thus, the absence of C. meridionalis and the rarity of P. perna may be most likely explained by environmental factors rather than human decision to not collect them.
Cause(s) of size reduction
Shellfish sizes in archaeological sites have been linked to human population sizes and the intensity of harvesting. Here, the comparison of shellfish size between MSA and LSA sites in the southern Cape is discussed only for T. sarmaticus opercula and C. oculus shell measurements. Given the relative rarity of C. oculus at KDC, their overall small size (Supplementary table 3) is unlikely caused by human predation pressure. There is no criterion established for comparing D. gigas sizes although they are numerous at KDC45, KDS and BBC MSA38,46 and are also present at MRS, between 9.6 ka and 7 ka19. Comparing their size through time may be a subject for later research.
As detailed above, KDC T. sarmaticus opercula are smaller in size than those from the MSA of KDS, BBC and KR sites, but larger than most post-Oakhurst assemblages from BBC, KR and BBF (Supplementary figure 1). The few measurable C. oculus at KDC are also smaller than those from MSA sites and more like those from the Oakhurst layers at NBC.
Although most analysts of the southern Cape coast molluscs3,4,25,27 argue that intensive harvesting of shellfish due to larger human population is a leading cause of reduction in average size of marine molluscs through time, others28,43,47,48 question this proposition. Jerardino et al.43 and Sealy and Galimberti28, for example, point out that C. meridionalis in MSA and LSA occurrences are similar in size while limpets (e.g. C. oculus and S. argenvillei) and turban shells (e.g. T. sarmaticus) are smaller in the LSA. Klein and colleagues4,25,27 believe that the lack of significant difference in C. meridionalis sizes between MSA and LSA sites on the west coast is due to this species' rapid colonisation relative to that of slower growing gastropods or turban shells such as T. sarmaticus.
It may be significant that non-food shellfish such as Nassarius kraussianus (tick shell) from the MSA at BBC are significantly larger than those from the LSA levels at the same site and at Die Kelders.28 It is unlikely that the reduced sizes of N. kraussianus in LSA contexts can be attributed to intensive collection as they were not that intensively collected.28 Hence, the differences in sizes of shellfish, especially limpets and the turban shells in the MSA and LSA sites, may have been caused by a combination of both natural and human factors.28
Non-human factors that affect the shellfish growth rates include sea surface temperature and turbidity, salinity, topography, wave action, desiccation, shellfish population densities and food supply.28,44,47-49 Oceanic productivity or the production of organic matter by phytoplankton, generates food for marine life such as shellfish.50 Productivity changed over time and it is known that the primary productivity of the Subantarctic Ocean changed over the last 70 ka with marked algal production at ca 58.8, 53, 46 and 38.5 ka.51 Oceanic productivity data for the southern Cape coast are not available, but productivity may have been influenced by the Subantarctic Ocean.28 Variations in oceanic primary productivity affect the food chain and, in turn, may affect size and distributions of shellfish species.28 The growth of T. sarmaticus is affected not only by lack of food but also by its quality.44 Changes in oceanic productivity may have resulted in changes in the availability and the quality of food on the southern Cape coast, although this supposition remains to be firmly established.
In the case of the KDC data, to test whether increased predation led to a decrease in size, we predicted size reduction in T. sarmaticus from the older to the younger layers, when exploitation of this species intensified. This prediction is based on the premise that a present but unexploited Turbo community will contain many large specimens.52,53 It has also been hypothesised that humans tend to target the largest specimens first when gathering shellfish and the smaller ones may be collected later and thus the overall size distribution would become skewed.3,4,25,27,54-56 If shellfish collectors were intentionally seeking out a species at KDC, one would expect the initial assemblage to contain the largest specimens, and a gradual reduction in size through time as increased predation leads to fewer large specimens being available.3,4,27,56
Opercula measurements show that sizes decrease from layer JZA upwards, and the difference in size between JZA and the uppermost two layers, JYA and JY, is statistically significant.13 Thus, the decrease in size through time of T. sarmaticus opercula at KDC, especially after JZA, may support a scenario of intensive exploitation leading to reduction in size. This decrease coincides with an increase in shellfish densities, which could be because of more intensive harvesting or occupation intensity at this time. However, this does not explain why the KDC opercula are smaller than those in MSA contexts. It is possible that T. sarmaticus at KDC had slower growth rates than during the MSA due to not yet established environmental factors. Although T. sarmaticus were rare in the lower part of the sequence at KDC, when presumably little exploitation occurred, they are still smaller than MSA ones, which suggests that environmental conditions affected their growth rates.
Although there were probably larger human populations during the LSA25, non-human factors could also have impacted shellfish size43. Reduced size of shellfish may also be a function of more frequent harvesting by smaller groups.43 Until all the causal factors are carefully weaved together, larger human population as the only driver of shellfish size reduction is untimely.43
The environment and the Oakhurst subsistence economy
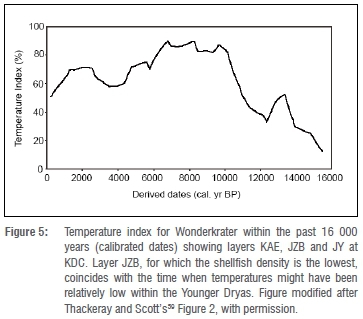
Shellfish remains are rare during the Robberg, a period that precedes the Oakhurst (e.g. at NBC57), as sea levels were lower during the Last Glacial Maximum. Shellfish become abundant again from the Oakhurst period and thereafter. The increase in shellfish subsistence during the Oakhurst period coincides with the rise of sea levels. The sea level transgression after 14.5 ka58 brought the coastline very close to the present-day Oakhurst sites on the southern Cape coast. The shellfish species exploited at KDC differ somewhat from those at MRS and NBC, and changes through time are evident at all three sites. At KDC, for example (Figure 2), there is a change from the dominance of D. gigas to T. sarmaticus in the sequence after/around 12 ka (from layer JZA), the period that coincides with the driest environment in the sequence as suggested by ostrich eggshell isotopes.45 At MRS and NBC, P. perna replaces C. meridionalis at about 10 ka. These changes are likely a result of changes in local habitat conditions through time and site-specific shores. The isotopic data from ostrich eggshells also indicate maximum aridity in the sequence in layer JZA.45 Furthermore, shellfish density is lowest in layer JZB (Figure 3), which also shows a decrease in lithic production. When these trends are compared to the temperature data for the terrestrial sequence of pollen at Wonderkrater59 (Thackeray and Scott's59Figure 2 reproduced here as Figure 5), it is clear that layer JZB, where the lowest density of shellfish is recorded, coincides with the time when temperatures were probably the lowest during the Younger Dryas. The Younger Dryas event might indeed have had a cooling effect over environments in southern Africa, but the influence of this effect may have varied regionally as highlighted by Fitchett and colleagues60. On the other hand, the lowest densities of both shellfish and lithic artefacts at layer JZB may also suggest a low-occupation period at the cave, but this argument needs to be supported by other faunal data.
The change in shellfish composition probably reflects habitat change that involved removal of sand from the rocks after or around 11 ka due to increasing sea levels. The decrease of the sand mussels at MRS and NBC in the upper layers also supports the shrinking of sandy shores at this time. It is noteworthy that the shellfish subsistence practices track the change in environment much more closely than the lithic technology does at KDC.13 The lithic technology remains stable.
Conclusions
As there are only a few sites in the southern Cape with exceptionally preserved shellfish remains, this paper broadens our understanding and provides new data on shell-fishing during the Oakhurst period. There are inter- and intra-site variations in the shellfish species exploited - perhaps because of subtle habitat changes.
Of the 11 mollusc species that occur at KDC, 2 are dominant: D. gigas is abundant in the lower layers while T. sarmaticus is more numerous upwards. The density of shellfish at KDC is lower in the middle of the sequence, which may be due to sea level regression and/or less intensive occupation of the site at that time. The shift from the dominance of D. gigas to T. sarmaticus may have been caused by rising sea levels, resulting in environmental changes from sand-covered rocky shores prior to 11 ka and more exposed rocks thereafter. The absence of C. meridionalis at KDC, which is present at both NBC9 and MRS19 during the Oakhurst, and the rarity of P. perna, may be due to unsuitable habitats for these species at KDC, and not related to sea surface temperatures. Effective sea surface temperature indicator shellfish species are not present at KDC but the absence of cold temperature species suggests that sea surface temperatures were relatively warm. The terrestrial climate during the Oakhurst at KDC was most likely warm and arid.
The sizes of T. sarmaticus opercula and C. oculus from the Oakhurst levels at KDC and NBC are smaller than those from MSA sites. The opercula are larger than in the post-Oakhurst LSA sites. A combination of factors may explain this scenario better than a single cause.
Acknowledgements
Partial funding for this research was provided to C.S.H., K.L.v.N. and S.W. by the Research Council of Norway through its Centres of Excellence funding scheme, Centre for Early Sapiens Behaviour (SapienCE) (project number 262618). C.S.H. was also funded through a South African National Research Foundation Research Chair (SARChI) at the University of the Witwatersrand and by the University of Bergen, Norway. S.W.'s research was further supported by the National Research Foundation of South Africa (grant no. 98826). Additional funding was provided to C.S.H. by the European Research Council (ERC) under the European Union's Seventh Framework Programme (FP7/2007-2013)/ERC grant agreement no. 249587 and by the Palaeontological Scientific Trust (PAST), Johannesburg, South Africa. Opinions expressed and conclusions arrived at are those of the authors and not those of the funding agencies. Petro Keene and Samantha Mienies assisted during analysis while Richard Klein generously supplied data and created Supplementary figures 1 and 2 of this work. Magnus Haaland and Ole Frederik Unhammer kindly supplied some of the images in Figure 1.
Authors' contributions
K.P.R. contributed to data analysis, the methodology and writing of the initial and revised drafts. K.L.v.N. contributed to data collection and analysis, the methodology and writing of the revised draft and co-directed excavations at the Klipdrift Cave site. S.W. was involved in data collection, data analysis and methodology, student supervision and writing revisions. C.S.H. conceptualised the research project, acquired funding, and provided project leadership and management and student supervision.
References
1.Marean CW, Bar-Matthews M, Bernatchez J, Fisher E, Goldberg P, Herries AIR, et al. Early human use of marine resources and pigment in South Africa during the Middle Pleistocene. Nature. 2007;449:905-908. https://doi.org/10.1038/nature06204 [ Links ]
2.Thackeray JF. Molluscan fauna from Klasies River, South Africa. S Afr Archaeol Bull. 1988;43(147):27-32. https://doi.org/10.2307/3887610 [ Links ]
3.Klein RG, Avery G, Cruz-Uribe K, Halkett D, Parkington JE, Steele T, et al. The Ysterfontein 1 Middle Stone Age site, South Africa, and early human exploitation of coastal resources. Proc Natl Acad Sci USA. 2004;101(16):5708-5715. https://doi.org/10.1073/pnas.0400528101 [ Links ]
4.Avery G, Halkett D, Orton J, Steele T, Tusenius M, Klein RG. The Ysterfontein 1 Middle Stone Age rock shelter and the evolution of coastal foraging. Goodwin Ser. 2008;10:66-89. [ Links ]
5.Henshilwood CS, Van Niekerk KL, Wurz S, Delagnes A, Armitage SJ, Rifkin RF, et al. Klipdrift Shelter, southern Cape, South Africa: Preliminary report on the Howiesons Poort layers. J Archaeol Sci. 2014;45:284-303. https://doi.org/10.1016/j.jas.2014.01.033 [ Links ]
6.Henshilwood CS, d'Errico F, Vanhaeren M, Van Niekerk K, Jacobs Z. Middle Stone Age shell beads from South Africa. Science. 2004;304:404. https://doi.org/10.1126/science.1095905 [ Links ]
7.d'Errico F, Vanhaeren M, Wadley L. Possible shell beads from the Middle Stone Age layers of Sibudu Cave, South Africa. J Archaeol Sci. 2008;35:2675-2685. https://doi.org/10.1016/j.jas.2008.04.023 [ Links ]
8.Henshilwood CS, d'Errico F, Van Niekerk KL, Coquinot Y, Jacobs Z, Lauritzen SE, et al. A 100,000-year-old ochre-processing workshop at Blombos Cave, South Africa. Science. 2011;334:219-222. https://doi.org/10.1126/science.1211535 [ Links ]
9.Klein RG. Preliminary report on the July through September 1970 excavations at Nelson Bay Cave, Plettenberg Bay (Cape Province, South Africa). Palaeoecol Afr. 1972;6:177-208. [ Links ]
10.Lombard M, Wadley L, Deacon J, Wurz S, Parsons I, Mohapi M, et al. South African and Lesotho Stone Age sequence updated (I). S Afr Archaeol Bull. 2012;67(195):120-144. [ Links ]
11.Loftus E, Sealy J, Lee-Thorp J. New radiocarbon dates and Bayesian models for Nelson Bay Cave and Byneskranskop 1: Implications for the South African later stone age sequence. Radiocarbon. 2016;58:365-381. https://doi.org/10.1017/RDC.2016.12 [ Links ]
12.Jerardino A. Mega shell middens and hunter-gatherer resource intensification along the West Coast of South Africa. In: Bailey GN, Hardy K, Abdoulaye C, editors. Shell energy: Mollusc shells as coast resources. Oxford: Oxbow Books; 2013. p. 207-228. [ Links ]
13.Ryano KP, Wurz S, Van Niekerk KL, Henshilwood CS. The technology of the early Oakhurst lithic techno-complex from Klipdrift Cave, southern Cape, South Africa. Afr Archaeol Rev. 2017;34(1):93-119. https://doi.org/10.1007/s10437-017-9246-2 [ Links ]
14.Mitchell P. The archaeology of southern Africa. Cambridge: Cambridge University Press; 2002. [ Links ]
15.Deacon J. The Later Stone Age of southernmost Africa. Cambridge Monographs in African Archaeology. Oxford: BAR Publishing; 1984. [ Links ]
16.Wadley L. The Early Holocene layers of Rose Cottage Cave, eastern Free State: Technology, spatial patterns and environment. S Afr Archaeol Bull. 2000;55:18-31. https://doi.org/10.2307/3888889 [ Links ]
17.Wurz S. Human evolution, archaeology and the South African landscape during the last 100 000 years. In: Knight J, Rogerson CM, editors. The geography of South Africa - Contemporary changes and new directions. World Regional Geography Book Series. Cham: Springer; 2019. p. 125-132. https://doi.org/10.1007/978-3-319-94974-1_13 [ Links ]
18.Klein RG. The late Quaternary mammalian fauna of Nelson Bay Cave (Cape Province, South Africa): Its implications for megafaunal extinctions and environmental and cultural change. Quat Res. 1972;2(2):135-142. https://doi.org/10.1016/0033-5894(72)90034-8 [ Links ]
19.Döckel W. Re-investigation of the Matjes River Rock Shelter. Stellenbosch: Stellenbosch University; 1998. [ Links ]
20.Schweitzer FR, Wilson ML. Byneskranskop 1: A late Quaternary living site in the southern Cape Province, South Africa. Ann S Afr Mus. 1982;88:1-203. [ Links ]
21.Goodwin AJH. Archaeology of the Oakhurst Shelter. Part 1: Course of the excavation. Trans R Soc S Afr. 1938;25:229-247. https://doi.org/10.1080/00359193709519751 [ Links ]
22.Deacon J. Wilton: An assessment after fifty years. S Afr Archaeol Bull. 1972;10:10-48. https://doi.org/10.2307/3888813 [ Links ]
23.Deacon HJ. Where hunters gathered: A study of Holocene Stone Age people in the eastern Cape. Cape Town: South African Archaeological Society; 1976. [ Links ]
24.Schrire C. Oakhurst: Re-examination and vindication. S Afr Archaeol Bull. 1962;17:181-195. https://doi.org/10.2307/3887544 [ Links ]
25.Klein RG, Steele TE. Archaeological shellfish size and later human evolution in Africa. Proc Natl Acad Sci USA. 2013;110:10910-10915. https://doi.org/10.1073/pnas.1304750110 [ Links ]
26.Klein RG, Bird DW. Shellfishing and human evolution. J Anthropol Archaeol. 2016;44(Part B):198-205. [ Links ]
27.Steele TE, Klein RG. Mollusk and tortoise size as proxies for stone age population density in South Africa: Implications for the evolution of human cultural capacity. Munibe Antropologia-Arkeologia. 2005;57(1):221-237. [ Links ]
28.Sealy J, Galimberti M. Shellfishing and the interpretation of shellfish sizes in the Middle and Later Stone Ages of South Africa. In: Bicho NF, Haws JA, Davis L, editors. Trekking the shore: Changing coastlines and the antiquity of coastal settlements. New York: Springer; 2011. p. 405-419. https://doi.org/10.1007/978-1-4419-8219-3_17 [ Links ]
29.Giovas CM, Fitzpatrick SM, Stone J. Intensifying collection and size increase tessellated nerite snail (Nerita tessellata) at the Coconut Walk site, Nevis, northern Lesser Antilles, AD 890-1440. J Archaeol Sci. 2013;40:4024-4038. https://doi.org/10.1016/j.jas.2013.05.008 [ Links ]
30.Buchanan WF. Sea shells ashore: A study of the role of shellfish in prehistoric diet and lifestyle at Eland's Bay, southwestern Cape, South Africa. Cape Town: University of Cape Town; 1986. [ Links ]
31.Langejans GHJ, Dusseldorp GL, Van Niekerk K, Henshilwood CS. A hazy shade of winter: late Pleistocene environments and behavioural adaptations at Blombos Cave, South Africa. In: Runge J, editor. New studies on former and recent landscape changes in Africa. New York: CRC Press; 2013. p. 19-51. [ Links ]
32.Henshilwood CS. Holocene prehistory of the southern Cape, South Africa. Cambridge Monographs in African Archaeology. Oxford: BAR Publishing; 2008. [ Links ]
33.Kilburn R, Rippey E. Sea shells of southern Africa. Johannesburg: Macmillan South Africa; 1982. [ Links ]
34.Jerardino A, Marean CW. Shellfish gathering, marine paleoecology and modern human behavior: Perspectives from Cave PP13B, Pinnacle Point, South Africa. J Hum Evol. 2010;59:412-424. https://doi.org/10.1016/j.jhevol.2010.07.003 [ Links ]
35.Branch G, Branch M. The living shores of southern Africa. Cape Town: Struik; 1981. [ Links ]
36.Jerardino A. Shell density as proxy for reconstructing prehistoric aquatic resource exploitation: Perspectives from southern Africa. J Archaeol Sci Rep. 2015;6:637-644. [ Links ]
37.McLachlan A, Lombard HW. Growth and production in exploited and unexploited populations of a rocky shore gastropod, Turbo sarmaticus. The Veliger. 1981;23:221-229. [ Links ]
38.Langejans GH, Van Niekerk KL, Dusseldorp GL, Thackeray JF. Middle Stone Age shellfish exploitation: Potential indications for mass collecting and resource intensification at Blombos Cave and Klasies River, South Africa. Quat Int. 2012;270:80-94. https://doi.org/10.1016/j.quaint.2011.09.003 [ Links ]
39.Clark BC, Griffiths CL. Ecological energetic of mussels Choromytilus meridionalis under simulated intertidal rock pool condition. J Exp Mar Biol Ecol. 1990;137:63-77. https://doi.org/10.1016/0022-0981(90)90060-P [ Links ]
40.Marshall DJ, McQuaid CD. Differential physiological and behavioural responses of the intertidal mussels, Choromytilus meridionalis (Kr.) and Perna perna L., to exposure to hypoxia and air: A basis for spatial separation. J Exp Mar Biol Ecol. 1993;171:225-237. https://doi.org/10.1016/0022-0981(93)90005-9 [ Links ]
41.Bustamante RH, Branch GM. Large scale patterns and trophic structure of southern African rocky shores: The roles of geographic variation and wave exposure. J Biogeogr. 1996;23(3):339-351. https://doi.org/10.1046/j.1365-2699.1996.00026.x [ Links ]
42.Zardi GI, Nicastro KR, McQuaid CD, Erlandsson J. Sand and wave induced mortality in indigenous (Perna perna) and invasive (Mytilus galloprovincialis) mussels. Mar Biol. 2008;153:853-858. https://doi.org/10.1007/s00227-007-0857-z [ Links ]
43.Jerardino A, Branch GM, Navarro R. Human impact on precolonial West Coast marine environments of South Africa. In: Erlandson JM, Rick TC, editors. Human impacts on marine environments. Berkeley, CA: University of California Press; 2008. p. 279-296. [ Links ]
44.Foster GG, Hodgson AN, Balarin M. Effect of diet on growth rate and reproductive fitness of Turbo sarmaticus (Mollusca: Vetigastropoda: Turbinidae). Mar Biol. 1999;134:307-315. https://doi.org/10.1007/s002270050548 [ Links ]
45.Ryano KP. The Later Stone Age in the southern Cape, South Africa, during the Terminal Pleistocene/Early Holocene with a focus on Klipdrift Cave [PhD thesis]. Johannesburg: University of the Witwatersrand; 2014. [ Links ]
46.Henshilwood CS, Sealy JC, Yates R, Cruz-Uribe K, Goldberg P, Grine FE, et al. Klein Blombos Cave, southern Cape, South Africa: Preliminary report on the 1992-1999 excavations of the Middle Stone Age levels. J Archaeol Sci. 2001;28:421-448. https://doi.org/10.1006/jasc.2000.0638 [ Links ]
47.Jerardino A. Large shell middens in Lamberts Bay, South Africa: A case of hunter-gatherer resource intensification. J Archaeol Sci. 2010;37:2291-2302. https://doi.org/10.1016/j.jas.2010.04.002 [ Links ]
48.Jerardino A. Prehistoric exploitation of marine resources in southern Africa with particular reference to shellfish gathering: Opportunities and continuities. Pyrenae. 2010;1(41):7-52. [ Links ]
49.McQuaid CD, Branch GM. Influence of sea temperature, substratum and wave exposure on rock intertidal communities: An analysis of faunal and floral biomass. Mar Ecol. 1984;19:145-151. https://doi.org/10.3354/meps019145 [ Links ]
50.Sigman DM, Hain MP. The biological productivity of the ocean. Nature Education Knowledge. 2012;3(6):4. [ Links ]
51.Sachs JP, Anderson RF. Increased productivity in the subantarctic ocean during Heinrich events. Nature. 2005;434:1118. https://doi.org/10.1038/nature03544 [ Links ]
52.Foster GG, Hodgson AN. Intertidal population structure of the edible mollusc Turbo sarmaticus (Vetigastropoda) at an unexploited and exploited sites along the coast of the Eastern Cape Province, South Africa. Afr Zool. 2000;35(2):173-183. https://doi.org/10.1080/15627020.2000.11657088 [ Links ]
53.Proudfoot L, Kaehler S, McGarry DK, Uppink PA, Aereboe M, Morris KM. Exploitation status of infralittoral abalone (Haliotis midae) and alikreukel (Turbo sarmaticus) in the southern section of the Eastern Cape coast, South Africa. S Afr J Sci. 2006;102:162-168. [ Links ]
54.Halkett D, Hart T, Yates R, Volman TP, Parkington JE, Orton J, et al. First excavation of intact Middle Stone Age layers at Ysterfontein, Western Cape Province, South Africa: Implications for Middle Stone Age ecology. J Archaeol Sci. 2003;30:955-971. https://doi.org/10.1016/S0305-4403(02)00273-X [ Links ]
55.Parkington J. Middens and moderns: Shellfishing and the Middle Stone Age of the Western Cape. S Afr J Sci. 2003;99:243-247. [ Links ]
56.Tonner TWW. Later Stone Age shellfishing behaviour at Dunefield Midden (Western Cape, South Africa). J Archaeol Sci. 2005;32:1390-1407. https://doi.org/10.1016/j.jas.2005.03.017 [ Links ]
57.Deacon J. Changing patterns in the Late Pleistocene/Early Holocene prehistory of southern Africa as seen from the Nelson Bay Cave stone artifact sequence. Quat Res. 1978;10:84-111. https://doi.org/10.1016/0033-5894(78)90015-7 [ Links ]
58.Clark PU, Dyke AS, Shakun JD, Carlson AE, Clark J, Wohlfarth B, et al. The Last Glacial Maximum. Science. 2009;325:710-714. https://doi.org/10.1126/science.1172873 [ Links ]
59.Thackeray JF, Scott L. The Younger Dryas in the Wonderkrater sequence, South Africa? Ann Transv Mus. 2006;43:111-112. [ Links ]
60.Fitchett JM, Grab SW, Bamford MK, Mackay AW. Late Quaternary research southern Africa: Progress, challenges and future trajectories. Trans R Soc S Afr. 2017;72(3):280-293. https://doi.org/10.1080/0035919X.2017.1297966 [ Links ]
 Correspondence:
Kokeli Ryano
kpryano@gmail.com
Received: 11 Sep. 2018
Revised: 03 Mar. 2019
Accepted: 16 May 2019
Published: 26 Sep. 2019
EDITOR: Maryna Steyn
FUNDING: Research Council of Norway, University of Bergen, University of the Witwatersrand, National Research Foundation (South Africa), Palaeontological Scientific Trust (PAST), European Research Council
Supplementary Material
The supplementary file is available here: [Supplementary file]

