


Services on Demand
Article
 English (pdf)
 Article in xml format
 Article references
Indicators

Related links
-
 Cited by Google
 -
 Similars in Google
Share

 Permalink
South African Journal of Science
On-line version ISSN 1996-7489
Print version ISSN 0038-2353
S. Afr. j. sci. vol.115 n.9-10 Pretoria Sep./Oct. 2019
http://dx.doi.org/10.17159/sajs.2019/6028
RESEARCH ARTICLE
Rainfall and river flow trends for the Western Cape Province, South Africa
Rakhee Lakhraj-GovenderI; Stefan W. GrabII
ISchool of Environmental, Water and Earth Sciences, Tshwane University of Technology, Pretoria, South Africa
IISchool of Geography, Archaeology and Environmental Studies, University of the Witwatersrand, Johannesburg, South Africa
ABSTRACT
Climate change has the potential to alter the spatio-temporal distribution of rainfall, subsequently affecting the supply and demand of water resources. In a water-stressed country such as South Africa, this effect has significant consequences. To this end, we investigated annual and winter rainfall and river flow trends for the Western Cape Province over two periods: 1987-2017 and 1960-2017. Annual rainfall for the most recent 30-year period shows decreasing trends, with the largest magnitude of decrease at the SA Astronomical Observatory rainfall station (-54.38 mm/decade). With the exception of the significant decreasing winter rainfall trend at Langewens (-34.88 mm/decade), the trends vary between stations for the period 1960-2017. For the period 1987-2017, statistically significant decreasing winter trends were found at four of the seven stations, and range from -6.8 mm/decade at Cape Columbine to -34.88 mm/decade at Langewens. Similarly, the magnitudes of decreasing winter river flow at Bree@Ceres and Berg@Franschoek are greater for the more recent 30-year period than for 1960-2017. Correlation coefficients for Vilij@Voeliv rainfall and four river flow stations (Berg@Franschoek, Bree@Ceres, Wit River@Drosterkloof and Little Berg@Nieuwkloof) are stronger for shorter periods (i.e. 1987-2017 and 2007-2017) than that for the longer period, 1960-2017. The Intergovernmental Panel on Climate Change emphasises the importance of studies to assist with model prediction uncertainties. To this end, our study expands the understanding of regional hydrological responses to rainfall change in the water stressed region of the Western Cape Province.
SIGNIFICANCE:
•Historical trend analyses provide the basis for future rainfall and river flow projections and also improve our understanding of hydrological responses to rainfall change, which is important for water resource planning and management in light of recent rainfall shortages experienced in the Western Cape region.
•Anthropogenic and natural influences on river systems must be taken into account when assessing the impact of rainfall changes on river flow because these factors ultimately affect water resource management.
•We identified decreasing winter rainfall trends across the Western Cape Province for the most recent three decades
Keywords: Mann-Kendall, water resource management, decreasing trends, spatio-temporal distribution
Introduction
Anthropogenic activities such as an increasing human population, economic development and urbanisation, place enormous pressure on water resources across the globe.1 Climate change significantly impacts the supply and demand of such water resources.2 The Intergovernmental Panel on Climate Change provides robust evidence that current climate change is projected to decrease renewable surface water.3 One of the most significant consequences of climate change is the change in magnitude and frequency of precipitation.4 Rising temperatures increase evaporation levels, spatio-temporal run-off distribution and water resource storage.5 It is anticipated that global warming will intensify the hydrological cycle, resulting in extreme high/low river flows, depending on the region.6 In a global analysis of 200 rivers, significant trends were recorded for one third of these rivers - 45 decreasing and 19 increasing.1
The Intergovernmental Panel on Climate Change reports (2014) indicate that studies examining hydrological responses to climate change in Africa are limited because of inadequate observational data.3 However, there has been some work assessing spatio-temporal rainfall variability across South Africa.7,8, While statistically significant decreases in rainfall were recorded for the central and northeastern regions of South Africa, mixed signals were reported at different stations in some regions, over the period 1960-2010.7 For the period 1921-2015, increasing annual rainfall trends were reported at the majority of stations across the western and southern interior regions, while decreasing rainfall trends were recorded across the northern and northeastern regions of South Africa.8
Studies investigating the relationship between long-term river flow and rainfall trends have been limited in South Africa. For instance, decreasing rainfall trends were measured at four of six stations over the Luvuvhu River catchment, for the period 1920/1921-2005/2006.9 For the same period, two streamflow stations showed increasing trends and two decreasing trends. For the upper Limpopo River catchment (i.e. Crocodile, Marico, Mahalapse and Lotsane Rivers), annual rainfall and evaporative losses were used to calculate the summer surface water balance for the period 1959-2014.10 Here too, decreasing river flow and surface water balance trends were measured.10 Given that no similar studies have been undertaken to assess the situation for the increasingly water-stressed Western Cape Province, our primary aim was to determine rainfall and river flow trends for this region, and to investigate the relationship between historical rainfall and river flow using Mann-Kendall, Sen's slope estimator and descriptive statistics.
Methodology
Study area and data
South Africa is a water-stressed country with high spatio-temporal rainfall variability.11 The Western Cape Province of South Africa has a warm temperate Mediterranean climate, with rainfall predominating during austral winter and early spring.12 Mean annual rainfall varies across the Western Cape, with mountainous regions receiving up to ca 3000 mm of rain, while low-lying regions (40 m) receive less than 200 mm.12 The Western Cape region is well known for its history of water shortages.13 The province recently (2014-2017) experienced the worst water deficiencies in 113 years.13 A recent study focusing on drought monitoring indicators and 3-, 6- and 12-month Standardized Precipitation Indexes for the Western Cape Province, concluded that the 2015/2016 drought was part of a natural cycle.13
To illustrate the spatial variability of rainfall, monthly rainfall data provided by the South African Weather Service for the stations Cape Agulhas, Cape Columbine, Cape Point, Langewens and SA Astronomical Observatory, were used to determine annual and austral winter rainfall trends for the Western Cape region. The remaining rainfall data (i.e. that from Vogel Vilij@Voeliv and Zachariashoek@Wemmershoek stations) were obtained from the South African Department of Water and Sanitation (from the Internet) and used to determine the relationship with river flow stations located downstream (i.e. Bree@Ceres, Berg@Franschoek, Wits River@Drosterkloof, Palmiet@van Aries Kraal and Little Berg@Nieuwkloof). Stations were selected based on the availability of data (stations with data for the entire period of study, i.e. 1960-2017), quality (screening of extremely low/high monthly values for obvious errors) and completeness of data records (does not exceed 5% missing data), and location within the winter rainfall region (Figure 1; Table 1).


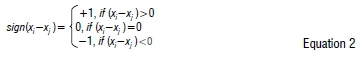
To determine the influence of rainfall changes on river flow, rainfall stations located upstream of the river flow gauges were selected to compare rates of change with time. Annual and winter rainfall and river flow trends were determined using the non-parametric modified Mann-Kendall statistical test and quantified with Sen's slope estimator.14-16 Data for the winter season were analysed given that the selected stations are located in a winter rainfall region. Rainfall for June, July and August were used to calculate the winter rainfall average, as 48% of the mean annual rainfall for this region falls during these winter months.17 Mann-Kendall is calculated as16:

where S is the statistic, n is the number of data points and xi and xj are sequential data points.
The variance of S is calculated as:
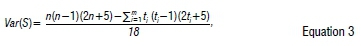
where ti denotes number of ties with i tied values and m is the number of tied groups of values. Then the standard normal variate Z is computed as16:
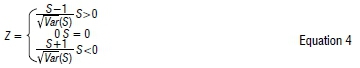
The trend is considered significant when Z>1.96 (or <-1.96) for a selected 5% significance level (α=٠.٠٥). The trend is quantified with Sen's slope estimator16, which is assumed to be linear according to Equation 5:

where t is the time index, Q is the slope and B is the constant.16
The Pearson correlation coefficient was used to determine the relationship between annual rainfall and river flow for the periods 1960-2017, 1987-2017 and 2007-2017. Descriptive statistics (standard deviation and coefficient of variation) were also calculated to compare rainfall and river flow.
Results
Rainfall trends
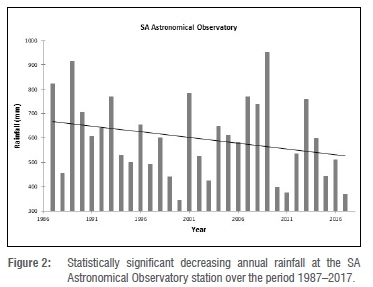
Here we present the results for the annual and winter rainfall trend analyses, with Mann-Kendall and Sen's slope. The majority of results for the Mann-Kendall statistic and Sen's slope estimator are in agreement. For the period 1960-2017, no statistically significant annual rainfall trends are observed at any of the stations in this study. For the period 1987-2017, a statistically significant annual decreasing trend of 54.38 mm/decade was recorded at the SA Astronomical Observatory (Table 2; Figure 2). Notably, the Cape Point station recorded 85 mm of rainfall on 13 November 2013, which corresponds with the flash flood experienced in parts of the Western Cape on that day. This flash flood subsequently affected the annual rainfall trend at Cape Point, which shows a decline in rainfall from 2013 (741.80 mm) to 2017 (325 mm). Rainfall decreased by 279 mm at Cape Agulhas over the 5-year period (2013-2017) for the most recent 30-year period. This may be owing to coastal influences, as this station is located at a distance from the other stations (see Figure 1). The Vogel Vilij@Voeliv and Zachariashoek@Wemmershoek rainfall stations are particularly important stations because of their location within the Western Cape's Water Supply System Dams. Although these stations do not show significant monotonic trends, it is worth noting that the Zachariashoek@Wemmershoek station recorded the highest annual rainfall in 2013 (1753 mm) and lowest values during three consecutive years: 2015 (674 mm), 2016 (918 mm) and 2017 (668 mm), over the period 1960-2017. Similarly, the lowest annual rainfall at Vogel Vilij@Voeliv station was measured for the years 2015 (282 mm), 2016 (520 mm) and 2017 (294 mm) over the period 1960-2017.
During winter, only one of the seven stations (Langewens) show a significant decreasing rainfall trend for the period 1960-2017. However, for the more recent 30-year period (1987-2017), five of the seven stations show significant decreasing rainfall trends (Table 2). Notably, the majority of winter rainfall trends during the period 1960-2017 have become significant for the period 1987-2017 (Table 2). Statistically significant decreasing winter rainfall trends with the greatest magnitudes were identified at Langewens (34.80 mm/decade), SA Astronomical Observatory (-12.20 mm/decade) and Cape Columbine (-22.33 mm/decade) for the most recent 30-year period (Table 2). This finding may reflect the intensifying impact of climate change on rainfall patterns during recent decades. Winter rainfall decreased significantly at Cape Columbine, Cape Agulhas, Cape Point, SA Astronomical Observatory and Langewens, with an overall average decrease of 13.53 mm/decade for the period 1987-2017.
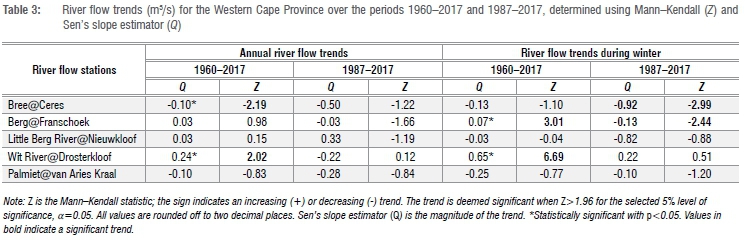
River flow trends
At the hydrological gauge Wits River@Drosterkloof, annual river flow shows a significant increasing trend for the period 1960-2017, which changed to a significant decreasing trend of the same magnitude (-0.24 m3/s) for the more recent period (1987-2017) (Table 3). While the annual Bree@Ceres river flow displays a significant decreasing trend (-0.1 m3/s) for the period 1960-2017, no trend is recorded for the more recent 30-year period. Notably the p-value is 0.07, indicating that the rate of decrease is insignificant. Similarly, decreases (-0.03 m3/s) in annual river flow recorded at Berg@Franschoek for the period 1987-2017 are insignificant (p=0.09).
During winter, statistically decreasing river flow trends are observed at Bree@Ceres, while river flow at Berg@Franschoek significantly increased (0.13 m3/s) for the period 1960-2017. The magnitude of the decrease in river flow at Bree@Ceres is greater for the more recent decades (1987-2017), compared to that for the period 1960-2017. The average winter river flow decrease of 0.52 m3/s (Bree@Ceres and Berg@Franschoek) equates to 5.2% of the average winter river flow decrease over the most recent 30-year period. River flow during winter also changed at the Wit River@Drosterkloof station when comparing the two periods of study, showing an increase for the period 1987-2017. No significant winter or annual river flow trends are evident at the Palmiet@van Aries Kraal flow gauge (Table 3).
Relationship between rainfall and river flow
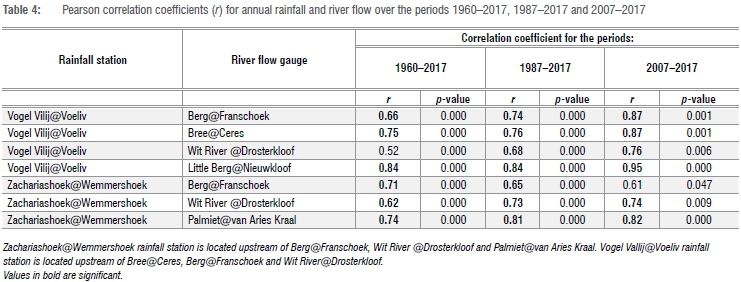
To illustrate the impact of annual rainfall on annual river flow for the region, correlation coefficients were determined for the periods 1960-2017, 1987-2017 and 2007-2017. Correlation coefficients were determined only for rainfall stations (Vogel Vilij@Voeliv and Zachariashoek@Wemmershoek) located upstream of the river flow stations (Table 4). Zachariashoek@Wemmershoek rainfall data were correlated with Berg@Franschoek and Palmiet@van Ariel Kraal river flow data, while Vogel Vallij@Voeliv rainfall data were correlated with river flow data from Bree@Ceres, Berg@Franschoek, Palmiet@van Aries Kraal and Wit River@Drosterkloof stations. Annual river flow is positively related to annual rainfall for the period 1960-2017 (see Figure 3 for an example).
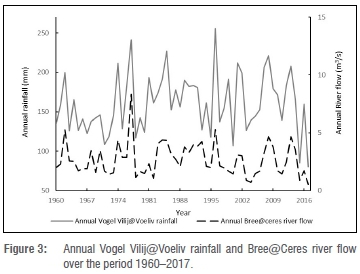
The highest correlation coefficient (0.95) obtained is for Vogel Vilij@Voeliv rainfall station and Little Berg@Nieuwkloof river flow station over the period 2007-2017, likely given their close proximity to each other. The relationship between rainfall at Vilij@Voeliv station with that for several river flow stations (Berg@Franschoek, Bree@Ceres, Wit River@Drosterkloof and Little Berg@Nieuwkloof), is stronger for shorter monitoring periods (i.e. 1987-2017 and 2007-2017) than for the long-term period 1960-2017 (Table 5). The strongest correlations are for rainfall at Vogel Vilij@Voeliv station and river flow at the Little Berg@Nieuwkloof (0.95), Berg@Franschoek (0.87) and Bree@Ceres (0.85) stations for the most recent 10 years (2007-2017). Similarly, correlation coefficients for rainfall at Zachariashoek@Wemmershoek station and river flow at Wit River@Drosterkloof and Palmiet@van Aries Kraal stations are stronger for recent, shorter periods than for the long-term period (1960-2017). This finding suggests that there have been variable extractive or absorptive pressures on river flow during different periods (i.e. 1960-2017, 1987-2017 and 2007-2017), and tentatively points toward anthropogenic influences (such as water extraction or storage) on such river flow.
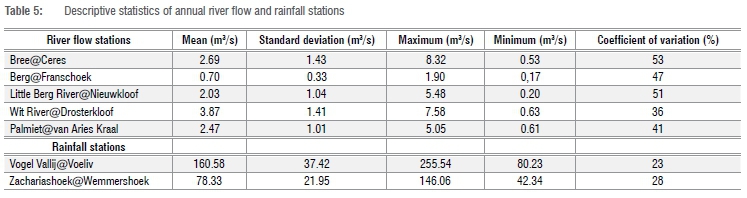
Coefficient of variation results show that the largest annual river flow variability is at Bree@Ceres (53%). The second largest annual river flow variability occurred at Little Berg River@Nieuwkloof (51%), followed by Berg@Franschoek (47%), Palmiet@van Aries Kraal (41%) and Wit River@Drosterkloof (36%) (Table 5). However, annual rainfall variability was smaller in magnitude (i.e. 23% at Vogel Vallij@Voeliv and 28% at Zachariashoek@Wemmershoek) than was river flow. We used coefficient of variation to compare annual variability of rainfall with river flow: river flow varied between 36% and 53%, which is almost double that for the rainfall stations (23% to 28%). This finding suggests that a large portion of river flow variability may not be accounted for by rainfall variability alone, but rather that other factors (such as extraction rates or evaporation rates from river systems) have played an (increasingly) important role in annual river flow variability through time.
Discussion and conclusion
Spatio-temporal availability of water resources is governed by rainfall variability, which impacts hydrology.18 The study of long-term rainfall trends and the potential impact on river flow is important for water resource management planning, which is essential for agriculture, industry and anthropogenic uses. The main aim of this study was to establish annual and winter rainfall and river flow trends and to investigate the relationship between historical rainfall and river flow trends over the Western Cape region. We established these trends using Mann-Kendall and Sen's slope nonparametric statistical analysis for the periods 1987-2017 and 1960-2017.
The magnitude and significance of the annual rainfall trends was determined, at least in part, by the selected period of study (1960-2017 vs 1987-2017). While no trends are shown at four of the seven stations for the period 1960-2017, annual rainfall for the more recent 30-year period showed decreasing trends at six stations across the Western Cape Province. The largest decreasing annual rainfall trend (54.38 mm/decade), compared to trends at remaining stations in this study, occurred at the SA Astronomical Observatory station. Previous work has not adequately presented annual rainfall trends for the Western Cape region because continuous data for the period of analysis (1921-2015) were not available.8 For the aforementioned study, only two inland stations were used in the Western Cape region, and thus the region was not well represented. It seems that the last 7 years have contributed toward the rainfall decrease observed in our study, because a previous study investigating the period 1960-2010 reported no significant or consistent annual rainfall trends for the Western Cape region.7 However, a further study has demonstrated that stations located close to the west coast have reported increasing numbers of rain days.11 Such differences highlight the changing nature of analysis outcomes depending on the temporal framework.
We have found statistically significant decreasing trends at four of the seven rainfall stations during winter over the period 1987-2017. Similarly, a decreasing winter rainfall trend was found across Cape Town over the period 1979-2017 using Mann-Kendall and Sen slope estimator.18 The aforementioned study demonstrates that the 2015-2017 drought was a consequence of the poleward shift of the southern hemisphere moisture corridor and displacement of large-scale synoptic features, such as the jet-stream and South Atlantic storm tracks.18 This poleward shift of moisture corridors, resulting in rainfall shortage, is attributed to the strong influence of Southern Annular Mode in conjunction with expansion of semi-permanent subtropical anticyclones in the South Atlantic and South Indian Oceans.18
Various correlation coefficients between annual rainfall and river flow for different periods (i.e. 1960-2017, 1987-2017 and 2007-2017) indicate that other factors play a role in the declining river flow trends, possibly both anthropogenic (such as extraction of water for consumption and agricultural expansion) or natural (such as an increase in evaporation, stronger and/or more frequent ENSO phases) factors. According to the 'State of Rivers' report for the Berg River system, South African rivers provide water to farmers and rural communities for crops and livestock.19 The 'State of Rivers' report for the Breede River catchment indicates that water is used for intensive irrigation of orchard crops and vineyards for wine and table grapes along the Breede and Palmiet River catchments.20 Water from the Breede River catchment is also transferred to Theewaterskloof Dam, the largest dam supplying water to Cape Town residents.20 Instances in which rainfall decreased but river flow increased (e.g. Wit River@Drosterkloof) may be attributed to run-off or discharge into the river from nearby wineries that produce large quantities of wastewater.21 The higher correlation coefficients recorded for the shorter and more recent periods (1987-2017 and 2007-2017) suggest that river flow is affected by the aforementioned anthropogenic factors at different points in time. The coefficient of variation for annual river flow being almost double that for rainfall, also suggests that river flow variability may not be entirely controlled by rainfall variability, again suggesting the influence of other (likely anthropogenic) factors. Previous studies for the Cobres River basin in southern Portugal also concluded that such results have important implications for water resource management.22
In conclusion, regional climate influences on river flow in the Western Cape region are highly complex because river flow is influenced by rainfall changes (affecting the frequency of flash floods and drought), variations in evaporation rates as a result of temperature variations, and increased water extraction for consumption. Population growth and agricultural and industrial development in South Africa have placed increased pressure on water resources. Future work is required to assess extraction rates and changes in evaporation rates associated with rising temperatures on river flow. Historical trend analyses provide the basis for future rainfall and river flow projections, which then have important implications for water resource planning and management.
Acknowledgements
We thank the South African Weather Service for the rainfall data and the South African Department of Water and Sanitation for hydrological data, obtained from the Internet. We appreciate the constructive inputs provided by the anonymous reviewers.
Authors' contributions
This paper is based on work conducted by R.L-G. for a Master of Science degree. R.L-G. was responsible for data collection, data analyses, methodology and write-up. S.W.G. was responsible for conceptualisation, writing revisions and student supervision.
References
1.Jiménez Cisneros BE, Oki T, Arnell NW, Benito G, Cogley JG, Döll P, et al. Freshwater resources. In: Field CB, Barros VR, Dokken DJ, Mach KJ, Mastrandrea MD, Bilir TE, et al., editors. Climate change 2014: Impacts, adaptation, and vulnerability. Part A: Global and sectoral aspects. Contribution of Working Group II to the Fifth Assessment Report of the Intergovernmental Panel on Climate Change. Cambridge, UK/New York: Cambridge University Press; 2014. p. 229-270. https://doi.org/10.1017/cbo9781107415379.008 [ Links ]
2.New M. Climate change and water resources in the southwestern Cape, South Africa. S Afr J Sci. 2002;98:369-376. https://hdl.handle.net/10520/EJC97508 [ Links ]
3.Niang I, Ruppel OC, Abdrabo MA, Essel A, Lennard C, Padgham J, et al. Africa. In: Barros VR, Field CB, Dokken DJ, Mastrandrea, MD, Mach, KJ, Bilir TE, et al., editors. Climate change 2014: Impacts, adaptation, and vulnerability. Part B: Regional aspects. Contribution of Working Group II to the Fifth Assessment Report of the Intergovernmental Panel on Climate Change. Cambridge, UK/New York: Cambridge University Press; 2014. p. 1199-1265. https://doi.org/10.1017/cbo9781107415379.025 [ Links ]
4.Brekke LD, Kiang JE, Olsen JR, Pulwarty RS, Raff DA, Turnipseed DP, et al. Climate change and water resources management - A federal perspective. USA Geological Survey Circular. 2009;1331, 65 pages. https://doi.org/10.3133/cir1331 [ Links ]
5.Panthi J, Dhahal P, Shrestha ML, Aryal S, Krakauer NY, Pradhanang SM, et al. Spatial and temporal variability of rainfall in the Gandaki River Basin of Nepal Himalaya. Climate. 2015;3:210-226. https://doi.org/10.3390/cli3010210 [ Links ]
6.Asadieh B, Krakauer NY. Global change in streamflow extremes under climate change over the 21st century. Hydrol Earth Syst Sci. 2015;21:5863-5874. https://doi.org/10.5194/hess-21-5863-2017 [ Links ]
7.MacKellar N, New M, Jack C. Observed and modelled trends in rainfall and temperature for South Africa: 1960-2010. S Afr J Sci. 2014;110(7/8), Art. #2013-0353, 13 pages. https://doi.org/10.1590/sajs.2014/20130353 [ Links ]
8.Kruger AC, Nxumalo MP. Historical rainfall trends in South Africa. Water SA. 2017;43:285-297. https://doi.org/10.4314/wsa.v43i2.12 [ Links ]
9.Odiyo JO, Makungo R, Nkuna TR. Long-term changes and variability in rainfall and streamflow in Luvivhu river catchment, South Africa. S Afr J Sci. 2015;111, Art. #2014-0169, 9 pages. https://doi.org/10.17159/sajs.2015/20140169 [ Links ]
10.Jury M. Climate influences on upper Limpopo river flow. Water SA. 2016;42:63-71. https://doi.org/10.4314/wsa.v42i1.08 [ Links ]
11.Naidoo S, Rodda N, Stenstrom TA, Schmidt S, Dent M, Bux F, et al. Water security in South Africa: Perceptions and municipal obligations, governance and water reuse. Water SA. 2016;42:456-465. https://doi.org/10.4314/wsa.v42i3.11 [ Links ]
12.South African Department of Water Affairs and Forestry (DWAF). The assessment of water availability in the Berg Catchment (WMA 19) by means of water resource related models. Report no. 5: Update of catchment hydrology. Volume 2: Upper Breede River. Pretoria: National Water Resource Planning, DWAF; 2007. Available from: http://www.dwa.gov.za/Documents/Other/WMA/19/Reports/Rep5-Vol2-Upper%20Breede%20River%20Hydrology.pdf [ Links ]
13.Botai CM, Botai JO, De Wit JP, Ncongwane KP, Adeola AM. Drought characteristics over the Western Cape Province, South Africa. Water. 2017;9:876-892. https://doi.org/10.3390/w9110876 [ Links ]
14.Mann HB. Nonparametric tests against trend. Econometrica. 1945;13:245-259. https://doi.org/10.2307/1907187 [ Links ]
15.Sen PK. Estimates of the regression coefficient based on Kendall's Tau. J Am Stat Assoc. 1968;63:1379-1389. https://doi.org/10.1080/01621459.1968.10480934 [ Links ]
16.Novotny EV, Stefan HG. Stream flow in Minnesota: Indicator of climate change. J Hydrol. 2007;334:319-333. https://doi.org/10.1016/j.jhydrol.2006.10.011 [ Links ]
17.Du Plessis JA, Schloms B. An investigation into the evidence of seasonal rainfall pattern shifts in the Western Cape, South Africa. J S Afr Inst Civ Eng. 2017;59:47-55. https://doi.org/10.17159/2309-8775/2017/v59n4a5 [ Links ]
18.Sousa PM, Blamey R, Reason CJC, Ramos AM, Trigo RM. The 'Day Zero' Cape Town drought and the poleward migration of moisture corridors. Environ Res Lett. 2018;13:1-11. https://doi.org/10.1088/1748-9326/aaebc7 [ Links ]
19.River Health Programme. State-of-Rivers report: Berg River System. Pretoria: Department of Water Affairs and Forestry; 2004. [ Links ]
20.River Health Programme. State-of-Rivers report: Rivers of the Breede Water Management Area. Pretoria: Department of Water Affairs and Forestry; 2011. [ Links ]
21.Howell CL, Myburgh PA, Lategan EL, Hoffman JE. Seasonal variation in composition of winery wastewater in the Breede River Valley with respect to classical water quality parameters. S Afr J Enol Vitic. 2015;37:31-38. https://doi.org/10.21548/37-1-756 [ Links ]
22.Da Silva RM, Santos CAG, Moreira M, Corte-Real J, Silva VCL, Medeiros IC. Rainfall and river flow trends using Mann Kendall and Sen's slope estimator statistical tests in the Cobres River Basin. Nat Hazards. 2015;77:1205-1221. https://doi.org/10.1007/s11069-015-1644-7 [ Links ]
 Correspondence:
Rakhee Lakhraj-Govender
rakhee.lg@gmail.com
Received: 12 Feb. 2019
Revised: 06 May 2019
Accepted: 07 May 2019
Published: 26 Sep. 2019
EDITORS: Nicolas Beukes, Yali Woyessa
FUNDING: None

