


Servicios Personalizados
Articulo
 Inglés (pdf)
 Articulo en XML
 Referencias del artículo
Indicadores

Links relacionados
-
 Citado por Google
 -
 Similares en Google
Compartir

 Permalink
South African Journal of Science
versión On-line ISSN 1996-7489
versión impresa ISSN 0038-2353
S. Afr. j. sci. vol.115 no.9-10 Pretoria sep./oct. 2019
http://dx.doi.org/10.17159/sajs.2019/5724
RESEARCH ARTICLE
Granger causality of the local Hadley cell and large-scale cloud cover over South Africa
Dawn D. MahloboI; Thando NdaranaII; Stefan W. GrabI; Francois A. EngelbrechtIII
ISchool of Geography, Archaeology and Environmental Studies, University of the Witwatersrand, Johannesburg, South Africa
IIDepartment of Geography, Geoinformatics and Meteorology, University of Pretoria, Pretoria, South Africa
IIIGlobal Change Institute, University of the Witwatersrand, Johannesburg, South Africa
ABSTRACT
This study demonstrates that Hadley cell dynamics could be used as a proxy to determine cloud cover and thus solar energy potential over South Africa. Granger causality was used to investigate causal interactions between the Hadley cell and cloud cover for the period 1980-2015, and such links were established. Areas of strong causality are found over the northwestern parts of South Africa. Moreover, weak causality from cloud cover to the Hadley cell does exist, with vertical velocity being the main variable responsible for this causality, which hence indirectly links cloud cover to Hadley cell causality.
SIGNIFICANCE:
•Hadley cell dynamics may be used to identify regions of cloudlessness over South Africa.
•Hadley cell dynamics may further be used as a proxy for cloud cover towards understanding the solar energy potential in South Africa within the context of climate variability and change
Keywords: Hadley circulation, mass flux, total cloud cover, solar energy potential
Introduction
The South African government has identified a number of renewable energy options to inform the country's energy mix on the 2030 horizon and beyond.1 One of these options is solar energy, which depends on the ability of incoming short wave radiation to penetrate through the atmosphere to the ground, where solar energy conversion technologies are located. In this study, we demonstrate that Hadley cell dynamics could be used as a proxy to determine cloud cover and thus the solar energy potential over South Africa. The abundance in solar radiation and sunshine over South Africa is because the country is located in the subtropical belt - exactly where the Hadley cell descending branch is located. Solar radiation reaching the surface has a strong longitudinal gradient, which exists in relation to the longitudinal gradients in cloud cover, rainfall and thus sunshine duration.2 Interactions between the Hadley cell and cloud cover may therefore be key in understanding and anticipating the potential of solar power as a renewable energy source for South Africa.
The Hadley circulation is a key component of the global circulation and accounts for ascending motion in the tropics and descending air in the subtropics. Weather and climate in both the tropics and subtropics are thus strongly influenced by the Hadley circulation.3 Southern Africa, with its location in the subtropics, is on average under the influence of the descending branch of the Hadley cell.3 This influence is the main reason why southern Africa is in general a relatively dry and warm region; in fact, much of southern Africa is semi-arid.4 Winters in South Africa are generally dry with clear skies over the interior, due to the dominance of the subtropical high-pressure belt (the surface manifestation of the descending branch of the Hadley cell) during these months.5 It is only the most southern parts of southern Africa, namely the southwestern Cape and Cape south coast of South Africa, that receive substantial amounts of rainfall during winter.3 During wet summers, the non-divergent part of the Hadley circulation causes a southward shift in the Indian Ocean cyclonic cell, resulting in surplus water vapour transport across southern Africa from the north.6 During dry summers, the spatial extent of the tropical western Indian Ocean anticyclone decreases, thereby leading to the reduction of water vapour transport from the southeast, whilst the descending branch of the Hadley cell strengthens over southern Africa.7 Both the long-term climate and inter-annual climate variability over southern Africa are thus strongly controlled by Hadley cell circulation dynamics, with pronounced implications for the region's agriculture, water security and biodiversity. Moreover, Hadley cell dynamics have also been linked to variations in sunshine duration across southern Africa, which may be important within the context of a growing renewable energy sector in the region.8
The meridional shifts of the Hadley cell are linked to the seasonal migration of the Inter-Tropical Convergence Zone (ITCZ).9 Tropical disturbances occur in summer over southern Africa as the ITCZ propagates southwards to approximately 17°S.3 Cloud bands associated with most of the late summer rainfall over the region link the ITCZ to the north3 with a westerly wave to the south. These tropical-extratropical cloud bands are defined as regions of elongated cloudiness that start in the tropics and extend southeastwards into the mid-latitudes.6 The cloud bands export moisture and heat from the tropics to the middle latitudes, through which the deep Hadley cell overturning is replaced during periods of weakened ITCZ activity.10 The Hadley cell overturning is associated with convective intensity over southern Africa, anticyclonic ridging and moist air inflows from the Indian Ocean.9
Climate change over southern Africa may be anticipated to be closely linked to changes in the dynamics of the regional Hadley cell. In fact, the mean positions of storm tracks, high and low pressure systems, jet streams and associated precipitation patterns are all projected to change in response to the expansion of the Hadley cell in a warmer world.5 Over southern Africa, the strengthening and expanding subtropical high-pressure belt is, under climate change, projected to contribute to the southward displacement (or blocking) of frontal systems bringing rainfall over southern Africa.11 Moreover, a general strengthening of the descending branch of the Hadley cell in summer has been postulated as a key reason why southern Africa is projected to become generally drier under global warming.3,11
Large-scale cloudiness over South Africa is linked to the dynamics of the Hadley circulation over the country.8 Whether changes in cloudiness are directly caused by changes in the Hadley circulation or whether cloudiness may impact on the Hadley cell via feedback processes, remains to be rigorously investigated. To address this gap, causality between changes in the Hadley cell and cloud cover need to be established. Thus, the aim of this study was to use Granger causality12 to investigate causal links between the Hadley cell and large-scale cloud cover over South Africa. Understanding such links is important in understanding the rainfall anomalies and solar energy potential in the region, within the context of climate variability and change.
Data and methods
Data
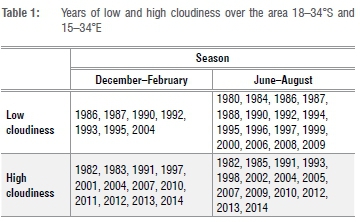
The study covers the period 1980 to 2015. Data used in this study were extracted from the European Centre for Medium-Range Weather Forecasts (ECMWF) Interim Reanalysis (ERA-Interim).13 The ERA-Interim has a fine resolution and is sufficient enough to provide appropriate diagnostics of the Hadley circulation over South Africa. Meridional velocity from 1000 hPa to 10 hPa was used to calculate the zonally averaged mass stream function (see Supplementary appendix 1). The zonally asymmetric Hadley cell time series was calculated using the mass flux,14 as outlined in Supplementary appendix 2. The vertical velocity at 500 hPa (which is the level of maximum upward vertical motion) was used to calculate the Hadley cell diagnostics (Supplementary appendix 2). Data are on a horizontal resolution of 0.75°x 0.75° on 37 pressure levels.13,15 Total cloud cover was also extracted from the ERA-Interim data set. To account for both short- and long-term effects of the Hadley cell on total cloud cover and vice versa, daily time steps were used. The total cloud cover data for the area 18-34°S and 15-34°E was divided into low and high cloudiness years. The high and low cloudiness years for December-January-February (DJF) and June-July-August (JJA) are shown in Table 1.
Methods
Several studies have used linear and lag correlation statistics to help establish the links between time series in climate science.16,17 However, it is a challenge to identify the direction of causality from such methods. Causality studies between climate variables have also been undertaken through Bayesian network inference18,19 and Granger causality.20-23 The two frameworks were compared to each other using biological data, from which it was established that the Bayesian network performs better for shorter temporal data sets, while for longer data sets, Granger causality seems to perform better.24 One remarkable feature of Granger causality is that it has a decomposition property, which is not present in the Bayesian network inference.24 This feature enables one to establish the best frequency at which causality may be established between two time series. Thus, Granger causality seems to be the best method for testing the direction and strength of causality between two time series. We therefore introduce the notion of Granger causality to establish the causal relationships between the Hadley cell and cloud cover.
Granger causality can be defined as variable Y Granger causing variable X, if X can be predicted better by using the past values of Y, more than the past values of X itself. This definition, when applied to the study, means that the cloud cover has a Granger causal relationship to the Hadley cell, if past values of cloud cover could be used to help predict the Hadley cell. Granger causality analysis tests for both the presence and direction of causality.25 Granger causality was initially designed and mainly applied to econometrix data, yet several studies have applied Granger causality to the atmospheric sciences.19-22 The main challenge in employing Granger causality to climate data is the fact that climate systems are highly non-linear.12 Studies have employed non-linear Granger causality to overcome such challenges.26 However, it has been shown that using average data (e.g. seasonal averages) can produce near-linear relationships between climate variables,23 and hence reasonable estimates of causal links can be obtained from a linear model.
Granger causality studies using climate data include a causality study investigating southern and northern hemisphere temperatures27, and a Granger causality study between the North Atlantic Oscillation and Atlantic sea surface temperatures at a seasonal scale20. Although most climate studies make use of a bivariate system when investigating causality between two variables20,22,26, bivariate systems have problems of spurious causality and of non-causality due to omission of a relevant variable22. These problems can be solved by introducing an auxiliary third variable in the analysis.22,28 An alternative method for shorter time series is cross validation.26 Other techniques used to test a direct Granger causality of Y on X include ex conditional Granger causality29 and partial Granger causality30. However, studies have not yet employed Granger causality to the Hadley cell and cloud cover. We thus tested this interaction using a four-step procedure including unit root testing and differencing, selecting the appropriate model for the time series data, and testing for Granger causality.
Unit root testing
The fundamental issue in testing for causality between variables is to use a suitable time series that is stationary or does not contain unit roots. Stationarity in a time series is defined as one with a statistical process (mean or standard deviation) that does not change over time, whereas a non-stationary time series may lead to false causality results.31 The most common way of testing for stationarity is through the augmented Dickey-Fuller test which uses estimates from an augmented autoregression as follows:

where yt represents all variables (in the natural logarithmic form) at time t, ∆ is the first difference operator, β1 is a constant, and n is the optimal lag length on the dependent variable. The test for a unit root is conducted on the coefficient of yt-1 in the regression model. The null and alternative hypotheses are represented by (H0) and (H1), respectively. The null hypothesis states that data need to be differenced to make it stationary, while the alternative hypothesis states that data are stationary and do not need to be differenced. To check for the existence of a unit root in variable yt, we use: H0:= 0 versus H1:< 0. The coefficient should be significantly different from zero (less than zero) for the hypothesis that y contains a unit root to be rejected. Rejection of the null hypothesis indicates stationarity in the series.
Differencing
The Granger causality test is ideal for stationary time series; however, if any of the time series in question are not stationary or if there is a root, then the series should be temporally differenced (Equation 2). For a variable y depending on another variable x (i.e. y = f(x)), and for a set of n points on an equi-spaced grid, the first derivative with respect to time t, f't at i = 1 ,.....n, the backward difference will be given by:

Model selection
Vector autoregressions (VAR) are often used in climate science to estimate the maximum lags used for testing data for Granger causality.32-34 The Akaike information criterion (AIC) and the Bayesian information criterion (BIC) are used to find the optimal maximum lag.35 These two information criteria follow a general form, which consists of the log-likelihood estimates as well as the penalty functions for the parameters in the model. Model estimates with the least information criteria is the best fitting model. The general information criteria are given as:

where ∑^ is an approximation of the residual covariance matrix associated with the fitted VAR(p) model, CT is a deterministic penalty term, T denotes the number of observations used for estimation and p denotes the lag order. The definition of the penalty term CT differs according to the choice of information criterion used:
for AIC,

and for BIC,

where k is the number of equations in the VAR model.
Granger causality
The presence and direction of Granger causality between each grid point of the Hadley cell and cloud cover is tested by means of VAR, indicated by Equations 6 and 7:

and

where α, β, and γ are regression coefficients, e is error term, and s is lag length, which is determined by using AIC and BIC (Equation 3). The structural VAR consisting of present values of the Hadley cell and cloud cover as functions of the lagged values of the dependent variables, and the present and lagged values of the independent variables, is the basis for the derivation of Equations 6 and 7. Structural VAR is based on the fact that for each season, present values of both the Hadley cell and cloud cover depend not only on present values of the other variable, but also on the history of the other variable. The direction of causal order is thus determined by estimating the restricted forms of Equations 6 or 7, and by eliminating the causal variable. For example, to determine whether the Hadley cell Granger causes cloud cover, we estimate a restricted form of Equation 6 in which cloud cover is eliminated. The restricted version of Equation 6 is thus:

Conversely, it can also be determined whether the Hadley cell can be Granger caused by cloud cover, by estimating a restricted version of Equation 7 where the lagged values of the Hadley cell are omitted. We further tested whether the restricted model is statistically significantly different from the unrestricted model, as per Equation 9:
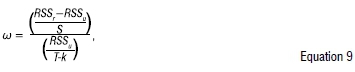
where RSS is the sum of the residuals squared; the subscripts r and u refer to the restricted and unrestricted versions of Equations 6 or 7, respectively; T is the number of observations; k is the number of regressors in the unrestricted version of the equation; and s is the number of coefficients restricted to zero in Equation 8. The test statistic can be evaluated against an F distribution with s and T-k degrees of freedom in the numerator and denominator, respectively, in order to evaluate the null hypothesis that the cloud cover does not Granger cause the Hadley cell.
In this study, Equations 6 and 7 are used to analyse links between the Hadley cell and total cloud cover for each season (DJF and JJA) separately. The restrictive assumption is then constructed, such that the coefficients vary with the lag lengths and seasons. Equations 6 and 7 are then modified to cater for each season. As daily time steps were used to construct time series for both DJF and JJA, a lag length of one thus indicates the previous day, a lag length of two implies two previous days, and so on. It is recognised that the detection of Granger causality does not necessarily imply a physical causal mechanism between the two fields. Conclusions about the presence and direction of causality depend on the validity of the statistical models. A challenge of using Granger causality between two variables is that Granger causal implication estimates may be biased by the omission of relevant variables (e.g. vertical motion due to weather systems may contribute to total cloud cover, and its omission may have bearing on the Granger causal statistic) that are in fact the causal variables. Notwithstanding such limitations, the causality test is more reliable than lagged correlation statistics because the latter shows only the interaction between two variables, and may not indicate the presence and direction of causality.
Results and discussion
Climatology of the Hadley cell and total cloud cover
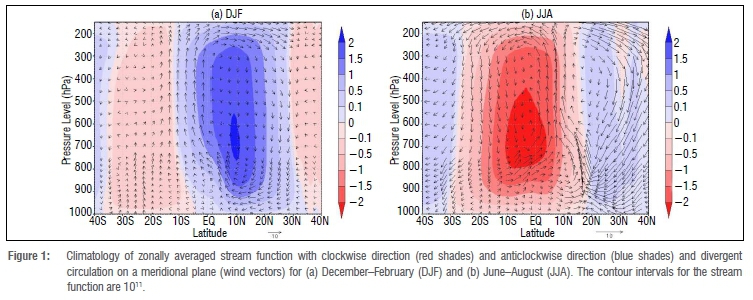
The Hadley cell is usually defined in terms of the zonally averaged stream function.5,10 The zonally averaged stream function (defined in Supplementary appendix 1) is displayed in Figure 1, together with the vertical cross section of the divergent circulation in the meridional plane displayed by means of wind vectors. The clockwise direction of the mass stream function is indicated by blue shades; similarly the anticlockwise direction is illustrated by red shades of the stream function. The Hadley circulation consists of two branches: an ascending branch equatorward and a descending branch poleward. On the descending branch of the Hadley cell, the wind vectors advocate downward motion. Similarly, vertical ascent is evident on the ascending branch of the Hadley cell. The seasonal strength of the Hadley circulation is also evident from the stream function as well as the divergent circulation. In DJF, the Hadley circulation is positioned more southwards; its descending branch is weak and has a wider gradient (Figure 1a). In JJA, the Hadley cell is positioned more northwards; it is more pronounced and stronger, as indicated by the tight gradient of the stream function (Figure 1b).
The meridional migration of the Hadley cell also displays intraseasonal variability as demonstrated by composite anomalies of the mass stream function for low and high cloudiness years during DJF (Figure 2a and Figure 2b) and JJA (Figure 2c and Figure 2d). For the low cloudiness years, the mass stream function anomalies have reversed sign compared to the climatological mass stream function shown in Figure 1a and 1b. This means that for the low cloudiness years (Table 1) during DJF (Figure 2a) and JJA (Figure 2c), the Hadley cell is positioned towards the equator and its width is narrower than in climatology.36 The equatorward displacement of the Hadley cell is linked to subsidence over the subtropical regions of the southern hemisphere. In high cloudiness years for both DJF (Figure 2b) and JJA (Figure 2d), the mass stream function anomalies have the same sign as the climatological mass stream function.36 In both seasons, the statistical significance covers a wider area for the high cloudiness years than the low cloudiness years, implying that the Hadley cell extends more polewards than normal, enhancing cloud formation over the southern hemisphere subtropics. While the zonally averaged stream function gives a general overview of the Hadley cell, it is easy to miss regional features of the Hadley circulation due to zonal averaging. Therefore, to examine the behaviour of the Hadley cell over South Africa, a zonally asymmetric diagnostic of the Hadley cell is necessary.
The zonally asymmetric Hadley cell is represented by the meridional mass flux at 500 hPa, as indicated in Supplementary appendix 2. The climatology of the zonally asymmetric Hadley cell and total cloud cover for DJF is provided in Figures 3 and 4, respectively. For both the DJF and JJA seasons (Figure 3 and Figure 4), the downward mass flux is dominant over the country, as indicated by negative mass flux values. Simultaneously, lower cloud cover is evident throughout the country. Both mass flux and cloud cover are indicative of subtropical weather. Vertical velocity plays an integral role in both the Hadley cell and total cloud cover. Negative vertical velocity is associated with vertical uplift and cloud formation, whereas positive vertical velocity values indicate subsidence and limited cloud development.
Negative vertical velocity is evident in DJF (Figure 3 and Figure 4), but very close to zero, which means that even with some vertical uplift, it is lower because the mean vertical motion over South Africa is downward. The eastern escarpment also indicates negative values of vertical velocity. High negative vertical velocity values are confined to areas of positive mass flux over the northern parts of the subcontinent. However, over South Africa, negative velocity is confined to the western interior of South Africa and the eastern escarpment. These areas are characterised by the downward mass flux (Figure 3) and relatively higher values of cloud cover (Figure 4), which means the downward mass flux is not responsible for the negative vertical velocity, but is rather the effect of weather systems that dominate over interior regions of South Africa during summer months, while uplift is due to orography (over the eastern escarpment) that contributes to negative vertical velocity and cloud cover. In JJA, a semi-permanent high pressure system dominates the country, resulting in a strong negative mass flux (Figure 5), as well as limited cloud development over the country (Figure 6). Subsidence due to the Hadley cell could be the main cause for the lack of upward vertical motion (negative vertical velocity), and could mean that limited cloud development results from a lack of upward vertical motion. These results demonstrate the role that vertical velocity in both the Hadley cell and cloud cover exhibit. Therefore, the effect of vertical velocity should thus be kept in mind when interpreting causality between the Hadley cell and cloud cover.
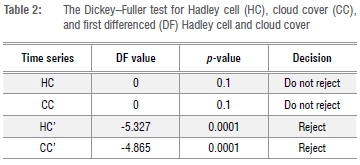
Stationarity
Based on the results of the augmented Dickey-Fuller test (Table 2), the unit root hypothesis could not be rejected for both time series; however, when the backward difference was performed for both time series, the unit hypothesis was rejected. This result suggests that both Hadley cell and total cloud cover are not stationary and might be considered stationary at the first differenced level. After attaining stationarity of the time series, the best model was further investigated by identifying the maximum lags that could be used in the VAR model. Most climate studies have used a lag length of 4 as the optimal length for causality analysis. In this study, we established an optimal lag length by using the AIC and BIC for DJF and JJA. Results from the two information criterion tests favoured a lag length of 2 as the maximum lag for fitting the VAR model (Figure 7a and 7b). This means that the previous 2 days are critical for predicting cloud cover when using the Hadley cell as the predictor, and vice versa.
Correlations
A number of studies make use of linear and lag correlations to study associations between two time series in climate science.16,17 Lagged correlations between the Hadley cell and total cloud cover for DJF and JJA are averaged over South Africa (Figure 7c and Figure 7d). In the first week (1 to 7 days), relatively higher correlations (0.56 for DJF; 0.39 to 0.516 for JJA) were established. A substantial decrease in lag lengths then follows from the second week onwards. The decrease in lagged correlations from the second week onwards could mean that longer timescales (e.g. weeks to months) might have detrimental effects on the prediction of total cloud cover using the Hadley cell. In the first week, the second day (day 2) gave the highest correlation (0.56 and 0.516) for both DJF and JJA.
To determine zonal gradients of lag correlations between the Hadley cell and total cloud cover for DJF and JJA, a zonally asymmetric analysis for lag lengths of 1 to 4 days was performed, as informed by Figures 3-6. Positive correlations for lag lengths of 1 to 2 days over South Africa are indicated for the northwestern parts of South Africa and Namibia in DJF (Figures 3a, 3b, 4a and 4b). The northwestern parts of South Africa are the most arid in the country, and mostly dominated by the Hadley cell. The eastern parts of South Africa also show positive correlations for lag lengths of 1 to 2 days. No strong correlation is established over the southern interior of South Africa in DJF, which is attributed to the fact that cloud cover over these areas is caused by weather systems that are prevalent over South Africa, rather than the Hadley cell. Lag lengths of 2 days followed by a lag length of 1 day has a stronger positive correlation than lag lengths of 3 and 4 days, as indicated in Figure 3c, Figure 3d, Figure 4c and Figure 4d.
In JJA, a positive correlation between the Hadley cell and cloud cover for lag lengths of 1 and 2 days has been established over the interior of South Africa, as shown in Figure 5a and Figure 5b. This is attributed to the fact that a high pressure system is dominant over the interior of South Africa in JJA.3 Subsidence leading to limited cloud development is hence expected over these areas. A strong positive correlation between the Hadley cell and cloud cover is recorded over the Atlantic Ocean, west of South Africa. From the four lag lengths investigated, the lag length of 1 showed the strongest correlation. No discernible correlation is established over South Africa for lag lengths of 3 to 4 days (Figure 5c, Figure 5d, Figure 6c and Figure 6d).
Granger causality
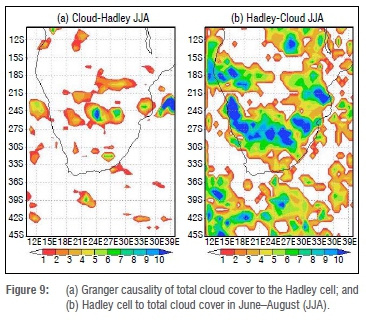
To determine whether variability in cloud cover is caused by the Hadley cell, the bivariate model indicated in Equations 6 and 7 was used. The F-statistic and critical values of the bivariate model were established at each grid point. The presence of Granger causality is denoted by values of the F-statistic being greater than the critical value and, conversely, values of the F-statistic lower than the critical value show the absence of Granger causality. The strength of Granger causality from the Hadley cell to total cloud cover (denoted as HC-CC) and total cloud cover to the Hadley cell (denoted as CC-HC) is indicated in Figures 8 and 9 for DJF and JJA, respectively. The presence of Granger causality is established from the HC-CC interaction over South Africa. In DJF, the western and northwestern regions show higher values of HC-CC causality. However, maximum causality is located over the far northeastern parts of the subcontinent between latitudes 15°S to 10.5°S.
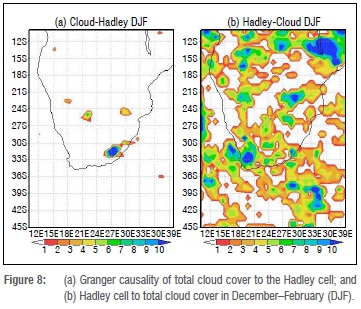
The presence of CC-HC Granger causality has also been established over South Africa, but is limited to only the eastern parts of the country, while causality is absent over the western and southeastern parts. Some places over Mozambique and Zimbabwe indicate very weak CC-HC causality. In JJA, the HC-CC causality is stronger than the CC-HC causality, and the maximum causality values are situated over the northern interior of South Africa. No causality has been established over the southwestern parts of South Africa. One notable feature is that the HC-CC maximum causality has moved further northwards in JJA than it was in DJF, which could be linked with the northwards migration of the ITCZ during austral winter. Although the CC-HC causality is weak over most parts of South Africa, especially in JJA, the southwestern parts advocate an absence of Granger causality.
As previously mentioned,20,22,26 the main challenge with Granger causality in a bivariate model is the exclusion of other variables that may affect the causing variable, thus leading to false causality of the variables being tested. This could mean that, although it is weak, the CC-HC causality may be false as a result of the omission of a third variable that is affecting the causality result. For example, cloud cover is a function of vertical velocity, which in turn may affect the Hadley cell. The effect of vertical velocity due to other weather systems has an indirect impact on the causality of both the Hadley cell and cloud cover. Secondly, the structure of the CC-HC causality in DJF is oriented in a northwesterly to southeasterly direction, resembling the structure of tropical temperature troughs. This orientation could mean that the vertical velocity due to tropical temperature troughs, which are a summer phenomenon over southern Africa,37 is responsible for the causality from the cloud cover to the Hadley cell, leading to CC-HC false causality. In JJA, the HC-CC causality is stronger than the CC-HC causality. The HC-CC stronger causality is greater over the interior and northwards of South Africa. The strong HC-CC causality could be attributed to the fact that the Hadley cell informs limited cloud development over the subtropics and during JJA (Figure 9a). The far northern and southwestern parts of South Africa show relatively weaker HC-CC causality. Cloud cover over the southwestern parts is greater because of frontal systems, and not entirely due to the Hadley cell, and hence produces weaker causality.
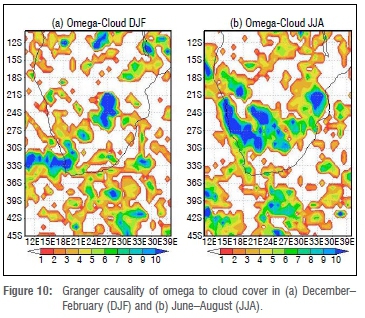
To illustrate the effect of vertical velocity causality on both the Hadley cell and cloud cover, Granger causality was analysed between vertical velocity and cloud cover (Figure 10). The omega to cloud cover interaction is denoted as OMEGA-CC. Causality was established for both DJF and JJA. In DJF, the OMEGA-CC causality is located predominantly over the eastern to western escarpment of South Africa (Figure 10a), which means that vertical velocity due to topography (orographic uplift) is the main cause of cloud cover along the escarpment regions of South Africa. The western and adjacent oceanic regions show maximum OMEGA-CC causality. Strong OMEGA-CC causality is also evident between Mozambique and Zimbabwe. In JJA, most of the South African interior shows very weak OMEGA-CC causality; however, the northern and northwestern parts of South Africa show strong OMEGA-CC causality (Figure 10b). Figure 11 depicts Granger causality of vertical velocity to the Hadley cell which we identify as OMEGA-HC.
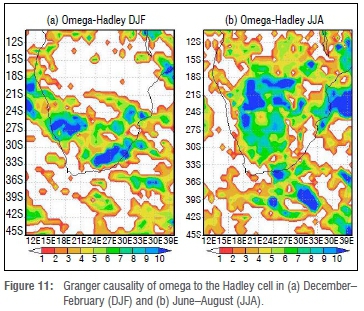
The OMEGA-HC causality is further southwards and weaker in DJF and further northwards and stronger in JJA, which may be linked with the northwards-southwards seasonal migration of the ITCZ. In DJF, OMEGA-HC causality is strong over the summer region of South Africa and stronger along the southeastern parts. In JJA, strong OMEGA-HC causality is located over the interior of South Africa where the subtropical high pressure cell is located. The southwestern parts of South Africa show an absence of OMEGA-HC causality for both DJF and JJA, which may be attributed to weather over the southwestern parts being Mediterranean in nature, and mostly owing to southerly frontal systems, rather than the Hadley cell.
Conclusions
We used Granger causality time series modelling to quantitatively diagnose the influence of the seasonal Hadley cell on cloud cover and vice versa. Bivariate vector autoregressive time series models for the period 1980 to 2015 were fitted to the seasonal Hadley cell and total cloud cover. According to the AIC and BIC statistics, the optimum lag used in the Hadley cell - cloud cover bivariate model was 2 days. The highest correlation coefficient of the lag correlations from averaged data was also 2 days. The lag correlations calculated from each grid point indicate lag lengths of 1-2 days for strongest correlation. The strength of these correlations is seasonally dependent and suggests linkage between the meridional shift of the Hadley cell and the seasonal migration of the ITCZ.10 The meridional shift of the Hadley cell is seasonal, but with intraseasonal variability as informed by the seasonal climatology of the mass stream function as well as from composite anomalies of the mass stream function during high and low cloudiness years. The lag correlation between the Hadley cell and cloud cover is stronger in DJF than in JJA. This difference may be due to synoptic systems (e.g tropical temperate troughs and westerly waves) leading to cloud formation, which dominate in DJF. Such systems have life spans of one to several days.37,38 It should also be noted that typically 2 days before the development of tropical temperate troughs over South Africa, there is a migration of easterly moisture from Botswana to the subtropical region of South Africa, which is an example of the strong 2-day lag correlation in DJF.38
We further established that the Hadley cell can Granger cause cloud cover for both DJF and JJA. This causality is associated mostly with limited cloud development. For example, causality is found over the interior of South Africa, where the subtropical high pressure cell dominates. In DJF, the western parts of South Africa experience limited cloud development, and this area is mostly where causality has been established. Weak causality from cloud cover to the Hadley cell has also been established. This case is typical of spurious causality in bivariate systems caused by the exclusion of a third variable in the Granger causality analysis. Further analysis has shown that vertical velocity is the main variable that could have led to the causality of cloud cover to the Hadley cell. Finally, although we have shown that Granger causality is a useful tool in establishing causality from the Hadley cell to cloud cover, to obtain the best outputs, the scientific background of the variables being analysed should be well understood before correct interpretations of the causality results can be made.
Formally establishing the causality of anomalously strong regional Hadley cell circulation in terms of limited cloud development over southern Africa is of profound importance within the context of future climate change over the region. Southern Africa has been assessed to be likely to become generally drier under low mitigation climate change futures.11,39-41 The underlying circulation changes in the model projections of climate change that led to this assessment have in fact been shown to include the frequent occurrence of mid-level anti-cyclones and subsidence11,39 over the region, which implies a strengthening of the descending branch of the Hadley cell. Increasingly limited cloud development over southern Africa in a warming world, in response to changes in the regional Hadley cell, may thus be an important factor driving the relatively high rate of observed and projected temperature increases over southern Africa.42 Increasing limited cloud development may further enhance southern Africa's solar potential within the context of a growing renewable energy sector, although such changes will be largely detrimental to agriculture and may further compromise water security in the region.
Acknowledgements
This work was financially supported by the National Research Foundation of South Africa (grant no. 102215). We are grateful to Mr Chang-Hyan Park for his valuable input prior to the submission of this manuscript and to the anonymous reviewers for their input in improving the manuscript.
Authors' contributions
D.D.M. conceptualised the study, analysed the data and wrote the paper. T.N., S.W.G. and F.A.E. conceptualised the study, and reviewed and approved the final manuscript.
References
1.South African Department of Energy (DoE). Integrated resource plan for electricity (IRP) 2010-2030. Updated report. Pretoria: DoE; 2013. [ Links ]
2.Loeb NG, Schuster GL. An observational study of the relationship between cloud, aerosol and meteorology in broken low-level cloud conditions. J Geophys Res. 2008;113(D14), D14214, 9 pages. https://doi.org/10.1029/2007JD009763 [ Links ]
3.Tyson PD, Preston-Whyte RA. The weather and climate of southern Africa. 2nd ed. Cape Town: Oxford University Press; 2000. [ Links ]
4.Engelbrecht CJ, Engelbrecht FA. Shifts in Köppen‐Geiger climate zones over southern Africa in relation to key global temperature goals. Theor Appl Climatol. 2016;123:247-261. https://doi.org/10.1007/s00704-014-1354-1 [ Links ]
5.Seidel DJ, Fu Q, Randel WJ, Reichler TJ. Widening of the tropical belt in a changing climate. Nat Geosci. 2008;1:21-24. https://doi.org/10.1038/ngeo.2007.38 [ Links ]
6.d'Abreton PC, Lindesay JA. Water vapour transport over southern Africa during wet and dry early and late summer months. Int J Climatol. 1993;13:151-170. https://doi.org/10.1002/joc.3370130203 [ Links ]
7.Tennant WJ, Reason CJC. Associations between the global energy cycle and regional rainfall in South Africa and southwest Australia. J Clim. 2005;18:3032-3047. https://doi.org/10.1175/JCLI3464.1 [ Links ]
8.Mahlobo DD, Ndarana T, Grab S, Engelbreht F. Integrated climatology and trends in the subtropical Hadley cell, sunshine duration and cloud cover over South Africa. Int J Climatol. 2018;39:1805-1821. https://doi.org/10.1002/joc.5917 [ Links ]
9.Manabe S, Holloway JL. The seasonal variation of the hydrological cycle as simulated by a global model of the atmosphere. J Geophys Res. 1975;80:1617-1649. https://doi.org/10.1029/JC080i012p01617 [ Links ]
10.Kang SM, Lu J. Expansion of the Hadley cell under global warming: Winter versus summer. J Clim. 2012;25:8387-8393. https://doi.org/10.1175/JCLI-D-12-00323.1 [ Links ]
11.Engelbrecht FA, McGregor JL, Engelbrecht CJ. Dynamics of the conformal-cubic atmospheric model projected climate-change signal over southern Africa. Int J Climatol. 2009;29:1013-1033. https://doi.org/10.1002/joc.1742 [ Links ]
12.Granger CWJ. Investigating causal relations by econometric models and cross spectral methods. Econometrica.1969;37:424-438. https://doi.org/10.2307/1912791 [ Links ]
13.Dee DP, Uppala SM, Simmo AJ, Berrisford P, Poli P, Kobayashi S, et al. The ERA-Interim reanalysis: Configuration and performance of the data assimilation system. Q J Royal Meteorol Soc. 2011;37:553-597. https://doi.org/10.1002/qj.828 [ Links ]
14.Schwendike J, Govekar P, Reeder MJ, Wardle R, Berry GJ, Jakob C. Local partitioning of the overturning circulation in the tropics and the connection to the Hadley and Walker circulations. J Geophys Res. 2014;119:1322-1339. https://doi.org/10.1002/2013JD020742. [ Links ]
15.Nguyen H, Evans A, Lucas C, Smith I, Timbal B. The Hadley circulation in reanalyses: Climatology, variability, and change. J Clim. 2013;26:3357-3376. https://doi.org/10.1175/JCLI-D-12-00224.1. [ Links ]
16.Nemani R, Keeling CD, Hashimoto H, Jolly WM, Piper SC, Tucker CJ, et al. Climate driven increases in global terrestrial net primary production from 1982 to 1999. Science. 2003;300:1560-1563. https://doi.org/10.1126/science.1082750 [ Links ]
17.Wu D, Zhao X, Liang S, Zhou T, Huang K, Tang B, et al. Time-lag effects of global vegetation responses to climate change. Glob Change Biol. 2015;21:3520-3531. https://doi.org/10.1111/gcb.12945 [ Links ]
18.Abramson B, Brown J, Edwards W, Murphy M, Winkler R. A Bayesian system for forecasting severe weather. Int J Forecast.1996;12:57-71. https://doi.org/10.1016/0169-2070(95)00664-8 [ Links ]
19.Cofino A, Cano R, Sordo C, Gutierrez JM. Bayesian networks for probabilistic weather prediction. In: Proceedings of the 15th European Conference on Artifical Intelligence. Amsterdam: IOS Press; 2002. p. 695-700. [ Links ]
20.Wang W, Anderson BT, Kaufmann RK, Myneni RB. The relation between the North Atlantic Oscillation and SSTs in the North Atlantic Basin. J Clim. 2004;17:4752-4759. https://doi.org/10.1175/JCLI-3186.1 [ Links ]
21.Elsner JB. Evidence in support of the climate change Atlantic hurricane hypothesis. Geophys Res Lett. 2006;33, L16705, 3 pages. https://doi.org/10.1029/2006GL026869 [ Links ]
22.Mosedale TJ, Stephenson DB, Collins M, Mills TC. Granger causality of coupled climate processes: Ocean feedback on the North Atlantic Oscillation. J Clim. 2006;19:1182-1194. https://doi.org/10.1175/JCLI3653.1 [ Links ]
23.Attanasio A, Pasini A, Triacca U. Granger causality analyses for climatic attribution. Atmos Clim Sci. 2013;3:515-522. https://doi.org/10.4236/acs.2013.34054 [ Links ]
24.Zou C, Feng J. Granger causality vs. dynamic bayesian network inference: A comparative study. BMC Bioinform. 2009;10, Art. #122, 17 pages. https://doi.org/10.1186/1471-2105-10-122 [ Links ]
25.Diks C, Mudelsee M. Redundancies in the earth's climatological time series. Phys Lett. 2000;275:407-414. https://doi.org/10.1016/S0375-9601(00)00613-7 [ Links ]
26.Papagiannopoulou C, Miralles DG, Decubber S, Demuzere M, Verhoest NEC, Dorigo WA, et al. A non-linear Granger-causality framework to investigate climate-vegetation dynamics. Geosci Model Dev. 2017;10:1945-1960. https://doi.org/10.5194/gmd-10-1945-2017 [ Links ]
27.Kaufmann RK, Stern DI. Evidence for human influence on climate from hemispheric temperature relations. Nature.1997;388:39-44. https://doi.org/10.1038/40332 [ Links ]
28.Geweke J. Measurement of linear dependence and feedback between multiple time series. J Am Stat Assoc.1982;77:304-313. https://doi.org/10.2307/2287238 [ Links ]
29.Barnett L, Seth AK. The MVGC multivariate Granger causality toolbox: A new approach to Granger-causal inference. J Neurosci Methods. 2014;223:50-68. https://doi.org/10.1016/j.jneumeth.2013.10.018 [ Links ]
30.Guo S, Seth AK, Kendrick KM, Zhoud C, Feng J. Partial Granger causality - eliminating exogenous inputs and latent variables. 2008;172:79-93. https://doi.org/10.1016/j.jneumeth.2008.04.011 [ Links ]
31.Sims CA, Stock JH, Watson MW. Inference in linear time series models with some unit roots. Econometrica.1990;58:113-144. https://doi.org/10.2307/2938337 [ Links ]
32.Triacca U. On the use of Granger causality to investigate the human influence on climate. Theor Appl Climatol. 2001;69:137-138. https://doi.org/10.1007/s007040170019 [ Links ]
33.Attanasio A, Pasini A, Triacca U. A contribution to attribution of recent global warming by out-of-sample Granger causality analysis. Atmos Sci Lett. 2012;13:67-72. https://doi.org/10.1002/asl.365 [ Links ]
34.Pasini A, Triacca U, Attanasio A. Evidence of recent causal decoupling between solar radiation and global temperature. Environ Res Lett. 2012;7, Art. #034020, 6 pages. https://doi.org/10.1088/1748-9326/7/3/034020 [ Links ]
35.He W. Model selection for cointegrated relationships in small sample [MSc dissertation]. Port Elizaberth: Nelson Mandela Metropolitan University; 2008. [ Links ]
36.Guo Y-Pe, LI J-Ping. Impact of ENSO events on the interannual variability of Hadley circulation extents in boreal winter. Adv Clim Change Res. 2016;7:46-53. https://doi.org/10.1016/j.accre.2016.05.001 [ Links ]
37.Hart NCG, Reason CJC, Fauchereau N. Tropical extratropical interactions over southern Africa: Three cases of heavy summer season rainfall. Mon Weather Rev. 2010;138:2608-2623. https://doi.org/10.1175/2010MWR3070.1 [ Links ]
38.Singleton AT, Reason CJC. Variability in the characteristics of cut-off low pressure systems over subtropical southern Africa. Int J Climatol. 2007;27:295-310. https://doi.org/10.1002/joc.1399 [ Links ]
39.Christensen JH, Hewitson B, Busuioc A, Chen A, Gao X, Held I, et al. Regional climate projections. In: Solomon S, Qin D, Manning M, Chen Z, Marquis M, Averyt KB, et al., editors. Climate change 2007: The physical science basis. Contribution of Working Group I to the Fourth Assessment Report of the Intergovernmental Panel on Climate Change. Cambridge: Cambridge University Press; 2007. [ Links ]
40.Niang I, Ruppel OC, Abdrabo MA, Essel A, Lennard C, Padgham J, et al. Africa. In: Barros VR, Field CB, Dokken DJ, Mastrandrea MD, Mach KJ, Bilir TE, et al., editors. Climate change 2014: Impacts, adaptation, and vulnerability. Part B: Regional aspects. Contribution of Working Group II to the Fifth Assessment Report of the Intergovernmental Panel on Climate Change. Cambridge: Cambridge University Press; 2014. [ Links ]
41.Hoegh-Guldberg O, Jacob D, Taylor M, Bindi M, Brown S, Camilloni I, et al. Chapter 3: Impacts of 1.5°C global warming on natural and human systems. In: Masson-Delmotte V, Zhai P, Pörtner H-O, Roberts D, Skea J, Shukla PR, et al., editors. Global warming of 1.5°C: An IPCC special report on the impacts of global warming of 1.5°C above pre-industrial levels and related global greenhouse gas emission pathways, in the context of strengthening the global response to the threat of climate change. Intergovernmental Panel on Climate Change; 2018. [ Links ]
42.Engelbrecht F, Adegoke J, Bopape M, Naidoo M, Garland R, Thatcher M, et al. Projections of rapidly rising surface temperatures over Africa under low mitigation. Environ Res Lett. 2015;10, Art. #085004, 16 pages. https://doi.org/10.1088/1748-9326/10/8/085004 [ Links ]
 Correspondence:
Dawn Mahlobo
ddmahlobo@gmail.com
Received: 31 Oct. 2018
Revised: 19 Feb. 2019
Accepted: 30 June 2019
Published: 26 Sep. 2019
EDITORS: Nicolas Beukes, Yali Woyessa
FUNDING: National Research Foundation (South Africa)
Supplementary Material
The supplementary file is available here: [Supplementary file]

