


Serviços Personalizados
Artigo
 Inglês (pdf)
 Artigo em XML
 Referências do artigo
Indicadores

Links relacionados
-
 Citado por Google
 -
 Similares em Google
Compartilhar

 Permalink
South African Journal of Science
versão On-line ISSN 1996-7489
versão impressa ISSN 0038-2353
S. Afr. j. sci. vol.115 no.7-8 Pretoria Jul./Ago. 2019
http://dx.doi.org/10.17159/sajs.2019/5768
RESEARCH LETTER
Estimation of radon potential through measurement of uranium concentrations in granite geology
Jacques Bezuidenhout
Faculty of Military Science, Stellenbosch University, Stellenbosch, South Africa
ABSTRACT
The geology of an area can be used as a predictor for radon potential. Granite rock typically contains a high concentration of uranium and subsequent elevated emanation of radon gas. The geology of the western part of the Western Cape Province in South Africa is dominated by granite bedrock but very few studies on radon have been conducted in this area. Uranium concentrations were consequently measured on a large granite hill in the Saldanha Bay area of the Western Cape and a relationship between indoor radon and uranium concentrations was used to model radon potential on the outcrop. Results from granite rich environments in India were modelled in order to extract a relationship between indoor radon concentrations, radon exhalation rates and uranium concentrations. Radon exhalation rates greater than 0.35 Bq/m2h were predicted and estimated indoor radon concentrations in excess of 400 Bq/m3 were also predicted for the hill. The modelled results were compared with indoor radon measurements taken in the town of Paarl in the Western Cape, which sits on the same granite bedrock formation. The predicted radon potential correlated well with the physical measurements.
SIGNIFICANCE:
•Extensive in-situ uranium measurements were conducted by utilising a self-developed gamma-ray detection instrument (the GISPI) by means of a unique method.
Keywords: soil uranium; indoor radon concentrations; in-situ measurements; radon exhalation rate; radon potential map; Cape Granite Suite
Introduction
The dominant naturally occurring nuclides are uranium (238U), thorium (232Th) and potassium (40K). These nuclides are all of primordial origin. Uranium and thorium decay through long chains of progeny before reaching stable nuclides. Radium (226Ra) is a long-lived daughter in the progeny of uranium and is followed by radon (222Rn). Radon has a half-life of 3.82 days and occurs as a gas at atmospheric conditions. Radon readily escapes the parent material and distributes fairly easy. Radon gas has been identified as the dominant contributor to human exposure to radiation; the World Health Organization has reported that radon is the second largest carcinogen in lung cancer, second only to cigarette smoke.1 According to the International Commission for Radiological Protection and the International Atomic Energy Agency, concentrations of radon in dwellings are recommended to be below 300 Bq/m3.
Granite typically contains high concentrations of naturally occurring nuclides. The elevated concentrations of uranium in granite subsequently contribute to high concentrations of radon. Because of these high radon concentrations, people living in granite rich environments would also be exposed to higher concentrations of radon. Risk assessment studies based on radon potential in such areas are essential.2 The geology of the western part of the Western Cape Province of South Africa is dominated by the so-called Cape Granite Suite. The western terrane of the Cape Granite Suite stretches from Saldanha Bay in the northwest through the town of Paarl to Franschhoek in the southeast.3 Several other towns and villages have also developed amongst the exposed granite outcrops of this terrane. Research has further established that the upper layers of soil in the alluvial fans at some of these granite outcrops mainly consist of weathered granite rock.4 The emanation of radon in the greater part of this area has never been investigated. The aim of this study was therefore to model, estimate and compare radon potential in the western part of the Western Cape in order to determine the possible exposure and risk to the local population in towns in the area.
Method
Study area and measurements
A large granite outcrop named Baviaansberg was selected as the study area. Baviaansberg was selected as it is relatively undisturbed by human activities and lies on the same granite complex as the town of Paarl, making comparison possible. The study area was firstly demarcated into measurement squares over a 1:50 000 map of the area. The centre of each square in the grid was predetermined with a fishnet grid function of ArcMap software. The size of each square within the grid was 48.6 m (latitudinal) and 47.6 m (longitudinal). These centres were used as measuring positions but they were shifted within the square if the position was obscured by rocks. A measuring time of 5 min was allocated for the Global Positioning System (GPS) position acquisition and gamma-ray detection. These two measurements were made concurrently within the 5-min period, which was adequate time to acquire data for both measurements. All the measurements were taken during the dry summer months to prevent any effect of moisture on gamma radiation.5
Equipment
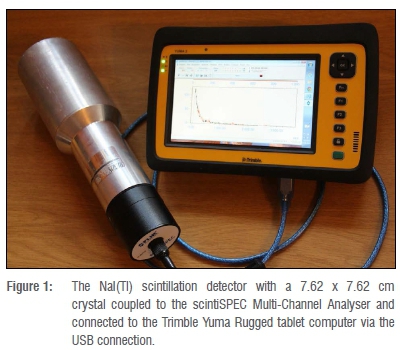
The system used for in-situ measurements was similar to that used previously.4 A 7.62 cm x 7.62 cm sodium iodide (NaI(Tl)) scintillation crystal was coupled to a scintiSPEC Multi-Channel Analyser (MCA) that was manufactured by FLIR®.6 The scintiSPEC MCA was connected to a Trimble Yuma Rugged tablet computer7 via a USB cable. The Yuma was equipped with an on-board GPS that provided position in the field. The scintiSPEC MCA was operated by means of winTMCA32 software with 1024 energy channels, also developed by FLIR®. The detection set-up is displayed in Figure 1. The radiation data were stored in energy spectra and the accompanying GPS positions were also noted.
Calibration and analyses
Regular energy calibrations were performed on the system using 137Cs, 60Co and the known naturally occurring radionuclides. The instrument was also monitored for energy drift, which could occur due to variations in the ambient temperature. Efficiency calibration spectra were acquired at calibration pads of the Nuclear Energy Corporation of South Africa.8 The calibration pads consist of three solid concrete cylinders, uniformly mixed with potassium (40K), uranium (238U) and thorium (232Th), respectively. The measuring equipment was used to obtain standard spectra at the pads for each of the three nuclides. These spectra were then fitted to the in-situ spectra and a full spectrum analysis method (described by Hendriks et al.9 and Geyser10) was followed in order to extract the natural occurring nuclide concentrations. A uranium concentration map was then constructed from the data. The statistical uncertainty was determined by applying the Poisson statistical distribution to the data. The average statistical uncertainty was estimated at 23.9%.
Construction of a radon potential map
Radon potential in the study area was estimated by linking the indoor radon concentrations to the measured uranium concentrations in the soil on Baviaansberg. Smethurst et al.11 noted that the relationship between indoor radon and uranium concentrations depends on the characteristic of the geographical locations. The Tusham Ring Complex and the Himachal Pradesh region of India were consequently selected to determine these relationships because of the geographical similarity of these regions to the study area.
The relation between the indoor radon concentration and the radon exhalation rate (EA) was extracted by using measured data from the Himachal Pradesh region of India12 (Figure 2).

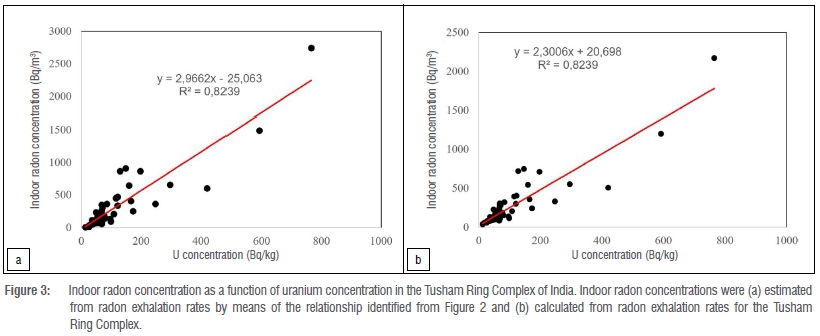
This relationship was then applied to radon exhalation rates of the Tusham Ring Complex13 and the indoor radon concentrations were estimated for the Complex. The estimated indoor radon concentrations were plotted against measured uranium concentrations in the granitic soil and rock of the Tusham Ring Complex and a relationship between these parameters was extracted (Figure 3a). The uranium concentrations in this study were determined by applying the fission track registration technique to soil samples.14
The extracted relationships between indoor radon concentrations and uranium concentrations from the Himachal Pradesh and Tusham Ring Complex were compared with radon build-up calculations that were done on the radon exhalation rates of the Tusham Ring Complex. The radon exhalation rate and the uranium concentrations of rock and soil were measured in the Tusham Ring Complex by Singh et al.13 The radon exhalation rates and the uranium concentrations of soil samples were determined using the can15 and fission track registration techniques, respectively. These measured radon exhalation rates were used to estimate indoor radon concentrations through the same method that was applied by Al-Jarallah16. A cuboid volume (3 m x 3 m x 2 m) was used as standard for the estimation. The estimated indoor radon concentrations were then plotted as a function of the uranium concentrations and a linear relationship was extracted (Figure 3b). This relationship compared reasonably well with the one that was extracted from the Himachal Pradesh measurements.
The result that was extracted from the calculations with the standard volume compared well with the result from the empirical data. The initial relationship that was extracted from the empirical data was therefore used to relate the indoor radon concentrations and the uranium concentrations of the study area. This relationship was employed to estimate indoor radon potential, similarly to the method used by Smethurst et al.11 The uranium concentrations and indoor radon potentials were interpolated and mapped using ArcGIS and QGIS software. The results for the study area were compared to indoor radon measurements taken in Paarl.
Results and discussion
The topography of Baviaansberg is overlaid on a Google Earth image in Figure 4. It is evident that the steeper slopes are mainly confined to the southern side of the hill, most likely as a result of the dominant southerly onshore winds of the region. These steeper slopes are also characterised by exposed granite outcrops which are observable as white spots on the Google Earth image. Smaller granite outcrops are also visible on the northern, less steep slopes on the hill.
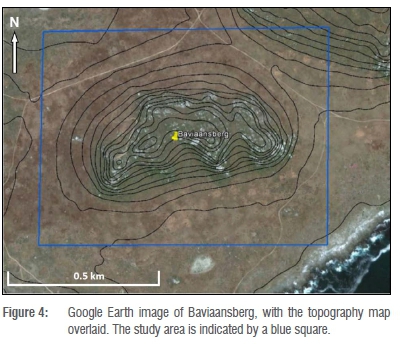
Figure 5 shows an overlay of interpolated uranium concentrations on a topographic map. The interpolation between the measured points was done by means of kriging. High concentrations of uranium are mainly confined to the steeper slopes, but some elevated concentrations also occur on the nearby flatter areas.

The estimated radon concentrations were interpolated by means of a heat map and overlaid on a Google Earth image of Baviaansberg (Figure 6). High radon potential coincided mainly with the steepest slopes of the hill, when compared to the topographic overlay. This high radon potential also corresponds to the areas within the vicinity of exposed granite outcrops. The dark red areas in Figure 5 are areas where the radon exhalation rate is estimated to be higher than 0.35 Bq/m2h. If there were buildings in these areas and they were occupied similarly to those in Himachal Pradesh and Tusham in India, it is estimated that the indoor radon might exceed 400 Bq/m3.

The areas of high radon potential, however, also consistently extend beyond the granite outcrops into the less steep foot of the hill. The summit of Baviaansberg and the surrounding area demonstrate no elevated radon potential. It has been previously4 shown that some slopes of the hills in the area consist of granitic soils, most probably due to weathering of the parent rock and subsequent aeolian and alluvial disposition in its proximity. This geology would explain the high estimated radon potential below the granite outcrop in the study area. The radon potential was directly related to the uranium concentrations, irrespective of soil type. It should, however, be noted that finer grained soil would more readily support radon escape because of its larger exposed active areas.
Granite outcrops found in Paarl are similar to those found in the study area and the granite in Paarl and Baviaansberg originates from the same geological unit.17 Results of the measurements that were performed in the granite rich areas of Paarl are given in Table 1.2 These results show that in about 6% of the houses in Paarl, indoor radon concentrations exceed 300 Bq/m3. This finding correlates well with the estimated radon potential on Baviaansberg, which predicted that 5.7% of the points would exceed 300 Bq/m3. It is therefore reasonable to conclude that similar levels of radon potential would occur in other towns in the area and that a possible radon hazard does exist. This conclusion, however, needs to be confirmed with more indoor radon measurements, which are planned for various towns in the region. The method that is described in this study for the estimation of radon potential can be used elsewhere to rapidly and remotely identify areas subjected to possible radon hazards.

References
1.Pavia M, Bianco A, Pileggi C, Angelillo F. Meta-analysis of residential exposure to radon gas and lung cancer. Bull World Health Organ. 2003;81(10):732-738. [ Links ]
2.Lindsay R, Newman RT, Speelman WJ. A study of airborne radon levels in Paarl houses (South Africa) and associated source terms, using electret ion chambers and gamma-ray spectrometry. Appl Radiat Isot. 2008;66(11):1611-1614. https://doi.org/10.1016/j.apradiso.2008.01.022 [ Links ]
3.Scheepers R, Armstrong RA. New U-Pb SHRIMP zircon ages of the Cape Granite Suite: Implications for the magmatic evolution of the Saldania Belt. S Afr J Geol. 2002;105:241-256. https://doi.org/10.2113/1050241 [ Links ]
4.Bezuidenhout J. Mapping of historical human activities in the Saldanha Bay Military Area by using in situ gamma ray measurements. Scientia Militaria. 2012;40(2):89-101. https://doi.org/10.5787/40-2-998 [ Links ]
5.Jones WK, Carroll TR. Error analysis of airborne gamma radiation soil moisture measurements. Agric Meteorol. 1983;28:19-30. https://doi.org/10.1016/0002-1571(83)90020-1 [ Links ]
6.FLIR Systems Inc. [webpage on the Internet]. Nashua, NH: FLIR Systems [updated 2018; cited 2018 Sep 06]. Available from: http://www.flir.com/ [ Links ]
7.Trimble Inc. [webpage on the Internet]. Sunnyvale, CA: Trimble Inc. [updated 2018; cited 2018 Sep 06]. Available from: http://www.trimble.com [ Links ]
8.Corner B, Toens PD, Richards DJ, Van As D, Vleggaar CM. The Pelindaba facilities for calibrating radiometric field instruments. No. PEL-268. Pretoria: Atomic Energy Board; 1979. [ Links ]
9.Hendriks PH, Limburg J, De Meijer RJ. Full-spectrum analysis of natural gamma-ray spectra. J Environ Radioact. 2001;53(3):365-380. https://doi.org/10.1016/S0265-931X(00)00142-9 [ Links ]
10.Geyser AP. The influence of geographical factor on the distribution of natural radionuclides [MMil thesis]. Stellenbosch: Stellenbosch University; 2017. [ Links ]
11.Smethurst MA, Watson RJ, Baranwal VC, Rudjord AL, Finne I. The predictive power of airborne gamma-ray survey data on the locations of domestic radon hazards in Norway: A strong case for utilizing airborne data in large-scale radon potential mapping. J Environ Radioact. 2017;166:321-340. https://doi.org/10.1016/j.jenvrad.2016.04.006 [ Links ]
12.Singh S, Kumar A, Singh B. Radon level in dwellings and its correlation with uranium and radium content in some areas of Himachal Pradesh, India. Environ Int. 2002;28:97-101. https://doi.org/10.1016/S0160-4120(02)00012-0 [ Links ]
13.Singh H, Singh J, Singh S, Bajwa BS. Radon exhalation rate and uranium estimation study of some soil and rock samples from Tusham ring complex, India using SSNTD technique. Radiat Meas. 2008;43:459-462. https://doi.org/10.1016/j.radmeas.2008.04.060 [ Links ]
14.Fleischer RL, Price PB, Walker RM. Nuclear tracks in solids: Principles and applications. Berkeley, CA: University of California Press; 1975. p. 489-495. [ Links ]
15.Khan AJ, Prasad R, Tyagi RK. Measurement of radon exhalation rate from some building materials. Nuclear Tracks Radiat Meas. 1992;20:609-610. https://doi.org/10.1016/1359-0189(92)90013-L [ Links ]
16.Al-Jarallah M. Radon exhalation from granites used in Saudi Arabia. J Environ Radioact. 2001;53:91-98. https://doi.org/10.1016/S0265-931X(00)00110-7 [ Links ]
17.Clemens JD, Stevens G. The Saldanha Bay Volcanic Complex: Clarifying the Cambrian geology of the Postberg - Saldanha Area, West Coast, South Africa. S Afr J Geol. 2016;119(2):347-358. https://doi.org/10.2113/gssajg.119.2.347 [ Links ]
 Correspondence:
Jacques Bezuidenhout
Email: jab@ma2.sun.ac.za
Received: 12 Nov. 2018
Revised: 13 Mar. 2019
Accepted: 13 Mar. 2019
Published: 30 July 2019
EDITORS: Nicolas Beukes, Yali Woyessa
FUNDING: None

