


Serviços Personalizados
Artigo
 Inglês (pdf)
 Artigo em XML
 Referências do artigo
Indicadores

Links relacionados
-
 Citado por Google
 -
 Similares em Google
Compartilhar

 Permalink
South African Journal of Science
versão On-line ISSN 1996-7489
versão impressa ISSN 0038-2353
S. Afr. j. sci. vol.115 no.7-8 Pretoria Jul./Ago. 2019
http://dx.doi.org/10.17159/sajs.2019/4901
RESEARCH ARTICLES
Corrosion map of South Africa's macro atmosphere
Darelle T. Janse van RensburgI, II; Lesley A. CornishI; Josias van der MerweI
ISchool of Chemical and Metallurgical Engineering and DST-NRF Centre of Excellence in Strong Materials, University of the Witwatersrand, Johannesburg, South Africa
IIOrytech (Pty) Ltd, Roodepoort, South Africa
ABSTRACT
The first atmospheric corrosion map of South Africa, produced by Callaghan in 1991, has become outdated, because it primarily focuses on the corrosivity of coastal environments, with little differentiation given concerning South Africa's inland locations. To address this problem, a study was undertaken to develop a new corrosion map of the country, with the emphasis placed on providing greater detail concerning South Africa's inland regions. Here we present this new corrosion map of South Africa's macro atmosphere, based on 12-month corrosion rates of mild steel at more than 100 sites throughout the country. Assimilations and statistical analyses of the data (published, unpublished and new) show that the variability in the corrosion rate of mild steel decreases significantly moving inland. Accordingly, the average first-year corrosion rate of mild steel at the inland sites (at all corrosion monitoring spots located more than 30 km away from the ocean) measured 21±12 µm/a [95% CI: 18-23 µm/a]. The minimum inland figure was about 1.3 µm/a (recorded at Droërivier in the Central Karoo) and the maxima were approximately 51 µm/a and 50 µm/a in the industrial hearts of Germiston (Gauteng) and Sasolburg (Free State), respectively. The variability in the corrosion rate of mild steel also decreased by as much as 80% between 150 m and 1000 m from the coastline. Moreover, the impact of changing altitude on the corrosivity of the environment was confirmed, particularly along the coastal regions.
SIGNIFICANCE:
•A new corrosion map of South Africa's inland and coastal regions is presented.
•The map facilitates the identification of South Africa's least to most corrosive environments; enabling the selection of more appropriate corrosion protection solutions for general, business, mining and industrial installations.
•In identifying South Africa's least corrosive areas, the use of more environmentally friendly corrosion protection procedures is potentially encouraged.
Keywords: atmospheric; inland; coastal; mild steel
Introduction
The first atmospheric corrosion map of South Africa was published 28 years ago.1 This map (Figure 1), referred to as the Callaghan map, was developed based on the atmospheric corrosion monitoring results of studies conducted during the 1970s to 1990s, at 11 sites, of which 60% were situated along the South African and Namibian coastlines.
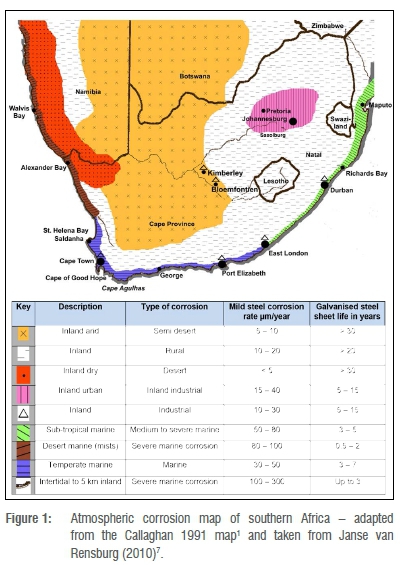
Since its publication in 1991, the Callaghan map has undergone only minor adaptations.2-7 However, due to the lack of differentiation of inland locations, overstatement of the corrosivity of environments, changes in international standards regarding the measurement of corrosive atmospheres, increased industrialisation of South Africa's large metropolitan areas, global climate change effects, and improved mapping techniques,8 this chart has become outdated.
Background
Corrosion maps are useful tools in many scientific and engineering fields, e.g. in research, design, construction, maintenance, and operations, as well as from a public perspective. Corrosion maps are also advantageous in the sense that they provide potential means to assess the effects of pollution9 and climate change10,11 on communities, materials and the environment.
According to The Worldwide Corrosion Authority (NACE)12, the cost of corrosion in 2016 was estimated to be USD2.5 trillion (about 3.4% of the global GDP). This average is based on the results of corrosion cost studies conducted by the USA, India, Japan, Kuwait and United Kingdom. It is reported that about 15-35% of this cost can be saved by using effective preventative measures. A similar study was also conducted in South Africa in 1986.13 During the South African study - which covered the mining, power generation, shipping and transportation sectors - corrosion protection preventative measures, metal losses and replacement costs were estimated at ZAR1 250 million/annum or USD625 million/annum.13 This number was based on an exchange rate of approximately USD1:ZAR2 at the time14, which amounted to about 5% of South Africa's GDP.
In line with The World Bank's15 2017 numbers, South Africa's GDP was given as USD348.9 billion (approximately ZAR4 885 billion). By applying NACE's 2016 figure of 3.4% of the global GDP as the cost of corrosion per annum, this means that, currently, about ZAR166 billion is spent annually in South Africa in trying to combat or prevent corrosion problems. Of this amount, atmospheric corrosion of coated and uncoated metal surfaces is viewed as a significant contributor - more than 50% or ZAR83 billion.11,16,17 Undoubtedly, the usefulness of corrosion maps to prevent or manage corrosion problems is immense.
Historical overview of South Africa's atmospheric corrosion data
Pre-1970, several small atmospheric corrosion monitoring studies were carried out in South Africa. The Council for Scientific and Industrial Research (CSIR)18 and Callaghan1 provided comprehensive overviews of these very early exposure programmes. Post-1970 to the early 1990s, the first national exposure programme was conducted.1 The initial work involved two 4-year exposure programmes, of which one included the exposure of a range of metals and alloys18, while the other involved metallic coatings on steel substrates at several sites throughout South Africa.1 However, because of shortcomings identified with these very early exposure studies, a 20-year exposure programme was initiated. This work was conducted at sites in Cape Town, Port Elizabeth, Strandfontein, Pretoria, Sasolburg, False Bay, Durban, Simonstown and East London in South Africa, and in Gobabeb and Walvis Bay in Namibia, which culminated in the publication of the first corrosion map of southern Africa (Figure 1).1
From 1990 to 1993, Eskom Holdings SOC Limited, the leading electricity producer in South Africa, henceforth referred to as 'Eskom', conducted atmospheric corrosion research work along the eastern, southern and western Cape coastlines.19 Their study involved exposure to the corrosive marine atmosphere of wire-on-bolt (CLIMAT) units, currently manufactured according to ASTM G116:199920 procedures.
Simultaneously, Eskom launched a 5-year corrosion study relating to the atmospheric corrosivity of sites in other areas along the South African coastline, as well as in the southern and eastern Highveld regions. This work, done by Nixon and Janse van Rensburg21-23, Colloby24 and Northcott25, entailed the exposure of mild steel, copper, aluminium, zinc, galvanised mild steel, stainless steel and 3CR12 panels to different corrosive atmospheres. Changes in the electrical resistance of iron, zinc, copper and aluminium were also investigated.24 The studies were performed at locations near Melkbosstrand, Klienzee, Richards Bay, Kriel, Sasolburg, Elandsfontein, Bethal (Palmer), Volksrust and Vanderbijlpark.
During 1991 to 1994, a 3-year project was launched by the CSIR in the Eastern parts of the Gauteng Highveld region. This study was performed in conjunction with Eskom at sites located at Pretoria, Grootpan (close to Ogies), Elandsfontein and Verkykkop (in Volksrust).21-23,26 The purpose of the CSIR research work, done by Gnoinski and Ramothlola, was mainly to determine the effectiveness of a rapid method for the assessment of atmospheric corrosion.26
Numerous atmospheric corrosion tests were also carried out by John E. Leitch, over a period of more than 20 years.4 His work was done mainly on behalf of Hulett Aluminium (Pty) Ltd, the CSIR, Eskom, and other interested parties. During earlier years, Leitch's studies primarily involved the exposure of wire-on-bolt units to different corrosive atmospheres - to classify the atmospheres of sites using the CLIMAT (CLassify Industrial and Marine ATmospheres) method.27 However, with the inception of a new technique for the corrosion monitoring of atmospheric environments in 1992, for which the methodology is described in detail in ISO 9223:199228 and ISO 9226:199229, most of Leitch's work in his later years was effected in accordance with the open wire helix (zinc and aluminium) method3,5. Leitch's studies culminated in the publication of an updated corrosion map of South Africa in 19993, and again in 20034, with the latter chart subsequently incorporated into SANS 1796:201330.
The new maps were hailed in the sense that they represented the first attempts by a South African researcher to classify the corrosivity of atmospheric environments based on the ISO 9223 and ISO 9226 procedures.27,28 Leitch employed the ISO 9226:1992 open zinc and aluminium wire helix technique at places such as Cape Town, Mossel Bay, Port Elizabeth, Durban, Umhlanga Rocks and Richards Bay.4
In 2005, the Hot Dip Galvanizers Association of Southern Africa (HDGASA)6 also published an updated atmospheric corrosion map for zinc (after the Callaghan map) based on the ISO 9223:1992 classification system. Additional work worth mentioning is that of Vosloo of Eskom, in partnership with Pietersen and Holtzhausen of the Stellenbosch University.31 Their studies involved the development of an insulator pollution severity application map for South Africa, which added to the knowledge base relating to atmospheric pollution in South Africa. Calitz and Potgieter32 also conducted atmospheric corrosion studies of overhead power transmission conductors at a marine site near Koeberg Nuclear Power Station, situated along the Western Cape coastline.
The SAIAE (South African Institute of Agricultural Engineers) likewise launched an 11-year atmospheric exposure programme on five diverse agricultural wire types at seven sites in South Africa.33 Findings of this work, dating back to December 1990, are currently still used to provide recommendations regarding suitable fencing materials for different corrosive environments. Materials tested included light galvanised, heavy galvanised, aluminium coated, Galfan and 3CR12 wires, which were exposed at Bathurst and Riviersonderend. Work in this field was also conducted by R.J. Bronkhorst and K.L. Rodseth.33
Between 2005 and 2010, Janse van Rensburg34 initiated one of the most extensive atmospheric corrosion programmes in South Africa. This study, performed on behalf of Eskom, involved the atmospheric corrosion monitoring of 50 sites throughout South Africa - covering both inland and coastal regions. Janse van Rensburg also conducted smaller studies at other locations in the country. Moreover, during 2013 to 2017, a further study was undertaken that focused on the development of a new corrosion map for South Africa,8 also providing greater detail concerning the atmospheric corrosivity of South Africa's inland industrial areas. This new South Africa atmospheric corrosion map, based on assimilations and statistical analyses of the historical published, unpublished and new 12-month corrosion rates of mild (carbon) steel, as measured at different sites throughout South Africa, is presented in this paper.
General methodology of historical and new corrosion monitoring studies
In general, corrosion monitoring sites were established throughout South Africa, covering industrial, marine, desert, urban and rural environments. The methodology followed mainly involved the exposure of mild steel (low carbon steel) coupons to the different environments over a period of 12 months, after which weight-loss measurements of the metal coupons were conducted. This was after chemical cleaning of the metallic test coupons by conventional procedures, like ISO 9226,29,35 followed by drying and reweighing of the test specimens. Subsequently, the 12-month corrosion rate of each mild steel coupon was calculated as per Equation 1.29,35
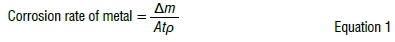
where: ∆ m is the mass loss in grams (g); A is the exposed surface area in m2; t is the exposure time per annum; and ρ is the density of the metal (g/cm3). The corrosion rate (rcorr) is in µm/a, and the density of the steel was taken as 7.86 g/cm3.29,35
The corrosivity of the atmosphere was classified successively based on the 12-month corrosion rate of mild steel as per the ISO 9223:2012 rating scheme: C1 - very low (≤1.3 µm/a), C2 - low (≤25 µm/a), C3 - moderate (≤50 µm/a), C4 - high (≤80 µm/a), C5 - very high (≤200 µm/a) and CX - extreme (≤700 µm/a) corrosive.36 The corrosion data were then processed into an atmospheric corrosion map of South Africa using Esri ArcGIS 10.2, which is a geographical information system (GIS) developing software programme. It is noteworthy that because of the sensitive nature of some of the sites, not all the site names or detailed corrosion data are given. Consequently, the results are presented as an interpolated corrosivity map, for which legends are provided.
Regarding the latest corrosivity map, the interpolated vector data are projected over physical and annual rainfall maps for South Africa, as supplied by Esri ArcGIS and the South African Weather Service. Furthermore, select conventional map symbols are included to facilitate ease of interpretation and widespread use of this map.
Results and discussion
The new atmospheric corrosion map for South Africa is presented in Figure 2,8 while the linked meteorological and corrosion data for some of the sites are given in Table 1.
Assimilations, statistical analyses and interpolations of the 12-month corrosion rates of mild steel for South Africa and the Highveld region, based on the historical published, unpublished and new data, revealed that the average first-year corrosion rate of mild steel at the inland sites (at all corrosion monitoring spots located more than 30 km away from the ocean) was about 21±12 µm/a [95% CI: 18-23 µm/a]. The minimum inland measurement was about 1.3 µm/a and was recorded at Droërivier in the Central Karoo, a hot semi-arid environment (Table 1 and Figure 3). The maxima, of approximately 51 µm/a and 50 µm/a were recorded in Germiston (Gauteng) and Sasolburg (Free State), respectively,7 both located in South Africa's heavy industrialised Highveld and Vaal Triangle areas, with average rainfall of approximately 550-600 mm/a.37 It is significant that these corrosion rates are outside the 5-40 µm/a range given in the Callaghan map for inland (arid, rural, urban and industrial combined) environments.1

Based on the assimilated results, the inland sites vary from low to potentially highly corrosive, corresponding with the lowest limits given in the ISO 9223 standard for C2 and C4 corrosive environments, namely 1.3 µm/a and 50 µm/a, respectively.36 This finding suggests that in the desert and semi-arid (non-industrial) inland areas, with average low rainfall (≤400 mm/a),37 the corrosivity of the environment is better rated very low (C1) to low (C2) corrosive. Conversely, in inland areas with an average rainfall of more than 400 mm/a,37 the atmosphere is best ranked low (C2) to moderate (C3) corrosive, with a potential for high (C4) corrosive 'hotspots', in and around heavy-industrial locations.
Concerning the coastal regions of South Africa, the average first-year corrosion rate of mild steel exposed within the first 150 m from the high-water mark, was 319±112 µm/a [95% CI: 215-422 µm/a]. The minimum value was about 134 µm/a (recorded at Salisbury Island in Durban)1 and the maximum near 460 µm/a (measured close to Melkbosstrand in the Western Cape)7. This finding was despite the fact that the former site exhibits higher rainfall than the latter locale (Table 1), and was attributed to the increased surf action near Melkbosstrand compared to the calmer sea and landscaped terrain of the Salisbury Island area.7 These findings concur with ISO 9223:2012 relating to the factors affecting the deposition rate of chlorides along coastlines.36 The data further suggest that the atmosphere within the first 150 m from the shoreline can be rated as extremely (CX) corrosive, as per ISO 9223.36 However, as shown by the high standard deviation, the variation in the corrosivity of the atmosphere along the coastline is substantial and depends on the surf action of the ocean, the altitude, topography, temperature and onshore wind flow (i.e. speed and direction).1,7
Regarding those sites which are located within 150-1000 m from the shoreline, the average first-year (12-month) corrosion rate of mild steel was 60±22 µm/a [95% CI: 45-75 µm/a]. The lowest value was about 40 µm/a (at Oyster Bay in the Eastern Cape) and the highest was approximately 122 µm/a (at Congella in Durban)1, which is expected as Oyster Bay exhibits lower rainfall and midday temperatures than Durban (Table 1)37. The above range is significantly lower than the 100-300 µm/a span given in the Callaghan map for the intertidal to 5-km zone along South Africa's coastline. It is also far less than the C5 (200-300 µm/a) classification given in the HDGASA map.6 Evidently, the 150-1000 m zone along South Africa's coastline is best classified mid-C4 (high) to mid-C5 (very high) corrosive.
Of note is the near 80% reduction in variability in the corrosion rate of mild steel for the 150-1000 m zone along the coastline, compared to that of the first 150 m from the ocean, with a change in the standard deviation from 112 µm/a to 22 µm/a (Figure 2). This decrease suggests that the effects of airborne salts, altitude, topography and onshore wind flow on the atmospheric corrosivity of the environment lessen when moving inland. Janse van Rensburg8 made a comprehensive study in this regard. Doyle and Godard18,27 also reported an 80-85% decrease in the corrosivity of the environment within the first 800 m from the ocean in Durban and Port Elizabeth. Similarly, O'Donnell et al.33 found a 'rapid' change in the corrosivity of marine atmospheres, mainly from 1 km onwards.
The sharp decrease in the corrosivity of the environment within the 150-1000 m zone is likely attributable to the gravitational settling, turbulence diffusion and momentum-dominated impact of the airborne salts38 within the first 150 m from the sea, causing lower levels of salts (chlorides) to be deposited onto surfaces in the following 150-1000 m span. Denser and more abundant vegetation next to the coast, as encountered along the eastern coastline39, further encourages the deposition of aerosols within a shorter distance from the ocean40. This dramatic change in the deposition rate of salts in marine environments, particularly within 1 km from the ocean, has also been demonstrated during other corrosion studies.41
At 1-3 km from the ocean, the average first-year corrosion rate of mild steel decreases further to about 43±14 µm/a [95% CI: 28-58 µm/a], suggesting significant stabilisation of the corrosivity of the environment with increasing distance from the ocean. The minimum recorded value was approximately 28 µm/a (at Ysterplaat in Cape Town)1 and the maximum about 66 µm/a (at the Durban Bayhead)1. Of significance is that the former locale is situated to the west of Cape Town, and is separated from the ocean by numerous houses, industrial plants and office buildings. Conversely, the Durban Bayhead site is not only located in a high rainfall, sub-tropical region (Table 1 and Figure 3), but is also nearly encircled by the Durban Harbour, causing a further spike in the local relative humidity levels, while the open sea is positioned close by to the eastern side, resulting in an increase in airborne salt concentrations.
Regarding mild steel corrosion, the 1-3 km zone along the South African coastline is best classified as moderate (C3) corrosive, which is significantly overstated in the older maps. Concerning Callaghan's map1 (Figure 1), the corrosion rate of mild steel in the 'Intertidal to 5 km inland mark', is given as 100-300 µm/a, whereas in the case of the HDGASA map6, the 'Exterior: industrial with high humidity or high salinity coastal' region is given as varying between 80 µm/a and 200 µm/a.
The average first-year corrosion rate of mild steel at all sites located within 3-10 km from the coastline, measured 37±13 µm/a [95% CI: 27-47 µm/a]. The lowest was about 20 µm/a at Grabouw in the Western Cape (above Sir Lowry's Pass near Gordons Bay)7 and the highest was approximately 57 µm/a at Petro SA's Mossgas plant near Mossel Bay7. This finding is irrespective of the fact that Grabouw is located in a higher rainfall region than Mossel Bay (Table 1) - the lower corrosivity of the former site being attrbuted to its elevation of approximately 265 m above sea level,42 whereas the latter exposure site is located at a much lower altitude, thus being more exposed to the salt-laden winds from the ocean. Hernandez et al.43 and Del Angel et al.44 similarly found that altitude plays a significant role in marine corrosion. The overall results also suggest a decrease in the average corrosivity of the atmosphere by approximately 6 µm/a (from about 43 µm/a to 37 µm/a), between the 3 km and 10 km marks, with an additional ~1% stabilisation of the corrosivity of the atmosphere. Typically, this zone may be classified as moderate (C3) corrosive.
Regarding the 10-30 km region, the average first-year corrosion rate of mild steel measured 35±14 µm/a [95% CI: 22-48 µm/a], suggesting a further ~1% decrease in the average corrosivity of the atmosphere. Correspondingly, this zone along South Africa's coastline is best classified as moderate (C3) corrosive. The minimum recorded value was approximately 16 µm/a at Vredendal in the Western Cape7 and the highest was about 58 µm/a at a site in Empangeni (KwaZulu-Natal)7. Noteworthy is the significant difference in the corrosivity of these two sites, which can be ascribed to their unique meteorological conditions (Table 1 and Figure 3), with Vredendal in a hot semi-desert environment and Empangeni in a high-rainfall, sub-tropical region.
The apparent slowdown of further stabilisation of the corrosivity of the environment is of note, and implies that, from approximately 30 km onwards, windborne marine salts are no longer the dominant force driving the atmospheric corrosion process. This demarcation line was also identified by Callaghan in 1991.1 However, the coefficient of variation of the average corrosion rate of mild steel remained high at nearly 40%. Congruently, studies in other countries showed that sea salts may still affect atmospheric corrosion more than 50 km45 to 1400 km46 from the ocean.
Of further importance is the emerging trend that test sites located along the eastern coast (particularly along the KwaZulu-Natal seashore) are inclined to higher corrosivity, at the same distance range from the ocean, compared to sites located next to the Western and Eastern Cape ocean fronts. This tendency appears to be valid for the 150-1000 m, 1-3 km, 3-10 km, and 10-30 km ranges from the sea. It is just below the 150-m mark that the corrosivity of the atmosphere along the Western Cape coast appears higher in comparison with the Eastern Cape and KwaZulu-Natal shorelines.
The above alteration in the corrosivity of the environment next to the South African coastline is mainly attributable to the varying meteorological (Table 1 and Figure 3), physical (Figure 2) and biome conditions. Concurring with Winter et al.'s47 climatic regions, the Northern Cape coastline, i.e. from the mouth of the Orange River to Lamberts Bay, is classified as Desert, the Western Cape coast from Lamberts Bay to the mouth of the Breë River as Mediterranean, from the Breë River to Port Elizabeth as Moderate Marine, and the northern parts of the Eastern Cape coastline, i.e. from Port Elizabeth to northern KwaZulu-Natal, as Sub-tropical (Figure 3).48 Cole et al.49 state that marine aerosol transport is likely to be favoured in dry environments that exhibit reduced rainfall and low ground coverage, like in the Northern and Western Cape, than in more humid and higher rainfall climates with forest cover. The change in the corrosivity of the atmosphere, as a result of increasing temperatures, rainfall and relative humidity (moving from the western to eastern parts of South Africa), is partly reflected in the Callaghan1 and Leitch5 maps but is absent in the HDGASA6 chart.
The higher corrosion rate of mild steel below the 150-m mark (along the Western Cape shoreline) may in all likelihood be ascribed to the presence of smaller dunes and shrubbery, called fynbos.50 Fynbos offers less shielding against sea sand and spray, which is whipped up by the high winds from the ocean and dunes, and deposited onto surfaces. Conversely, along the Eastern and KwaZulu-Natal coastlines, the larger and broader leafy sub-tropical plants50 provide better protection against windborne salts. The presence of lingering mist banks (due to the cold Benguela current), reduced rainfall (no washing effect) and prevailing strong onshore winds (southeaster primarily along the Western Cape, as well as parts of the Eastern Cape coastlines), also play important roles in the corrosivity of this region.1,18,51 Nixon and Janse van Rensburg21 reported that along the Northern and Western Cape coastlines, the highest atmospheric corrosivity is typically measured during winter, from about March to September, which corresponds with this region's rainy season. Conversely, next to the eastern coastline, the highest atmospheric corrosion rates are primarily measured during summer.7
Just below the Great South African Escarpment, the average corrosivity of the environment in the Western and Eastern Cape measured 7±6 µm/a [95% CI: 0-20 µm/a], with a minimum of about 1.3 µm/a at Droërivier and a maximum of near 12 µm/a at Bedford,7 corresponding with the difference in the rainfall figures for these locations (Table 1). Moving further inland from the low-lying zones of the Northern, Eastern and Western Cape coastlines, above the Great South African Escarpment (onto the Central Plateau), the conditions change to a desert/semi-desert plateau (the Kalahari Desert and the Karoo). In this region, the corrosion rate of mild steel measured close to 2 µm/a (at De Aar) and near 4 µm/a at Gariep,7 averaging 3±1 µm/a. This region is best classified as low (C2) corrosive, due to the hot arid conditions. From thereon, the corrosivity of the environment increases slightly towards the Free State, measuring approximately 7 µm/a at Dealesville,7 close to Bloemfontein, with an approximate average precipitation of 390 mm/a (Table 1).
Of significance is that the Kalahari, Karoo and the Free State Province are also known for their salt pans and dry riverbeds. As a result, salt-laden soil that is swept up by the wind and deposited onto metal surfaces may encourage corrosion to take place at lower relative humidity. It can also increase the time of wetness, which is of relevance when considering that the Kalahari Desert and the Karoo experience the highest percentage changes in average rainfall in South Africa, i.e. 26-50%.47 These regions also display the hottest summers and highest solar irradiation levels in the country.52,53 Consequently, the variability in the corrosivity of the environment is high. Moreover, studies conducted by Sun et al.54 demonstrated that soluble salt in surface desert soil might sufficiently lower the relative humidity at which corrosion current density suddenly increases.
From the KwaZulu-Natal coastline towards Gauteng, the change in corrosivity of the atmosphere below and above the Great Escarpment is apparently less extreme compared to that of the Northern, Eastern and Western Cape Provinces (Figure 2). This reduction is likely as the environment changes from a sub-tropical coastal to a moderate, sub-tropical rising rocky (escarpment) terrain that exhibits cold, snowy winters, with hot, rainy summers.47,55 The change is also observed in Figure 3,48 which presents the different climatic regions in South Africa.
Proceeding through the lower parts of Mpumalanga, the landscape changes to a temperate Highveld region,55 classified as moderately (C3) corrosive. In this section of Mpumalanga, the average first-year corrosion rate of mild steel measured 29±6 µm/a [95% CI: 25-32 µm/a], suggesting an approximate 26% reduction in the corrosivity of the environment from Empangeni (located in the lowland between the Great Escarpment and the KwaZulu-Natal coastline) towards Ogies, positioned on the Eastern Highveld, likely because of changes in annual precipitation levels (Table 1). The maximum recorded value was near 38 µm/a (at Secunda) and the minimum about 18 µm/a (approximately 20 km north of Belfast).56 The increased corrosivity of Secunda and Emalahleni (Witbank) may be ascribed to the fact that these areas are some of the most polluted regions in South Africa, due to the presence of a large petrochemical plant (Sasol Synfuels), 11 coal-fired power stations and numerous open-cast coal mines.
Shifting towards the North West, Limpopo and Gauteng Provinces, the corrosivity of the environment decreases further. In the case of Gauteng and closely surrounding areas, the average first-year corrosion rate of mild steel measured 25±12 µm/a [95% CI: 19-32 µm/a] (C2), falling to approximately 12±5 µm/a [95% CI: 9-16 µm/a] (C2) towards the Limpopo River (Zimbabwe) and Botswana border, mainly due to a reduction in precipitation levels.
A graphic representation of the first-year corrosion rates of mild steel, measured at all the corrosion monitoring sites, versus their approximate distances from the ocean, is presented in Figure 4. Based on the plot, the macro corrosive atmosphere of South Africa stabilises, meaningfully, moving inland, with the corrosive effects of coastal environments being inversely related to their distance from the ocean, with an R2-value of about 0.5 and Pearson product-moment correlation (PPMC) coefficient (Equation 2) of around -0.4, significant at p≤0.05. Similar graphs have also been reported for sea-salt transport, deposition and corrosion along other coastlines41,57,58 - all displaying a significant decrease in the corrosivity of the marine environment within 1-2 km from the ocean.
The formula for the PPMC coefficient, r, is:
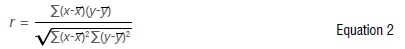
where x and y present the data points, and x and y means the averages for array1 and array2, respectively.59
In contrast, Figure 5 gives the first-year corrosion rates of mild steel, measured at all the corrosion monitoring sites versus their relative altitudes in metres. According to the graph, the corrosivity of South Africa's atmosphere is also slight to moderately negative related to elevation, exhibiting a PPMC coefficient of -0.4, which is significant at p≤0.05. The impact of altitude on the corrosivity of the environment is of particular relevance to the coastal and inland industrial areas of the country.
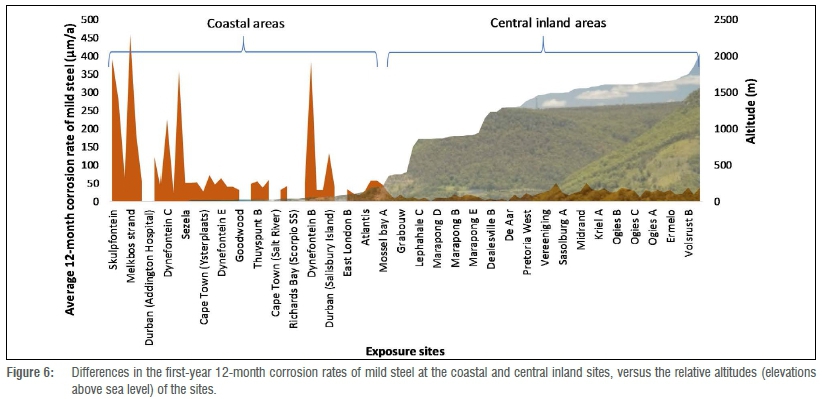
In the sub-tropical Lowveld and semi-desert Karoo regions, with altitude ranges of 500-1000 m, atmospheric corrosivity is notably lower. However, this decrease is because of climatic rather than altitude variations. The differences in the 12-month corrosion rates of mild steel at some of the sites, in contrast with altitude, are also presented in Figure 6.
At central inland locations (Figure 6), it is indicated that atmospheric corrosion is no longer driven by chlorides in the air, but rather by the time of wetness, temperature, pollution (SOx and NOx gases), the wind, and the positioning of the metal substrate above ground level.8 This observation may also apply to regions in and around the central inland and metropolitan areas of South Africa, e.g. the Greater Johannesburg Metropolitan Area, where it has been shown that localised mining, industrial activity, transport and vegetation play essential roles in the elevation of the corrosivity levels of the atmosphere.8
Conclusions
Corrosion maps provide valuable information relating to the degradation of metals and alloys in varying atmospheres. Studies on South Africa's macro atmosphere date back as far as 1947, with the scopes of the more recent studies, i.e. those between the mid-1990s and 2018, being significantly broadened to enable the use of the internationally recognised ISO 9223 corrosivity classification system.
Based on assimilated historical (published and unpublished) and new atmospheric corrosion data for South Africa, the atmosphere within the first 150 m from the ocean is classified as extreme (CX) corrosive. Between the 150 m and 1000 m marks, the environment is rated mid-C4 (high) to mid-C5 (very high) corrosive, from 1 km to 30 km moderate (C3) to high (C4) corrosive, and for most inland locations, low (C2) to potentially high (C4) corrosive. The highest atmospheric corrosivity is typically measured in the Western Cape, within 150 m from the ocean, and the lowest in the Karoo and the Kalahari Desert.
The variability in the corrosion rate of mild steel was found to decrease by as much as 80% between 150 m and 1000 m from the coastline, which supports the general understanding that the effects of chloride deposition, changing altitude, topography, and onshore wind flow (speed and direction), become less prominent in terms of the atmospheric corrosivity of the environment moving inland.
Acknowledgements
We gratefully acknowledge financial support from Orytech (Pty) Ltd, South African Department of Science and Technology, National Research Foundation (South Africa), University of the Witwatersrand, and Hot Dip Galvanisers Association of Southern Africa. We also gratefully acknowledge the materials support and facilities provided by Orytech (Pty) Ltd and University of the Witwatersrand, including permission to publish from Eskom Holdings SOC Limited and South African Weather Service. General assistance from S.T. van Allemann, V. Etsebeth, M.C. Janse van Rensburg, L.M. Janse van Rensburg, O.A Pheko, T. Mokgomo, C.T. Vermaakt and R. Britz is also greatly appreciated.
Authors' contributions
The study was conceptualised, planned, carried out and written up by D.T.J.v.R., in partial fulfilment of her PhD at the University of the Witwatersrand, under the supervision of L.A.C. and J.v.d.M. Funding was acquired by D.T.J.v.R. from Orytech (Pty) Ltd. and the Hot Dip Galvanizers Association of Southern Africa, and by L.A.C. and J.v.d.M. from the Department of Science and Technology, National Research Foundation and the University of the Witwatersrand.
References
1.Callaghan B. Atmospheric corrosion testing in Southern Africa - results of a twenty-year national programme. Pretoria: Scientia Publishers; 1991. http://hdl.handle.net/10204/10635 [ Links ]
2.AECI Paints. Corrosion map of Southern Africa. Johannesburg: AECI Paints; n.d. [ Links ]
3.Leitch J. Corrosivity profile of Southern Africa using ISO 9223 methodology. Paper presented at: The 14th International Corrosion Congress; 1999 September 27 - October 01; Cape Town, South Africa. International Corrosion Council and Corrosion Institute of Southern Africa; 1999. p. 1-10. https://doi.org/10.1108/acmm.1999.12846daa.002 [ Links ]
4.Leitch J. The atmospheric corrosivity profile of Southern Africa - an update. In: Proceedings of the 7th International Corrosion Conference; 2003 January; Johannesburg, South Africa. Johannesburg: Corrosion Institute of Southern Africa; 2003. [ Links ]
5.Leitch J. The corrosivity regions of Southern Africa - long term trends and implications of material selection. Paper presented at: The 8th International Corrosion Conference; 2006 November 14-15; Johannesburg, South Africa. Corrosion Institute of Southern Africa and the South African Institute of Mining and Metallurgy; 2006. p. 1-10. https://doi.org/10.1353/afr.2007.0101 [ Links ]
6.Hot Dip Galvanizers Association of Southern Africa (HDGASA). Corrosion resistance of hot dip galvanized coatings. Hot Dip Galv Today. 2005;2(2):39-45. https://doi.org/10.3403/30083371 [ Links ]
7.Janse van Rensburg D. TX and DX corrosion index map 2009/2010. Research report no. RES/RR/09/31095. Johannesburg: Eskom Holdings SOC Limited; 2010. [ Links ]
8.Janse van Rensburg D. Atmospheric corrosion mapping of South Africa and the Greater Johannesburg Metropolitan Area (GJMA) [thesis]. Johannesburg: University of the Witwatersrand; 2019. [ Links ]
9.King G, Martin K, Moresby J. A detailed corrosivity survey of Melbourne. Highett, Australia: CSIRO - Division of Building Research; 1982. [ Links ]
10.Cole I, Paterson D. Mathematical models of dependence of surface temperatures of exposed metal plates on environmental parameters. Corros Eng Sci Techn. 2006;41(1):67-76. https://doi.org/10.1179/174327806X94045 [ Links ]
11.Li Z, Marston N, Jones M. Update of New Zealand's atmospheric corrosivity map - Study report SR 288. Judgeford: BRANZ; 2013. [ Links ]
12.NACE International. International measures of prevention, application, and economics of corrosion technologies (IMPACT) study [document on the internet]. c2016 [cited 2019 Jul 08]. Available from: http://impact.nace.org/documents/Nace-International-Report.pdf [ Links ]
13.Slabbert M. Cost implications of metallic corrosion for the South African economy in the sectors of mining, power generation, shipping, and transportation - Report no. M251. Johannesburg: Mintek; 1986. [ Links ]
14.Rand vs the dollar: 1978 - 2016 [Internet]. BusinessTech. 2016 March 13 [cited 2017 Apr 09]. Available from: https://businesstech.co.za/news/finance/116372/rand-vs-the-dollar-1978-2016/ [ Links ]
15.The World Bank. South Africa [webpage on the Internet]. c2017 [cited 2017 Apr 09]. Available from: http://www.worldbank.org/en/country/southafrica/overview [ Links ]
16.Natesan M, Venkatachari G, Palaniswamy N. Corrosivity and durability maps of India [document on the Internet]. c2005 [cited 2015 Jul 24]. Available from: http://krc.cecri.res.in/ro_2005/013-2005.pdf [ Links ]
17.Badea G, Cret P, Lolea M, Setel A. Studies of carbon steel corrosion in atmospheric conditions. Acta Technica Corviniensis - Bull Eng. 2011;Tome IV:p. 25-28. [ Links ]
18.Council for Scientific and Industrial Research (CSIR). Results of the four-year atmospheric exposure programme (Report C. CHEM 330). Pretoria: CSIR; 1975. [ Links ]
19.Gross C, Nixon M. Review of corrosion data for the proposed nuclear sites of the Eastern, Southern and Western Coasts - Eskom report TRR/S93/091. Johannesburg: Eskom Holdings SOC Limited; 1993. [ Links ]
20.ASTM G116-99 - Standard practice for conducting wire-on-bolt test for atmospheric galvanic corrosion. West Conshohocken, PA: ASTM International; 2004. [ Links ]
21.Nixon M, Janse van Rensburg D. Environmental contributions to atmospheric corrosion - Eskom research report TRR/S92/168. Johannesburg: Eskom Holdings SOC Limited; 1992. [ Links ]
22.Nixon M. Environmental contributions to atmospheric corrosion. Paper presented at: The 10th European Corrosion Congress; 1993 July 5-8; Barcelona, Spain. International Corrosion Council (ICC); 1993. [ Links ]
23.Janse van Rensburg D. Environmental contributions to atmospheric corrosion - Eskom research report TRR/S94/194/djvr. Johannesburg: Eskom Holdings SOC Limited; 1994. [ Links ]
24.Colloby D. Environmental contributions to atmospheric corrosion - Eskom report TRR/S95/205. Johannesburg: Eskom Holdings SOC Limited; 1995. [ Links ]
25.Northcott K. Environmental contributions to atmospheric corrosion - Paper no. 364. Paper presented at: The 4th International Corrosion Congress; 1999 September 27 - October 01; Cape Town, South Africa. International Corrosion Council and Corrosion Institute of Southern Africa; 1999. https://doi.org 10.1108/acmm. 1999.12846daa.002 [ Links ]
26.Gnoinski J, Ramothlola J. Progress report no. 3 - Monitoring of atmospheric corrosion in the Eastern Transvaal Highveld (report no. 940062). Johannesburg: Division of Materials Science and Technology, Council for Scientific Industrial Research; 1994. [ Links ]
27.Doyle D, Godard H. Rapid determination of corrosivity of an atmosphere to aluminium. In: Proceedings of the 3rd International Congress on Metallic Corrosion; 1966; Moscow, Russia. Moscow: MIR Publishers; 1966. [ Links ]
28.ISO 9223. Corrosion of metals and alloys: Corrosivity of atmospheres - classification. Geneva: International Organization for Standardization; 1992. [ Links ]
29.ISO 9226. Corrosion of metals and alloys: Corrosivity of atmospheres - determination of corrosion rate of standard specimens for the evaluation of corrosivity. Geneva: International Organization for Standardization; 1992. [ Links ]
30.SANS 1796. South African National Standard - Application of durable organic powder coatings for architectural aluminium. Pretoria: SABS Standards Division; 2013. [ Links ]
31.Pietersen D, Holtzhausen J, Vosloo W. An investigation into the methodology to develop an insulator pollution severity application map for South Africa. Paper presented at: The AFRICON Conference; 2004 September 15-17; Cape Town, South Africa. IEEE; 2004. https://doi.org/10.1109/africon.2004.1406774 [ Links ]
32.Calitz J, Potgieter J. Corrosion of overhead power transmission conductors in marine environments. Trans S Afr Inst Electr Eng. 2005;96(4):306-311. [ Links ]
33.O'Donnell A, White R, Bronkhorst R, le R. Fourie F. The results of an atmospheric exposure programme on agricultural wire in South Africa [document on the Internet]. No date [cited 2016 Jan 02]. Available from: http://www.izasa.org/Documents/Technical/Exposure%20Progamme%20o n%20Agricultural%20Wire%20in%20SA%20-%20paper%20046.pdf [ Links ]
34.Janse van Rensburg D. Corrosion index map - Eskom scan report no. RES/SC/05/26612. Johannesburg: Eskom Holdings SOC Limited; 2005. [ Links ]
35.ISO 9226. Corrosion of metals and alloys: Corrosivity of atmospheres - determination of corrosion rate of standard specimens for the evaluation of corrosivity. Geneva: International Organization for Standardization; 2012. https://doi.org/10.3403/30209297 [ Links ]
36.ISO 9223. Corrosion of metals and alloys: Corrosivity of atmospheres - classification, determination and estimation. Geneva: International Organization for Standardization; 2012. [ Links ]
37.Saexplorer.co.za. Climate [webpage on the Internet]. No date [cited 2019 Feb 19]. Available from: http://www.saexplorer.co.za/south-africa/map/south_africa_map.asp [ Links ]
38.Cottis R, Graham M, Lindsay R, Lyon S, Richardson J, Scantlebury J, et al. Shreir's corrosion. Volume 2. 4th ed. Amsterdam: Elsevier; 2010. https://doi.org/10.1016/b978-044452787-5.09002-8 [ Links ]
39.OpenStax CNX. Natural science - Ecosystems and the environmental balance [webpage on the Internet]. No date [cited 2017 Aug 17]. Available from: http://archive.cnx.org/contents/669116d7-d148-4af9-905d-4dcdf17cde56@1#graphics1.png [ Links ]
40.Cole I, Paterson D. Holistic model for atmospheric corrosion. Part 5 - Factors controlling deposition of salt aerosol on candles, plates and buildings. Corros Eng Sci Techn. 2004;39(2):125-130. https://doi.org/10.1179/147842204225016949 [ Links ]
41.Rozenfeld I. Atmospheric corrosion of metals. Houston, TX: NACE International; 1972. [ Links ]
42.Maps-streetview.com. Grabouw maps - road map, satellite view and street view [webpage on the Internet]. No date [cited 2017 Apr 09]. Available from: https://www.maps-streetview.com/South-Africa/Grabouw/ [ Links ]
43.Hernandez FJ, Santana JJ, Souta S, Gonzales S, Morales J. Characterization of the atmospheric corrosion of aluminium in Archipelagic subtropical environments. Int J Electrochem Sci. 2011;6:6567-6580. [ Links ]
44.Del Angel E, Vera R, Corvo F. Atmospheric corrosion of galvanised steel in different environments in Chile and Mexico. Int J Electrochem Sci. 2015;10:7985-8004. [ Links ]
45.Ballance J, Duncan J. Wind-borne transport and deposition of sea-salt in New Zealand. New Zealand J Technol. 1985;1:239-244. [ Links ]
46.Thornton J, Kercher J, Riedel T, Wagner N, Cozic J, Holloway J, et al. A large atomic chlorine source inferred from mid-continental reactive nitrogen chemistry. Nature. 2010;464(7286):271-274. https://doi.org/10.1038/nature08905 [ Links ]
47.Winter K, Oelofse C, Bottaro J. Oxford senior atlas vir Suider-Afrika [Oxford senior atlas for southern Africa]. 13th ed. Cape Town: Oxford University Press Southern Africa; 2013. Afrikaans. [ Links ]
48.OpenStax College. Geography [webpage on the Internet]. c2017 [cited 2017 Apr 09]. Available from: http://archive.cnx.org/contents/d5717376-e429-4585-a1ee-98767a736cfd@1/climate-regions [ Links ]
49.Cole I, Paterson D, Ganther W. Holistic model for atmospheric corrosion. Part 1 - Theoretical framework for production, transportation and deposition of marine salts. Corros Eng Sci Techn. 2003;38(2):129-134. https://doi.org/10.1179/147842203767789203 [ Links ]
50.Wiegand P, editor. Oxford secondary atlas for South Africa. Cape Town: Oxford University Press; 2007. [ Links ]
51.Barnett W. Walter's corner - the atmospheric corrosion rate is not always what it seems to be! Hot Dip Galv Today. 2006;3(1):36-37. [ Links ]
52.South African Tours and Travel.com. Enjoy South Africa 's climate, delightfully mild and pleasant all year round [webpage on the Internet]. No date [cited 2017 Aug 18]. Available from: http://www.south-africa-tours-and-travel.com/south-africa-climate.html [ Links ]
53.Evwind. Enel brings two new South African PV plants [webpage on the Internet]. No date [cited 2017 Aug 16]. Available from: https://www.evwind.es/2017/02/06/enel-brings-two-new-south-african-pv-plants/58722 [ Links ]
54.Sun S, Zheng Q, Wen J, Li D. Atmospheric corrosion of aluminium in the northern Taklamakan Desert environment. Mater Corros. 2009;61(10):852-859. https://doi.org/10.1002/maco.200905422 [ Links ]
55.Maskew Miller Longman (Pty) Ltd. Pearson - platinum high school atlas. 6th ed. Cape Town: Maskew Miller Longman; 2016. [ Links ]
56.Nixon M. Environmental contributions to atmospheric corrosion - Eskom interim report TRR/S91/143. Johannesburg: Eskom Holdings SOC Ltd; 1991. [ Links ]
57.Corvo F, Perez T, Dzibb L, Martin Y, Castañeda A, Gonzalez E, et al. Outdoor-indoor corrosion of metals in tropical coastal atmospheres. Corros Sci. 2008;50(1):220-230. https://doi.org/10.1016/j.corsci.2007.06.011 [ Links ]
58.Castaneda A, Corvo F, Howland J, Marrero R. Penetration of marine aerosol in a tropical coastal city: Havana. Atmósfera. 2018;31(1):87-104. [ Links ]
59.Microsoft. Microsoft Excel - Pearson function [webpage on the Internet]. No date [updated 2017; cited 2017 Apr 15]. Available from: https://support.office.com/en-us/article/PEARSON-function-0c3e30fc-e5af-49c4-808a-3ef66e034c18?NS=EXCEL&Version=16 &SysLcid=1033&UiLcid=103 3& AppVer=ZXL160&HelpId=xlmain11.chm60360&ui=en-US &rs=en-US&ad=US [ Links ]
 Correspondence:
Darelle Janse van Rensburg
Email: darelle@orytech.co.za
Received: 08 Apr. 2018
Revised: 25 Feb. 2019
Accepted: 11 Mar. 2019
Published: 30 July 2019
EDITOR: Tania Douglas
FUNDING: Orytech (Pty) Ltd; South African Department of Science and Technology; National Research Foundation (South Africa); University of the Witwatersrand; Hot Dip Galvanizers Association of Southern Africa

