


Services on Demand
Article
 English (pdf)
 Article in xml format
 Article references
Indicators

Related links
-
 Cited by Google
 -
 Similars in Google
Share

 Permalink
South African Journal of Science
On-line version ISSN 1996-7489
Print version ISSN 0038-2353
S. Afr. j. sci. vol.115 n.7-8 Pretoria Jul./Aug. 2019
http://dx.doi.org/10.17159/sajs.2019/5655
RESEARCH ARTICLES
A 20-year evaluation of PLAAS research outputs: Impact on the scholarly domain and in social media
Gillian KerchhoffI; Michelle KahnII; Mary NassimbeniII
IInstitute for Poverty, Land and Agrarian Studies, University of the Western Cape, Cape Town, South Africa
IIDepartment of Knowledge and Information Stewardship, University of Cape Town, Cape Town, South Africa
ABSTRACT
Patterns and methods of scholarly communication have changed with the growth in information technology, particularly the Internet and the social web. The changes have necessitated a broader definition of scholarly communication and the role of social media in the research process. We sought to record the body of work that the Institute for Poverty, Land and Agrarian Studies (PLAAS), a research institute at the University of the Western Cape, produced over a 20-year period (1995-2015) - the first two decades of its existence - and to measure its visibility and impact using bibliometrics and altmetrics. A survey was also carried out to investigate to what extent PLAAS researchers knew and used social media in their research practice. Scopus and Google Scholar were used as citation indices and Altmetric.com provided Altmetric scores - a measure of impact through social and mainstream media. The full list of PLAAS outputs showed a composition of 54% grey literature and 46% journal articles and monographs. Given that over half of PLAAS research outputs were in the form of grey literature, and therefore not indexed in traditional bibliometric databases, we suggest that alternative metrics be used in conjunction with bibliometrics, to measure the impact of a body of work on the scholarly domain. Although the bibliometrics in this study were a useful quantitative indicator of the impact of PLAAS research, this study was inconclusive with regard to determining the impact of the research output via altmetrics, partly because not any of the grey literature, nor any author from PLAAS, had a unique identifier, thus making it difficult to track and find quantitative indicators. Nonetheless, the potential benefit for PLAAS of using altmetrics was demonstrated in selected case studies of the output of three PLAAS researchers active on social media platforms.
SIGNIFICANCE:
•This study demonstrates that the use of bibliometric and altmetric analyses can yield a rich picture of research output and significance, providing insight into the patterns of scholarly communication of research and policy institutions.
•The application of the research design in other research units and departments could generate results that are useful to research management within those institutions.
Keywords: bibliometrics; altmetrics; research outputs; scholarly communication; grey literature
Introduction
Research evaluation is an established practice in scholarly communication, and is important in the allocation of scarce funding to priority areas, as well as in decision-making around tenure and promotions.1,2 There is growing interest in the metrics used to evaluate research and the people who produce it, particularly as individual peer review becomes more difficult with the growing volume of research produced.2,3 Peer review is expensive, subjective and suited to small groups or individuals. However, metrics should be used with caution, and are preferable for assessing large research organisations or mapping trends rather than for evaluating individual researchers.4,5
Groos and Pritchard6 defined bibliometric analysis as 'the application of statistical and mathematical methods to books and other media of communication'.6 Bibliometrics is a quantitative method of evaluation and it is emphasised throughout the literature that qualitative peer review should be part of an overall evaluation, and that citation analysis, even using a number of different metrics, should not be used as the only basis on which to base decisions regarding promotion and tenure. Gorraiz et al.7 state that 'it cannot be stressed often enough that citations are only used as a proxy for the impact (and not for the quality)' of the publications in scholarly communication.
Scholarly communication is defined by Borgman8 as 'the study of how scholars in any field (e.g. physical, biological, social and behavioural sciences, humanities, technology) use and disseminate information through formal and informal channels'. The Association of College and Research Libraries defines it as 'the system through which research and other scholarly writings are created, evaluated for quality, disseminated to the scholarly community, and preserved for future use'9.
There is agreement in the literature that scholarly communication has changed as a result of evolving information and communications technologies.10-17 Since the introduction of the Internet, and particularly the rise of the social web (also called Web 2.0), publication and dissemination of research outputs have shifted from being the exclusive domain of formal publishers to being available to researchers themselves.10,18 Knowing which social media and networks are effective for disseminating research assists researchers in reaching and influencing as wide an audience as possible.5
Another significant change to scholarly communication noted in the literature is that a networked and digital environment allows a variety of output types to be produced, in addition to the traditional journal article and monograph. Van de Sompel et al.16 argue for a wider view of these currently privileged 'units' of scholarly communication as technology allows for greater variety, flexibility and speed in publication.
Altmetrics, or alternative metrics, is a form of measurement of scholarly communication at an article level and is a result largely of developments in technology that have presented new opportunities through the social web. There is still some debate around a definition of altmetrics13,19 but it is clear that these metrics complement traditional metrics20 and provide a broader picture of social impact and visibility of research21. Altmetrics are not yet standardised13,22,23, which means there is some difficulty in establishing categories and definitions in order to generate consistent and comparable indicators. While more research and refinement is needed in terms of the use and role of these metrics in measuring research impact, it is evident in the literature that the 'growing importance of this emergent application area of social media for research evaluation'23 cannot be ignored. The impact of research on society, and not just within academia, is increasingly viewed as an important aspect of the practice of research and altmetrics is a means of measuring visibility and impact through social media activity.20,23
Using these tools, we evaluated the impact of the scholarly outputs of the Institute for Poverty, Land and Agrarian Studies (PLAAS) at the University of the Western Cape (UWC) from 1995 to 2015 using bibliometric and altmetric analyses. A survey was employed as a research instrument to discover the PLAAS researchers' extent of knowledge and use of social media (including Facebook, Twitter, Cite-U-Like, ResearchGate.net and others) in an academic environment. The specific objectives were:
1.To record the body of research outputs, both externally and internally published, for the period 1995 to 2015.
2.To use bibliometric and altmetric analyses to measure activity and visibility of the researchers at PLAAS and to investigate the impact of their scholarly outputs.
3.To gain an understanding of the awareness and use of social media by PLAAS researchers.
PLAAS, originally called the Programme for Land and Agrarian Studies, celebrated 20 years of existence in 2015. PLAAS's 20th anniversary provided an opportune time to document and evaluate PLAAS research against the background of increased pressure on academics to demonstrate impact in a rapidly changing research landscape in which the practice of scholarship is being significantly affected by new information and communication technologies. The Programme was established at UWC with the aim of conducting high-quality 'critical research' to enable the new government in South Africa to develop policy and practice around issues of land and its redistribution, as well as poverty and agrarian reform.24 These subject areas are of topical significance in post-apartheid South Africa policy and research and attract interest not only from scholars and government but also from the general public.
PLAAS researchers produce scholarly outputs in peer-reviewed journals and elsewhere, and they collaborate with local, regional and international authors. However, at the time of undertaking this study, PLAAS had no empirical report of research outputs nor of the valuable bibliometric indicators derived from the outputs. The lack of such a record limited the ability of the Institute to measure the impact and visibility of its scholarly communication. In addition to scholarly publications, the Institute engages with policymakers and the public, through the publication of grey literature intended for that audience. This grey material is not indexed in citation databases and is therefore not usually included in a bibliometric analysis. Altmetrics could assist in measuring attention that is paid to all PLAAS outputs, thereby providing insight into whether more could be done to promote the research on social media.
This investigation was the first of its kind at UWC and it provides insight into the scholarly communication of research and policy institutions such as PLAAS, offering a methodology useful for research and evaluation management both at the institute and for the university.
Methodology
In order for the bibliometric and altmetric analyses to be conducted, it was first necessary to compile a master list of the total number of PLAAS outputs using records that are kept at PLAAS in the Zotero reference management system. Included in these records are publications such as journal articles, monographs, book chapters and conference papers, as well as documents such as parliamentary submissions or hearings, research reports, policy briefs and occasional papers. All conference papers were categorised as 'grey literature' and not 'scholarly outputs' as few of them appeared in formal conference proceedings. Zotero records are also kept for television and radio appearances, news media items which refer to PLAAS, policy engagement presentations, seminars and blogs, but these were not included in this study. The master list was corrected and updated to cover the period 1995-2015, and crosschecked against the PLAAS website on which new publications were routinely featured.
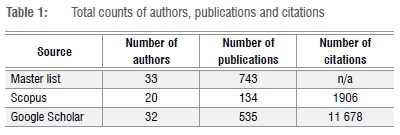
The final master list (Table 1) consisted of 33 PLAAS authors and 743 publications, including 100 publications authored by external researchers (that is, researchers working with staff members but not employed at PLAAS). It must be noted that in the case of a paper being co-authored by more than one PLAAS author, each author was assigned a record for that paper. This policy is the same as that followed by Scopus and Google Scholar when recording number of outputs and number of citations.
Although there are other databases Scopus was selected because it was readily available at PLAAS and Google Scholar was selected because its coverage includes the World Wide Web, which is therefore greater than that of Scopus and the Web of Science which rely on the journal titles in their databases only. Google Scholar also includes document types excluded by Scopus, such as patents, research reports, policy briefs, hardware or software artefacts and all self-archived and open access material. Furthermore, Google Scholar indexes publications in a greater range of languages and from a wider coverage of regions of the world, unlike Scopus and Web of Science which focus primarily on publications in English, and tend to favour the Global North in terms of coverage, while countries and languages from the Global South are less well covered.2,25
The number of publications between 1995 and 2015 indexed in Scopus, and their citation counts, were retrieved for each PLAAS-affiliated author through the author search function using their last name and first initial. Lists were checked for accuracy against the master list. It was noted that not all PLAAS authors were indexed by Scopus: of 33 in the master list, only 20 were found in Scopus. The total number of publications found in Scopus by these 20 authors for the period 1995-2015 was 134. This figure was further broken down into number of publications per year, author, and document type. Lastly, the h-indices of the authors, as presented in Scopus, were recorded.
All PLAAS author outputs in Google Scholar were found by performing an author search using the full name, and excluding patents and citing publications. The results for each author for the specified time period were then saved. There were, however, quite a few errors such as missing information, duplicates and erroneous items and the records had to be verified against the master list and false hits eliminated. A total of 32 authors and their 535 publications were found in Google Scholar for the specified time period. The h-indices and number of citations were also recorded. Table 1 provides a summary of the results of the author and publication searches in the two citation indices as well as the master list.
Altmetric indicators for PLAAS outputs were more difficult to source than bibliometric indicators. The three main tools available for altmetric analysis of scholarly outputs are PlumX, ImpactStory and Altmetric.com. These tools aggregate social media activity and other metrics (such as mainstream media mentions) and citations, producing their own particular indicator/s accordingly. Altmetric.com was selected for this component of the research because Altmetric Explorer fitted our needs, namely to find altmetric indicators for particular authors' publications. Secondly, at the time of the study, Altmetric.com was the dominant product in the market, and thirdly, the company gave permission to use Altmetric Explorer free of charge for research purposes.
The search in Altmetric Explorer was conducted in January 2017, using each author's full name, and specifying a date range of 01 January 1995 to 31 December 2015. Altmetric.com's aggregated score, called the Altmetric Attention Score (AAS), is available for items for which there has been some activity to collect and aggregate.
In addition, altmetric data were collected for three specific PLAAS documents for closer inspection through Google Analytics, Facebook and Twitter application programming interfaces (APIs) in the PLAAS website. These outputs were selected based on their high number of views and downloads.
A short, self-administered questionnaire was sent to the researchers at PLAAS to understand how much they knew about and used the various online social media tools and platforms for sharing scholarly information. This survey was approved by the Ethics Committee of the Humanities Faculty at the University of Cape Town (reference number UCTLIS201609-06).
Data analysis and interpretation
The data collected were used to achieve the main objective of this study, which was to record in detail the corpus of PLAAS research outputs over the period 1995-2015 and to investigate their activity and impact in the scholarly and social contexts.
Outputs 1995-2015
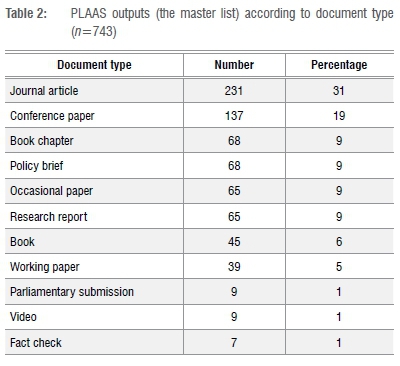
Table 2 summarises the master list of publications with a total of 743 outputs listed by document type. Slightly fewer than half of the publications (n=344) fell into the broad category of scholarly publications: namely journal articles, books and book chapters. The second category (n=399) comprised other documents or outputs (referred to here as grey literature) including policy briefs, videos, research reports and conference papers.
Authors
Although it was not the intention of the study to focus on individual staff members, because many metrics operate at author level, individuals' scores have been highlighted as these significantly raised the overall impact of the Institute's outputs.
A total of 33 PLAAS-affiliated scholars were responsible for authoring or co-authoring 643 outputs over the 20-year period. The external researchers who co-authored the remaining 100 outputs were excluded from the set of 33 authors as categorised for the study.
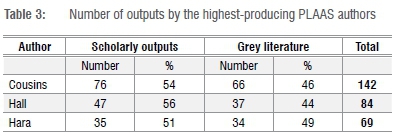
Emeritus Professor Cousins, a founding member of PLAAS in 1995, was the most prolific author with 142 outputs over that period. Associate Professors Hall and Hara were ranked next with 84 and 69 outputs, respectively. Table 3 presents the analysis of results by document type from these three most productive PLAAS authors: Cousins, Hall and Hara. It is apparent that all the authors produced almost the same proportion of each kind of output, scholarly and grey literature, the greatest difference being in Hall's outputs which were 44% grey and 56% scholarly literature.
Lotka's law of author productivity, which states that
for any body of literature, there will be a substantial number of authors who have each contributed only one publication, a small number of authors who have each contributed a small number of publications, and a very small group of authors who have each contributed a substantial number of publications26
has been shown to apply in studies such as that of Rotich and Onyancha27. Similarly, in our study, there is evidence in the patterns of author productivity that Lotka's law applies. Thus, the largest group of 23 authors produced a total of 138 publications (25%), the next group of 7 authors (15 papers or more each) contributed 210 publications (39%) and the top 3 authors (Cousins, Hall and Hara) contributed the most publications at 295 (46%) in total.
Bibliometric analysis
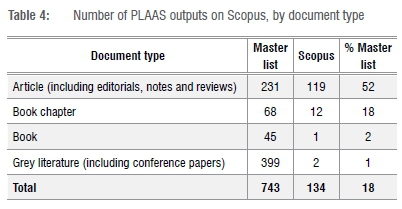
In both Scopus and Google Scholar databases, most items by PLAAS authors were journal articles: 139 (60%) on Google Scholar and 119 (52%) on Scopus. High value is assigned to the journal article in scholarly communication compared to other units like books and book chapters25,26, making journal articles a sought-after output. Both Scopus and Google Scholar produced very few results for PLAAS-authored books and book chapters. Scopus did not retrieve any of the PLAAS grey literature, while Google Scholar provided records for 74 (19%) of the 399 grey literature outputs.
Citation analysis is central to bibliometrics and is based on the premise that the number of times that an article is cited indicates a measure of use and impact of that article. Citation analysis 'involves the construction and application of a series of indicators of the "impact", "influence" or "quality" of scholarly work, derived from citation data'28 and impact is even viewed as 'synonymous with citation-based metrics'29. Using 'volume of impact as a proxy for value (i.e. number of citations or more recently number of online mentions)'30 is largely accepted.
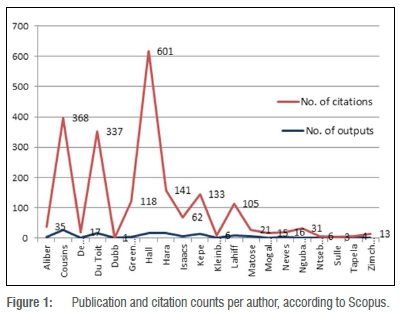
The 134 publications found in Scopus, equating to 18% of the total number of PLAAS outputs (Table 4), were used to calculate a citation count. The data set presented in Figure 1 shows that Hall's 16 outputs had the most citations (601) in Scopus, Cousins' 28 outputs had the second highest number of citations (368), and Du Toit's 16 publications had 337 citations.
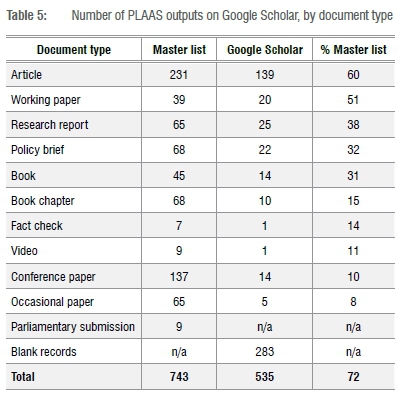
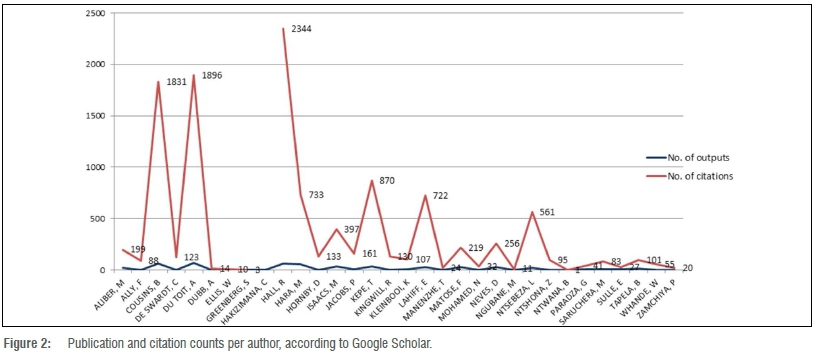
Onyancha and Ocholla31 found in their research that Google Scholar provided a more comprehensive set of publication results than either Scopus or Web of Science. This finding is similar to our results, as shown in Table 5: 535 records, or 72% of the total outputs, were retrieved from Google Scholar - 54% more than that from Scopus.
Within these results, as depicted in Figure 2, Cousins, Hall and Du Toit were identified as the top researchers in terms of productivity and number of citations, reflecting the pattern found in Scopus (1831 citations to Cousins' 61 publications; 2344 to Hall's 66 publications; and 1896 to Du Toit's 67 publications). Their senior rankings (Professor and South African Research Chair, Associate Professor and Professor, respectively) in the university hierarchy and extensive periods of tenure at PLAAS (20, 13 and 20 years, respectively) are likely contributing factors to their high productivity and associated metrics. This finding is consistent with other studies in the literature7,27 which have found that seniority is a reliable predictor of high metrics.
The average number of citations per author in Scopus was 62; 8 authors had 62 or more citations, while 12 authors had fewer than 62 citations. In Google Scholar, the average per author was 350 citations and, out of 32 authors in the Google Scholar results, 8 authors had more than 350 citations and 24 authors had fewer than 350 citations. Significantly, of the eight, five authors scored above the average in both citation databases: Cousins, Du Toit, Hall, Hara and Isaacs; three of these authors (Cousins, Hall, Hara) also had the highest number of publications, citations and h-indices (cf Figures 1 and 2).
The h-index is a useful author-level metric intended by Jorge Hirsch (who proposed the formula in 2005) to provide a better indicator for measuring research impact than a citation count on its own. Castillo32 expressed confidence in the h-index, saying that 'the h-index, at least for now, provides a robust single metric that combines quality and quantity'. The calculation takes both the number of publications and the number of citations into account, is widely used in bibliometrics, and is commonly accepted in research evaluation exercises. It is noted that the h-index does not mean much in isolation and needs to be shown in comparison with those of others in a similar discipline and with a similar career age.7,32,33 Castillo32 compared h-indices from Google Scholar and Scopus and found a high correlation.
For the sake of comparison, the h-indices of three highly cited academics from a related social science discipline at UWC were explored (Figure 3). Professors A, B and C were considered the most suitable researchers, respectively, to provide a reasonable comparison to Cousins, Du Toit and Hall (the top PLAAS researchers in terms of productivity and number of citations), being of similar career age and status. Data on Professor A's, B's and C's outputs were collected from both Google Scholar and Scopus, using Harzing's Publish or Perish software to retrieve the Google Scholar h-index and using Scopus for its h-index. The 1995-2015 time period was specified in the search so only outputs in those years are included in the calculations of h-index. This was an attempt to limit the comparison of different authors' career ages, but some authors have obviously published for longer because of their greater chronological age.
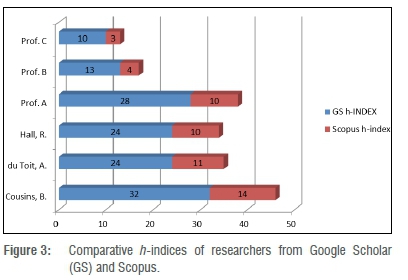
The results (depicted in Figure 3) showed that, of the six researchers, Cousins had the highest h-index in both databases (32 in Google Scholar and 14 in Scopus), which is slightly more than Professor A, who had the highest score of the three academics from the comparative sample with an h-index of 28 in Google Scholar and 10 in Scopus. Du Toit and Hall both scored higher than Professors B and C, respectively. The total score of the three scholars from PLAAS was higher than the total score of the three top scholars in the related discipline in both Google Scholar and Scopus.
The h-index has shortcomings, as do many other bibliometric indicators. It can 'oversimplify a researcher's impact' as Haustein and Larivière34 argue, and does not always give accurate comparisons between researchers' impacts. However, given the results from both Scopus and Google Scholar, the higher h-indices of PLAAS scholars compared with those of the top researchers in the comparative sample indicate that the productivity and impact of the research from PLAAS was greater.
Altmetric analysis
An Altmetric.com search for PLAAS outputs returned a low number of results: 46 of the 743 records (6%). It was hoped that some of the grey literature would be available in Altmetric.com's database, but this was not the case. Of the 46 outputs found in Altmetric.com, 38 were journal articles, 5 were book chapters and 3 books. One of the reasons for this low coverage is most certainly the lack of a unique identifier for most PLAAS outputs. The use of identifiers such as digital object identifiers (DOIs), PubMed IDs, arXiv IDs or handles from repositories has been investigated by a number of authors. Peters et al.35 'suggest that the adoption of this permanent identifier increases the online visibility of research data and inclusion in altmetrics tools', while Araújo et al.36 note that the absence of a DOI diminishes the likelihood of outputs 'obtaining altmetrics data in the current scenario'. Torres-Salinas et al.37 also emphasise the need to have a DOI when searching for altmetrics on outputs. Some of the PLAAS outputs were in the UWC institutional repository and therefore had a handle which can be used as an identifier, but in this case none was found by Altmetric because there had been no activity, such as in social media, associated with the item at the time of the search.
Altmetric.com provides the AAS which is 'derived from an algorithm, and represents a weighted count of all the attention data picked up for that research output'38. Holmberg30 and Mukherjee et al.17 are cautious about the use of an aggregated score, as the advantage of altmetrics is its 'multidimensional nature'17 and the diversity at article level, in contradistinction to an aggregated number. However, a single value is useful as a first step in evaluating outputs which should then be followed up by studying the details of a particular article.
Of the 46 PLAAS outputs from Altmetric.com, 38 had an AAS. The other eight records are nevertheless in Altmetric.com's Explorer database and any future activity related to an item (such as tweets, Facebook shares, Mendeley readers) will be reflected in Altmetric.com and its AAS.
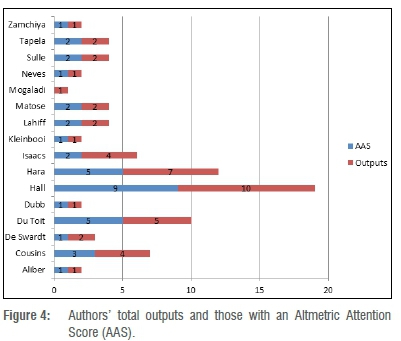
Along with the total outputs picked up by Altmetric.com, Figure 4 displays the AASs for authors found in Altmetric Explorer, showing that the majority of authors had a total score of less than 10. Those that scored an AAS higher than 10 were Matose (11), Hara (27) and Hall (99). The notes given in Altmetric.com alongside the AAS (not shown here) are useful as they indicate ranking according to the score e.g. if it is in the top 25, 10 or 5 percentiles or whether it is 'average', 'above average' or 'good'. The highest scoring article by Hall, with an AAS of 59, was in the top 5% of all research outputs scored by Altmetric.com indicating an excellent result. However, not all the records had notes indicating the broader significance of the score.
The Altmetric.com information for the articles that were found did nevertheless give a broader and richer understanding of the visibility and impact at article level. Twitter activity by far exceeded any other social media activity in this set of 38 records for which there were 120 tweets and only seven Facebook shares in total. It is possible that the Twitter counts were affected by the fact that PLAAS has a Twitter account and research outputs are tweeted about through this account. Altmetric information for these records included counts of news outlets (mainstream news), policy sources (such as the Food and Agriculture Organisation documents) and mentions in blogs, all of which are potentially useful information for a policy institute such as PLAAS.
As shown in Figure 4, of the 33 PLAAS authors investigated, 16 authors were included in the Altmetric Explorer database, only one of whom did not have an AAS. The highest number of outputs per author retrieved from Altmetric Explorer was 10; of these, 9 outputs had an AAS while the 10th was included in the database but had no score.
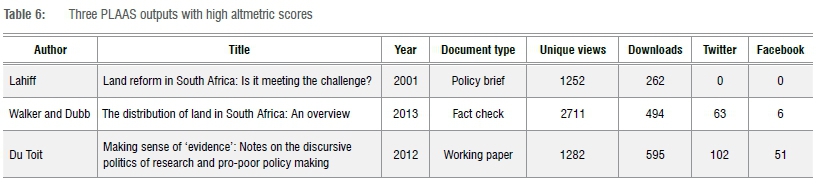
The results from Altmetric Explorer covered a small percentage of the outputs from PLAAS and were limited to journal articles, books and book chapters only. We aimed to look at the impact and visibility of grey literature as well as traditional scholarly publications. The lack of anticipated altmetric results for grey literature (possibly because PLAAS grey literature did not have unique identifiers) necessitated a selection of three publications for analysis. These publications - a policy brief, a 'fact check' and a working paper - received the highest number of page views and downloads according to Google Analytics and therefore were considered noteworthy for further investigation. These publications and their usage metrics (page views and downloads) are shown in Table 6, along with social media metrics (Twitter and Facebook activity) associated with each. Because these three outputs were not in the Altmetric.com database, the counts of views and downloads were found by using Google Analytics, while the Facebook and Twitter APIs on the PLAAS publications website were used to count Twitter and Facebook shares.
These indicators were higher for these three outputs than for other PLAAS outputs, with downloads in the hundreds for all three. The highest number of page views (2711) was for Fact Check 1, followed by Working Paper 21 (1282 views) and Policy Brief 1 (1252 views). Working Paper21 was downloaded the most (595 downloads) and Policy Brief ١ the least (262 downloads) of the three documents. These three publications were the only publications in the top 10 of page downloads for the PLAAS website as a whole.
Fact Check ١ had 6 Facebook shares and 63 tweets and Working Paper ١ had 52 Facebook shares and 102 tweets (Table 6). The Policy Brief was published in 2001, before Twitter was available, and so did not have any tweets recorded. The recorded counts did not include other tweets that referred to these publications but which did not provide a direct link to the URL (which often is shortened for Twitter, which can create difficulty for tracking) so the actual number of tweets relating to these publications could be considerably higher.
In order to find out more about the context in which these outputs were produced and shared, the authors were contacted via email and information was gathered from the Communications and Information Officer of PLAAS who was responsible for their online publication.
Policy Brief 1 entitled 'Land reform in South Africa: Is it meeting the challenge?' was published in 2001 and it was the first time that 'the key land reform issues were summarised and solutions offered, in a popular format' (Pointer R 2017, written communication, February 08). This first brief was originally sent out in printed form by post to a number of policymakers and others. It was uploaded onto the website in 2011 and was downloaded 262 times between then and the time of the study.
Working Paper 21 entitled 'Making sense of "evidence": Notes on the discursive politics of research and pro-poor policy making' was published in 2012 and was one of the first papers in which evidence-based policymaking practice was challenged. This approach was originally taken in the health sector in the United Kingdom and was adopted by countries in the Global South (including South Africa) that received research funding from the British Department for International Development and other donors. Shortly after the paper was released, PLAAS held a symposium which looked at evidence-based policymaking in the South African context and the paper was presented there by Du Toit, which gave it greater coverage. A final contributing factor to its online popularity was that 'a champion of the cause', Enrique Mendizabal, who was himself challenging evidence-based policymaking doctrine, actively spread word of this paper through Twitter and his blog (Du Toit A 2017, written communication, February 06). Mendizabal was an expert in the field, so when he championed the paper, many people in the field sought it out, which contributed to it being downloaded the most (595) of the three publications.
Fact Check 1 entitled 'The distribution of land in South Africa: An overview' was the first in a series of four concise papers that challenged the many land reform myths that had been widely circulating, particularly in the media. The series gave current and statistical evidence in the form of infographics regarding land ownership and land reform. At the time that the series was published, a major international conference was held that commemorated the South African 1913 Land Act and the fact checks reached a number of journalists and others at the conference. According to the PLAAS Communications and Information Officer, the series was also vigorously promoted in a social media campaign at the time of publication and the papers are still being used 4 years later, with 494 downloads for Fact Check 1 at the time of writing (Pointer R 2017, written communication, February 08). There is no updated replacement yet for these fact checks and 'in broad terms Fact Check 1 remains relevant and helps to complicate simplistic claims' (Walker C 2017, written communication, February 14).
In each of these cases, there were substantive reasons for the high altmetric counts. Either a new way of presenting information to a non-scholarly audience and wide dissemination was introduced (as in the case of the Policy Brief and Fact Check) or the publication was championed by a particularly powerful individual (as happened with the Working Paper) or was publicised at concurrent events and through the mainstream media or social media (as with the Working Paper and the Fact Check).
Survey
Of the 12 PLAAS researchers approached, 10 responded to the questionnaire about social media and online sharing tools. This survey was used to test the premise that if researchers used some of the many available social media platforms and networks that can benefit their research, then their online presence, and therefore attention paid to their work, would be high. Questions were phrased to discover how active researchers were in their academic capacity on social networking platforms; whether they had a personal website; what reference management and sharing software they used, if any; whether they had Wikipedia entries; what professional online profiles, if any, they maintained; whether they had an Open Researcher and Contributor ID (ORCID); and, what, if any, social media tools they used for research purposes.
Overall, the responses to the questionnaire illustrate that the majority of PLAAS researchers had little knowledge of the various social media platforms and tools which would give them an online research presence. Consequently, the use of many such platforms and tools was also low. The highest response rate was related to the academic networking sites Academia.edu and ResearchGate.net. In this instance, seven respondents said that they had a profile on Academia.edu and six had one on ResearchGate.net. There was a nil response to the use of ORCIDs, Wikipedia entries and to having personal websites. PLAAS researchers were shown to be active in blogging, with six saying that they write blogs (PLAAS's blog, Another country, is one avenue for researchers). Researchers were also relatively active on Twitter (four) and LinkedIn (five). The reference management system, Zotero, was used by seven of the respondents and one used Mendeley.
Conclusion
We have shown that in the period under review, PLAAS produced a high number of outputs of many different types, not only scholarly journal articles and books but also much grey literature. While Google Scholar and Scopus are valuable tools for measuring visibility and impact of research outputs, both have the limitation of not being able to provide a definitive list of outputs from an author or institution; for this study, a master list was compiled as the full record of the body of research published by PLAAS from 1995 to 2015.
The bibliometric and altmetric analyses were successfully carried out to measure the visibility and impact of PLAAS's body of research. The citations and the comparative h-indices from both Google Scholar and Scopus show that PLAAS researchers' visibility and impact in the scholarly domain, relative to others in the social science disciplines at UWC, was high. This indicates that the PLAAS research produced in the years 1995-2015 has had an impact in the scholarly context, at least for those outputs included in the citation indices.
The altmetric results were, however, disappointing overall. Only a few journal articles in the Scopus index were also included in the Altmetric.com database. Thus, the visibility and impact of the PLAAS grey literature is largely unknown at this stage. There are data available from Google Analytics and the Twitter and Facebook APIs at article level, but these data are scattered and difficult to access. Moreover, other indicators that could contribute to measuring impact are not readily available, such as citations and use by policy documents.
The potential for altmetrics to be beneficial for PLAAS was demonstrated in the three case studies of PLAAS-published material. The high numbers of downloads and tweets, some citations and Facebook shares of the particular outputs show this potential. Much of the social media activity can be attributed to the campaigns or events that took place around these publications or by particular individuals using social media platforms such as Twitter extensively to discuss and disseminate the research.
The survey investigating the use of social media with respect to research outputs by PLAAS researchers showed that the majority of the researchers are unaware of the social media tools and platforms that could be used to increase the visibility of their research. They do not prioritise the use of social media in their research activities even if they see it as potentially beneficial. This finding is consistent with the low coverage of PLAAS outputs by altmetrics.
In terms of visibility and impact, we have demonstrated that the use of bibliometric and altmetric analyses which make use of a variety of sources can yield a rich picture of research output and significance, providing insight into scholarly communication at a research unit such as PLAAS. The application of this research design in other research units and departments at UWC can generate results that could be useful to research management at UWC.
PLAAS is a reputable institute which produces a high volume of research on important and contentious issues in South Africa. PLAAS researchers participate in high-level government forums, for instance Prof. Hall is on the advisory panel appointed in 2018 by President Ramaphosa working towards practical implementation of the redistribution of land. It would be worth investigating ways in which to increase the visibility and impact of this work, thus ensuring its application to serious policy debates around land reform in the country. Some practical recommendations for improving visibility include:
•using unique identifiers such as DOIs for all publications and ORCIDs for all authors;
• promoting open access publishing by contributing to relevant repositories, and by publishing in suitable open access journals;
• becoming familiar with social media tools and platforms and how their use can benefit research activity for the Institute and individual researchers; and
• improving and maintaining Google Scholar profiles in order to keep them current and accurate as a source of publication and citation counts.
Acknowledgements
This work is based on research funded by the National Research Foundation of South Africa. We thank the Institute for Poverty, Land and Agrarian Studies at the University of the Western Cape for the contribution of information provided for the development of this study.
Authors' contributions
G.K.: conceptualisation, methodology, data collection, data analysis, writing the initial draft and revisions. M.K.: conceptualisation, methodology, writing - revisions, student supervision. M.N.: conceptualisation, methodology, writing - revisions, student supervision, funding acquisition.
References
1.Pouris A. South Africa's research publication record: The last ten years. S Afr J Sci. 2003;99(9/10):425-428. [ Links ]
2.Van Leeuwen T. Measuring research: What everyone needs to know. J Informetr. 2018;12(4):1232-1234. http://dx.doi.org/10.1016/j.joi.2018.08.010 [ Links ]
3.Gingras Y. Bibliometrics and research evaluation: An overview [document on the Internet]. c2011 [cited 2018 Feb 21]. Available from: https://issek.hse.ru/data/2011/05/30/1212612098/Bibliometrics-Evaluation.Intro.pdf [ Links ]
4.Lundberg J. Bibliometrics as a research assessment tool - impact beyond the impact factor [thesis]. Stockholm: Karolinska Institutet; 2006 [cited 2016 Apr 02]. Available from: https://openarchive.ki.se/xmlui/handle/10616/39489 [ Links ]
5.Ebrahimy S, Setareh F. Direct and indirect influence of altmetrics on citation in social systems: Assessing a new conceptual model. Int J Inform Sci Manage. 2018;16(2):161-173. Available from: https://ijism.ricest.ac.ir/index.php/ijism/article/view/1277 [ Links ]
6.Groos O, Pritchard A. Documentation notes. J Doc. 1969;25(4):344-349. https://doi.org/10.1108/eb026482 [ Links ]
7.Gorraiz J, Wieland M, Gumpenberger C. Individual bibliometric assessment @ University of Vienna: From numbers to multidimensional profiles [article on the Internet]. c2016 [cited 2016 Jun 05]. Available from: https://arxiv.org/ftp/arxiv/papers/1601/1601.08049.pdf [ Links ]
8.Borgman CL. Digital libraries and the continuum of scholarly communication. J Doc. 2000;56(4):412-430. http://dx.doi.org/10.1108/EUM0000000007121 [ Links ]
9.ACRL Scholarly Communications Committee. Principles and strategies for the reform of scholarly communication 1 [article on the Internet]. Chicago, IL: Association of College and Research Libraries (ACRL); c2003 [cited 2016 May 09]. Available from: http://www.ala.org/acrl/publications/whitepapers/principlesstrategies [ Links ]
10.Barjak F. The role of the Internet in informal scholarly communication. J Am Soc Inf Sci Technol. 2006;57(10):1350-1367. https://doi.org/10.1002/asi.20454 [ Links ]
11.Borgman CL, Furner J. Scholarly communication and bibliometrics [article on the Internet]. Medford, NJ: ARIST. c2002 [cited 2016 Mar 28]. Available from: http://works.bepress.com/furner/1/ [ Links ]
12.Czerniewicz L. Power and politics in a changing scholarly communication landscape. Paper 23. In: Proceedings of the International Association of Scientific and Technological University Libraries Conferences; 2013 April 14-18; Cape Town, South Africa. West Lafayette, IN: IATUL, Purdue University; 2013. Available from: http://docs.lib.purdue.edu/cgi/viewcontent.cgi?article=1982&context=iatul [ Links ]
13.Haustein S, Sugimoto C, Larivière V. Guest editorial: Social media in scholarly communication. Aslib J Inform Manage. 2015;67(3). https://doi.org/10.1108/AJIM-03-2015-0047 [ Links ]
14.Liu Z. Trends in transforming scholarly communication and their implications. Inf Process Manag. 2003;39(6):889-898. https://doi.org/10.1016/S0306-4573(02)00057-2 [ Links ]
15.Maron NL, Smith, KK. Current models of digital scholarly communication results of an investigation conducted by Ithaka for the Association of Research Libraries [article on the Internet]. Washington DC: Association of Research Libraries; 2008 [cited 2016 Feb 21]. Available from: https://www.arl.org/resources/current-models-of-digital-scholarly-communication-results-of-an-investigation-conducted-by-ithaka-for-the-association-of-research-libraries/ [ Links ]
16.Van de Sompel H, Payette S, Erickson J, Lagoze C, Warner S. Rethinking scholarly communication: Building the system that scholars deserve. D-Lib Magazine. 2004 September. Available from: http://www.dlib.org/dlib/september04/vandesompel/09vandesompel.html [ Links ]
17.Mukherjee B, Subotić S, Chaubey AK. And now for something completely different: The congruence of the Altmetric Attention Score's structure between different article groups. Scientometrics. 2018;114(1):253-275. https://doi.org/10.1007/s11192-017-2559-8 [ Links ]
18.Czerniewicz L, Kell C, Willmers M, King T. Changing research communication practices and open scholarship: A framework for analysis [article on the Internet]. Cape Town: Scholarly Communication in Africa Programme; 2014 [cited 2017 Mar 10]. Available from: https://open.uct.ac.za/bitstream/item/9250/SCAP_Czerniewicz_ ChangingResearchOpenScholarship_2014.pdf?sequence=1 [ Links ]
19.Erdt M, Nagarajan A, Sin S-CJ, Theng Y-L. Altmetrics: An analysis of the state-of-the-art in measuring research impact on social media. Scientometrics. 2016;109(2):1117-1166. https://doi.org/10.1007/s11192-016-2077-0 [ Links ]
20.Holmberg K, Vainio J. Why do some research articles receive more online attention and higher altmetrics? Reasons for online success according to the authors. Scientometrics. 2018;116(1):435-447. https://doi.org/10.1007/s11192-018-2710-1 [ Links ]
21.Bornmann L, Haunschild R, Adams J. Convergent validity of altmetrics and case studies for assessing societal impact: An analysis based on UK Research Excellence Framework (REF) data [article on the Internet]. c2018 [cited 2018 Oct 21]. Available from: https://figshare.com/articles/Convergent_validity_of_altmetrics_and_case_studies_for_assessing_ societal_impact_an_analysis_based_on_UK_Research_Excellence_Framework_REF_data/7165333 [ Links ]
22.Roemer RC, Borchardt R. Meaningful metrics: A 21st-century librarian's guide to bibliometrics, altmetrics and research impact. Chicago, IL: Association of College and Research Libraries; 2015. [ Links ]
23.Sutton S. Altmetrics: What good are they to academic libraries? CULS Proceedings. 2014;4(2). https://doi.org/10.4148/2160-942X.1041 [ Links ]
24.The Institute for Poverty, Land and Agrarian Studies (PLAAS). History [webpage on the Internet]. No date [cited 2016 Jun 06]. Available from: http://www.plaas.org.za/history [ Links ]
25.Tran C, Aytac S. Measuring scholarly productivity of Long Island educational institutions: Using Web of Science and Scopus as a tool. Evid Based Libr Inf Pract. 2016;11(3):16-33. https://doi.org/10.18438/B8JS8P [ Links ]
26.Kahn M. A bibliometric analysis of South Africa's scientific outputs - some trends and implications. S Afr J Sci. 2011;107(1/2), Art. #406, 6 pages. https://doi.org/10.4102/sajs.v107i1/2.406 [ Links ]
27.Rotich DC, Onyancha OB. Trends and patterns of medical and health research at Moi University, Kenya, between 2002 and 2014: An informetrics study. S Afr J Libr Inf Sci. 2017;82(2):20-33. https://doi.org/10.7553/82-2-1626 [ Links ]
28.Moed HF, Halevi G. Multidimensional assessment of scholarly research impact. J Assoc Inf Sci Technol. 2015;66(10):1988-2002. https://doi.org/10.1002/asi.23314 [ Links ]
29.NISO Altmetrics Initiative Working Group A. Altmetrics definitions and use cases. Draft for public comment. Report no. NISO RP-25-201x-1 [document on the Internet]. Baltimore, MD: NISO; 2016 [cited 2016 Apr 17]. Available from: http://www.niso.org/apps/group_public/download.php/16268/NISO%20RP-25-201x-1%2C%20Altmetrics%20Definitions%20and%20Use%20Cases%20-%20draft%20for%20public%20comment.pdf [ Links ]
30.Holmberg K. Classifying altmetrics by level of impact. In: Salah AA, Tonta Y, Salah AAA, Sugimoto C, Al U, editors. Proceedings of the 15th International Society for Scientometrics and Informetrics Conference; 2015 July 03 - June 29; Istanbul, Turkey. Leuven: ISSI; 2015. p. 101-102. Available from: https://pdfs.semanticscholar.org/49df/91ccd2579b4b345c135a6ff751bf39f7ee86.pdf [ Links ]
31.Onyancha OB, Ocholla DN. Assessing researchers' performance in developing countries: Is Google Scholar an alternative? [article on the Internet]. Mousaion. 2009;27(1):43-64. [cited 2017 Feb 01]. Available from: https://www.researchgate.net/publication/228911588_Assessing_researchers'_performance _in_developing_countries_is_Google_Scholar_an_alternative [ Links ]
32.Castillo M. Measuring academic output: The h-index. AJNR Am J Neuroradiol. 2010;31(5):783-784. https://doi.org/10.3174/ajnr.A1888 [ Links ]
33.Hirsch JE. An index to quantify an individual's scientific research output. Proc Natl Acad Sci USA. 2005;102(46):16569-16572. https://doi.org/10.1073/pnas.0507655102 [ Links ]
34.Haustein S, Larivière V. The use of bibliometrics for assessing research: Possibilities, limitations and adverse effects. In: Welpe IM, Wollersheim J, Ringelhan S, Osterloh M, editors. Incentives and performance: Governance of knowledge-intensive organizations. Cham: Springer International Publishing; 2015. p. 121-139. [ Links ]
35.Peters I, Kraker P, Lex E, Gumpenberger C. Research data explored: Citations versus altmetrics. In: Salah AA, Tonta Y, Salah AAA, Sugimoto C, Al U, editors. Proceedings of the 15th International Society for Scientometrics and Informetrics Conference; 2015 July 03 - June 29; Istanbul, Turkey. Leuven: ISSI; 2015 [cited 2016 Apr 17]. Available from: https://arxiv.org/abs/1501.03342 [ Links ]
36.Araújo RF, Murakam TRM, De Lara JL, Fausto S. Does the Global South have altmetrics? Analyzing a Brazilian LIS journal. In: Salah AA, Tonta Y, Salah AAA, Sugimoto C, Al U, editors. Proceedings of the 15th International Society for Scientometrics and Informetrics Conference; 2015 July 03 - June 29; Istanbul, Turkey. Leuven: ISSI; 2015 [cited 2016 Apr 17]. Available from: https://pdfs.semanticscholar.org/5859/d62b55e76d906c84401254172ff96545fc49.pdf [ Links ]
37.Torres-Salinas D, Robinson-Garcia N, Jiménez-Contreras E. Can we use altmetrics at the institutional level? A case study analysing the coverage by research areas of four Spanish universities. In: Proceedings of the 21st International Conference on Science and Technology Indicators; 2016 September 14-16; Vienna, Austria [cited 2016 Jun 04]. Available from: https://arxiv.org/ftp/arxiv/papers/1606/1606.00232.pdf [ Links ]
38.An introduction to altmetric data - what can you see? [webpage on the Internet]. The Source. 2015 August 13 [cited 2017 Mar 05]. Available from: http://www.springersource.com/an-introduction-to-altmetric-data-what-can-you-see/ [ Links ]
 Correspondence:
Gillian Kerchhoff
Email: gillker@iafrica.com
Received: 08 Oct. 2018
Revised: 13 Feb. 2019
Accepted: 05 Mar. 2019
Published: 30 July 2019
EDITORS: John Butler-Adam , Maitumeleng Nthontho
FUNDING:National Research Foundation (South Africa)

