


Serviços Personalizados
Artigo
 Inglês (pdf)
 Artigo em XML
 Referências do artigo
Indicadores

Links relacionados
-
 Citado por Google
 -
 Similares em Google
Compartilhar

 Permalink
South African Journal of Science
versão On-line ISSN 1996-7489
versão impressa ISSN 0038-2353
S. Afr. j. sci. vol.115 no.5-6 Pretoria Mai./Jun. 2019
http://dx.doi.org/10.17159/sajs.2019/4846
RESEARCH ARTICLES
Historical and projected trends in near-surface temperature indices for 22 locations in South Africa
Andries C. KrugerI, II; Hannes RautenbachIII, IV; Sifiso MbathaI; Sandile NgwenyaI; Thabo E. MakgoaleIII
IClimate Service, South African Weather Service, Pretoria, South Africa
IIDepartment of Geography, Geoinformatics and Meteorology, University of Pretoria, Pretoria, South Africa
IIIResearch and Development, South African Weather Service, Pretoria, South Africa
IVSchool of Health Systems and Public Health, University of Pretoria, Pretoria, South Africa
ABSTRACT
Motivated by the risks posed by global warming, historical trends and future projections of near-surface temperature in South Africa have been investigated in a number of previous studies. These studies included the assessment of trends in average temperatures as well as extremes. In this study, historical trends in near-surface minimum and maximum temperatures as well as extreme temperature indices in South Africa were critically investigated by comparing quality-controlled station observations with downscaled model projections. Because climate models are the only means of generating future global warming projections, this critical point comparison between observed and downscaled model simulated time series can provide valuable information regarding the interpretation of model-generated projections. Over the historical 1951-2005 period, both observed data and downscaled model projections were compared at 22 point locations in South Africa. An analysis of model projection trends was conducted over the period 2006-2095. The results from the historical analysis show that model outputs tend to simulate the historical trends well for annual means of daily maximum and minimum temperatures. However, noteworthy discrepancies exist in the assessment of temperature extremes. While both the historical model simulations and observations show a general warming trend in the extreme indices, the observational data show appreciably more spatial and temporal variability. On the other hand, model projections for the period 2006-2095 show that for the medium-to-low concentration Representative Concentration Pathway (RCP) 4.5, the projected decrease in cold nights is not as strong as is the case for the historically observed trends. However, the upward trends in warm nights for both the RCP4.5 and the high concentration RCP8.5 pathways are noticeably stronger than the historically observed trends. For cool days, future projections are comparable to the historically observed trends, but for hot days noticeably higher. Decreases in cold spells and increases in warm spells are expected to continue in future, with relatively strong positive trends on a regional basis. It is shown that projected trends are not expected to be constant into the future, in particular trends generated from the RCP8.5 pathway that show a strong increase in warming towards the end of the projection period.
SIGNIFICANCE:
• Comparison between the observed and simulated trends emphasises the necessity to assess the reliability of the output of climate models which have a bearing on the credibility of projections.
• The limitation of the models to adequately simulate the climate extremes, renders the projections conservative, which is an important result in the light of climate change adaptation.
Keywords: surface temperature; temperature trends; model projections; climate extremes
Introduction
Background
Global warming, as a result of increased concentrations of greenhouse gases (GHGs), poses a considerable risk to a sustainable present climate regime. In this context, a number of studies have previously been conducted to investigate historical trends in near-surface temperatures in South Africa, including extremes.1-4 Most of these studies agree - indicating a general, but spatially variable, warming over recent decades. Mean temperatures show trends of less than 0.04 °C/decade for some stations in the interior, but higher than 0.20 °C/decade in the southwestern and northeastern parts of the country. Trends in temperature extremes also reflect warming, also with stronger warming in the southwest and northeast.1
A number of modelling studies have already been conducted to identify the most possible future near-surface temperature scenarios over southern Africa5-8, e.g. the Climate Change Reference Atlas produced in 2017 by the South African Weather Service, with support from the South African Water Research Commission (available online at www.weathersa.co.za/climate/climate-change-reference-atlas). The latter is based on previous dynamical downscaling modelling done under the auspices of the Coordinated Regional-climate Downscaling Experiment (CORDEX).9 The simulations of nine coupled Atmosphere-Ocean General Circulation Models (AOGCMs), which were included in the Inter-Governmental Panel on Climate Change (IPCC) Fifth Assessment Report (AR5)10, were used as inputs for a 1951-2095 simulation downscaled to a resolution of 0.4° x 0.4° using the Rossby Centre Regional Model Version 4 (RCA4) regional climate model (RCM)11. The main parts of the publication considered in this study are future projections of the average near-surface temperature for two 30-year periods, i.e. 2036-2065 and 2066-2095.
In the light of observed global warming as a result of increased concentrations of GHGs, various future GHG concentration based projections have been produced, known as Representative Concentration Pathways (RCPs).10 These RCPs have been defined according to the anthropogenic contribution to atmospheric radiative forcing projected for the year 2100 as a result of the projected increases in GHGs. The medium-to-low concentration RCP4.5 (a pathway that stabilises radiative forcing at 4.5 W/m2 in 2100 without ever exceeding that value) and the high concentration RCP8.5 (which projects a radiative forcing of 8.5 W/m2 in 2100 - also known as 'business as usual') GHG projections are the most commonly used in climate change projections and were also used in this study12.
Assessment of agreement between model simulations and observed trends
The availability of both observed and climate change simulated near-surface temperature data provide the opportunity to validate the consistencies of model simulated trends against the associated observed trends. Such an analysis could create a better understanding of how to eventually interpret future projections.
Regional climate model outputs contain systematic errors (also known as biases) when compared to observations. It is therefore not advisable to use raw climate change projection data, but rather to express change in terms of future anomalies relative to the historically simulated climate. In the case in which change in actual values is required, an assessment of the historical performance of the model output becomes essential, and if needed, the calibration of the model output through the application of bias correction methods.13,14 Systematic errors or biases generated by climate models can be determined through a model evaluation process, i.e. an assessment of inconsistencies between historically simulated results and the associated observations, e.g. the CMIP5 model evaluation exercise for Australia15, and the comparison study between regional climate model simulations of daily near-surface temperatures and observations16. In general, biases in climate model outputs can greatly affect the estimation of the future effects of climate change in climate-reliant sectors, such as agriculture17, if not adequately addressed.
It is also important to consider that an acceleration in future surface temperature trends is highly possible, primarily as a result of a projected acceleration in future GHG emissions. The concentration of CO2 has increased from its pre-industrial levels of about 280 ppm in the 1880s to 395 ppm recently18, while the RCP4.5 pathway considers an increase to 560 ppm by 2100.
In this paper, we aim to provide insight into systematic biases or errors between CORDEX model simulated and observed daily maximum and minimum temperatures at 22 locations in South Africa, over the period 1951-2005. Despite differences in the internal variability between model and observations, which influences the degree of correspondence with observations19, the period over which the comparisons are made in this study is deemed sufficiently long to compare long-term trends. In addition, trends in temperature extremes according to the indices developed by the Expert Team on Climate Change Detection and Indices (ETCCDI)20 are considered in the analysis.
Data and methods
Near-surface temperature data
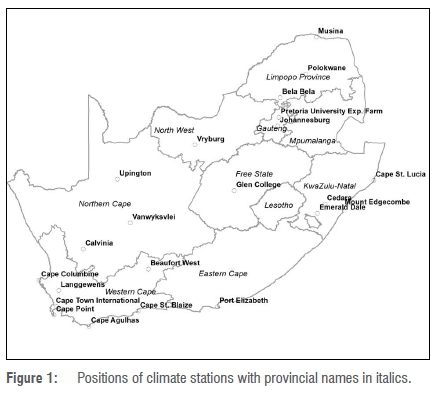
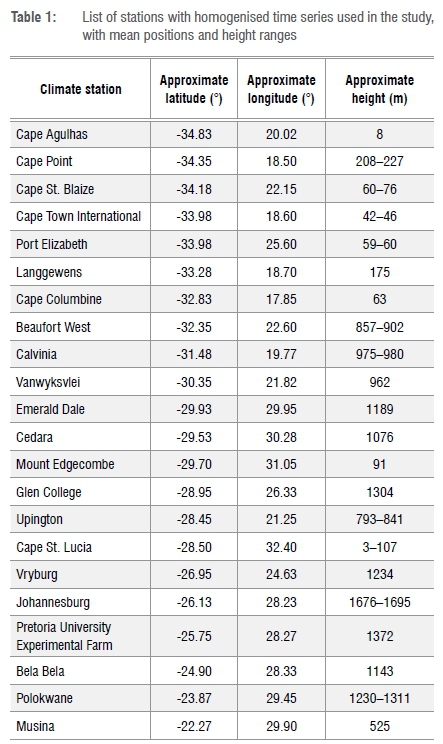
Homogenised daily near-surface temperature data, recorded at 22 climate stations in South Africa (Figure 1) over the period 1951-2005, were used for the comparison between trends in the observed and associated model data, to quantify systematic errors in the model output for both the multi-model mean (mmm) and each of the nine model ensemble members. The measured temperature data, presented in Table 1, is a subset of the data used in the study by Kruger and Nxumalo1, and underwent a thorough process of quality control and subsequent homogenisation to be deemed sufficiently reliable to use for the estimation of historical long-term temperature trends in South Africa.
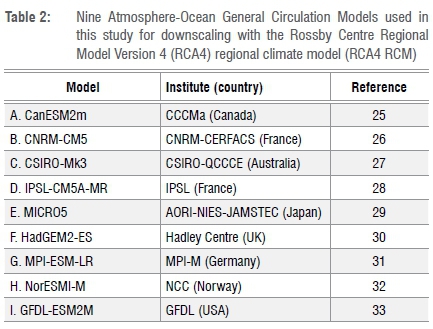
The RCA4 RCM11 ensemble member data comprise daily maximum and minimum near-surface temperature values generated by forcing the RCM across its lateral boundaries by output from nine AOGCMs (see Table 2) over the historical period 1951-2005 (representative of observed atmospheric composition and variability), and the future period 2006-2095 (representative of responses as a result of RCP4.5 and RCP8.5 GHG increases). In the CORDEX-Africa simulations, AOGCM output fields were dynamically downscaled to a resolution of 0.44° x 0.44°. From the grid of the RCA4 model output, the values at the positions of the 22 observation stations were estimated using a trigonometrical estimation method, to coincide as closely as possible with the positions at which the measurements were made.
The model outputs were not bias-adjusted. While bias-adjustment has a large effect on modelled trends of absolute-threshold indices, it is found not to be the case for percentile-based indices21, on which the extreme temperature trend analysis is focused in this paper.
Extreme near-surface temperature indices
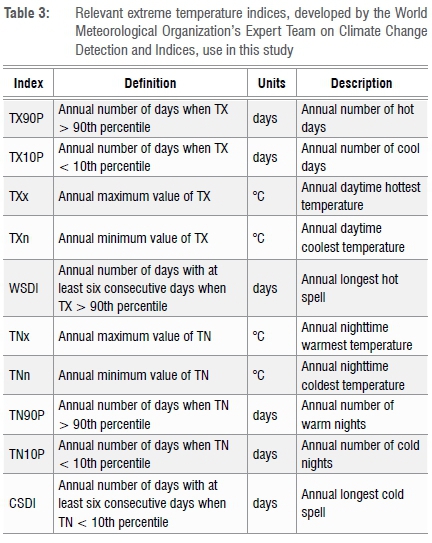
Ten relevant maximum and minimum extreme temperature indices, as developed by the ETCCDI22 and listed in Table 3, were considered. As demonstrated in previous studies1,3, some of the ETCCDI indices cannot be deemed to be wholly relevant to the South African climate. Particularly, some of the absolute-threshold indices were omitted as the index values from different locations in South Africa are not directly comparable, because of the country's complex climate23, but also because of the possible bias in the model outputs21.
Trend analysis
For historical average minimum and maximum temperatures, trends in the time series of the observed data were compared to the nine RCM ensemble member data time series, to identify any consistent biases in individual ensemble members. For the extreme temperature indices, the trend results of the observed and the mmm were compared. All the estimated trend values are linear and the statistical significance is based on the t-test at the 5% level. Firstly, the correlation coefficient R was calculated. To establish whether the value of the correlation coefficient is significant, the test statistic was calculated:
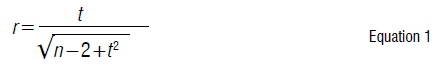
where n is the number of pairs of observations/measurements and t is the value in the t-table corresponding with the selected level of significance. If R>r then R is statistically significant at the selected level of significance, in this case 5%. It can be shown that with statistical testing of historical climate trends, little difference in results is found between when linearity is assumed and when not.
Results
An initial screening of the RCA4 RCM output shows projected deviations (2036-2065 minus 1976-2005 averages) in the near-surface temperature median, under conditions of the RCP4.5 pathway, to be between +1 °C and +1.5 °C for the South African coastal regions, +1.5 °C and +2 °C for most of the interior, and +2 °C and +2.5 °C in isolated parts in the northwestern interior. An increase of +1.5 °C to +2 °C over a 60-year period equates to about +0.25-0.35 °C/decade, substantially higher than the observed historical trends, which vary to a maximum of just over +2 °C/decade.1 Furthermore, model results from the RCP4.5 pathway for 2066-2085 show an acceleration of trend for most of South Africa of about +0.25-0.35 °C/decade, but +0.3-1 °C/decade in the northwestern parts. For the RCP8.5 pathway, temperature trends are, as expected, much stronger, with most of South Africa experiencing a mean temperature increase of about +2 °C to +3 °C in 2036-2065, compared to 1976-2005, equating to a trend in excess of +0.3 °C/decade.
Historical trends (1951-2005)
Annual average minimum and maximum temperatures
On average, the RCMs underestimate the observed annual average minimum temperature trends by about 0.05 °C/decade, compared to the observations (Table 4). While the average RCM trends range from +0.10 to +0.16 °C/decade, the range in trends in the observed time series is much larger, from insignificantly small to very large trends of more than +0.4 °C/decade. It can be argued that in some, but not all, cases of large positive trends, urbanisation might have played a role, e.g. Pretoria1.
For the annual average maximum temperature, there is on average little difference between the trends captured by the RCM (+0.12 °C/decade) and the observations (+0.14 °C/decade). However, on closer inspection, as with the minimum temperature, the range of the RCM average trend (+0.09 to +0.17 °C/decade) is much smaller than that of the observed trend (-0.12 to +0.36 °C/decade).
The annual average temperatures also show the range of the RCM trends (+0.10 to +0.15 °C/decade) to be much smaller than those of the associated observed trends (-0.02 to +0.38 °C/decade). The results indicate that no RCM ensemble member consistently simulates the observed trends better than others. It is also noteworthy that the RCM ensemble members are mostly unable to simulate strong observed warming trends. The models that in general simulate localised strong warming better, do not perform as well in those areas with less observed warming, e.g. the central interior of South Africa.2,3
ETCCDI index trends
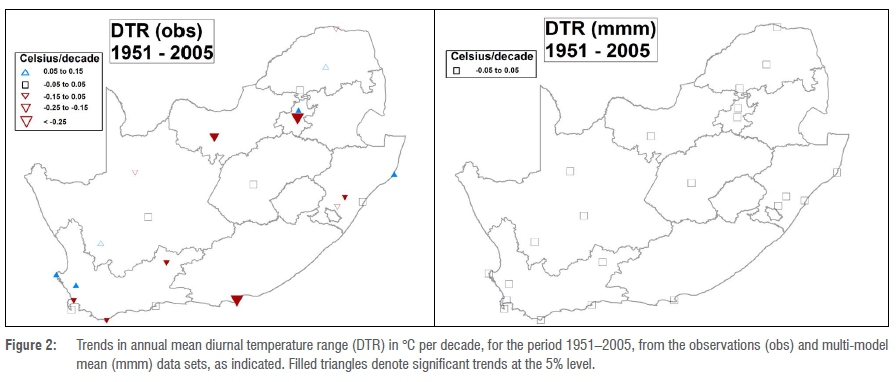
Diurnal temperature range
The differences in diurnal temperature range between the observations (obs) and mmm are apparent, in that for the mmm very small trends are shown, which are not statistically significant (Figure 2). In contrast, the obs show highly variable results, both in space and magnitude, which vary from negative trends less than -0.25 °C/decade to small positive trends up to +0.15 °C/decade. The observed trend magnitudes vary over relatively short distances, which could indicate influences of local or microscale effects on the change in differences between minimum and maximum temperatures.
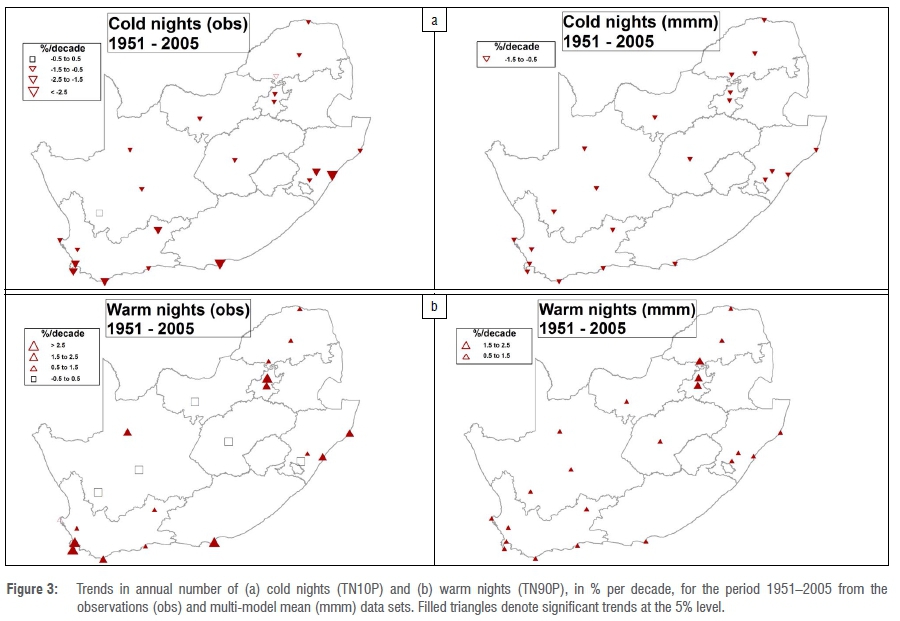
Cold and warm nights
Both the obs and mmm show the number of cold nights decreasing (Figure 3a). Evident from the obs are larger decreases in the number of cold nights along the coastal regions (mostly <-2.5%/decade) compared to the interior (mostly -1.5 to -0.5%/decade). With the exception of Calvinia (Western Cape Province), all observed cold night trends were significantly negative. The mmm shows more consistent trends, at all locations in the range -1.5 to -0.5%/decade.
Trends in warm nights (Figure 3b) show larger spatial variation of warming in comparison to cold nights. For the obs, most stations in the central interior of the country show non-significant trends but, as is the case for cold nights, signs of stronger warming along the coast and in the Gauteng Province area. Similarly to cold nights, the mmm shows more consistent trends (+0.5 to +0.15%/decade) for most stations but, as is the case for the observations, stronger trends around the Gauteng Province (+1.5 to +2.5%/decade).
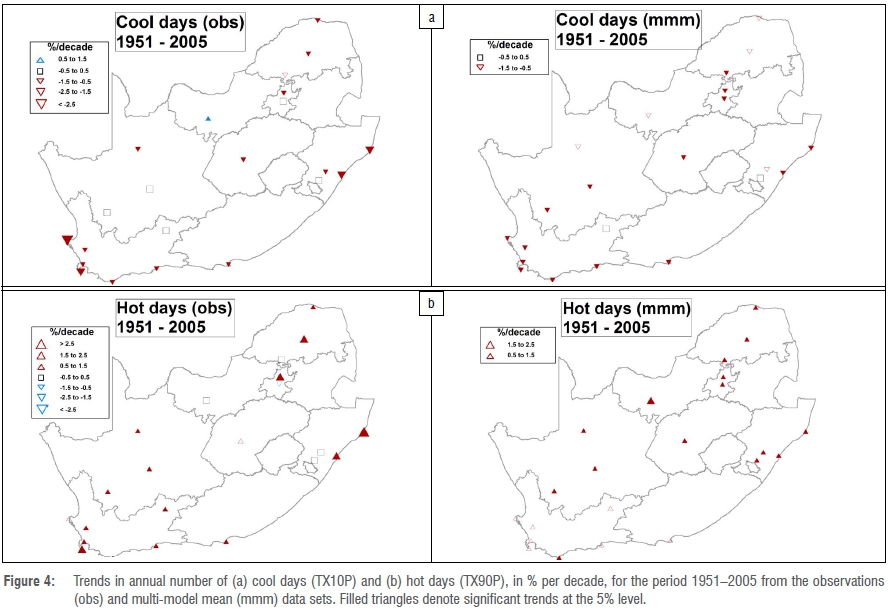
Cool and hot days
Figure 4a presents the trends in cool days. A general decrease in the number of cool days is observed, but with a stronger decrease at some of the coastal stations with trends lower than -1.5%/decade. In contrast, some stations in the southern interior show almost no observed trend. For the mmm, the trends are again, as in the discussion in the previous section, spatially more consistent, mostly in the order of -0.5 to -1.5%/decade.
The trend results for the number of hot days (Figure 4b) indicate general increases, but again the obs results are spatially more variable, with trend magnitudes ranging from negative to greater than +2.5%/decade. For the mmm, most locations show statistically significant trends of +0.5 to +1.5%/decade.
Extreme minimum and maximum temperatures
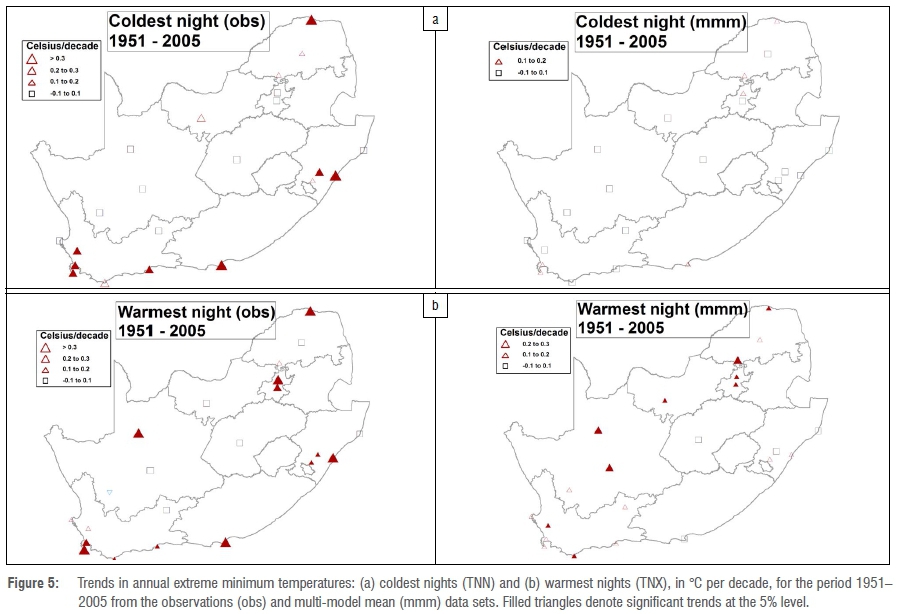
Most previous studies have shown that long-term trends of annual extreme minimum and maximum temperatures are mostly not significant, and vary spatially relatively more than the extreme indices that are not based on only one value per year.1,3 For the coldest night (Figure 5a) it is, however, noticeable that for the obs most coastal stations show relatively large positive trends, mostly greater than +0.2 °C/decade. In contrast, all locations from the mmm results show small non-significant trends of -0.1 to +0.1 °C/decade.
For the obs, trends in warmest nights (Figure 5b) are mostly small and non-significant, but significantly positive trends are shown mostly along the coast and the Gauteng Province. This is, however, not the case for the mmm, for which most significant trends are in the central to northwestern interior and Gauteng.
Extreme maximum temperatures, indicated by the hottest and coldest day indices (not shown), show consistently small trends, mostly increases, for the mmm. However, for the obs, while the results are mostly statistically insignificant, four stations show significant warming for both the hottest and coldest day indices.
Cold and warm spells
It is evident that cold spells in general decreased over the analysis period. Significant decreases are isolated in the northern parts of South Africa, both for the obs and mmm. In contrast, general increases in warm spells are found. For the obs, most stations in the western half of the country show significant increases. For the mmm, in contrast, the significant increases are found in the northern and northeastern interior.
Future trends (2006-2095)
In this section the results of the RCM generated trends of the ETCCDI indices over the period 2006-2095, under conditions of the RCP4.5 and RCP8.5 pathways, are compared, with warming trends expected to be stronger under RCP8.5 than under RCP4.5.
Diurnal temperature range
The trends of diurnal temperature range under RCP4.5 are almost zero, similarly with the historical RCM trends. However, in the case of RCP8.5, some stations show significant, albeit very small, positive trends in the interior and negative trends for two of the coastal stations.
Cold and warm nights
Figure 6 presents the future trends in the number of cold nights under RCP4.5 and RCP8.5 conditions. Both pathways show a general warming trend, with the number of cold nights decreasing. While the RCP4.5 pathway shows trends of -0.5 to -1.5%/decade, and non-significant trends for some stations in the interior, the RCP8.5 pathway shows trends of -1.5 to -2.5%/decade, which are statistically significant at all locations.
Trends in warm nights (not shown) for the RCP4.5 conditions indicate increases in the number of warm nights from just over +1%/decade to more than +2.5%/decade, with the amount of warming unevenly distributed across the country. The RCP8.5 pathway shows trends in excess of +2.5%/decade for all stations.
Cool and hot days
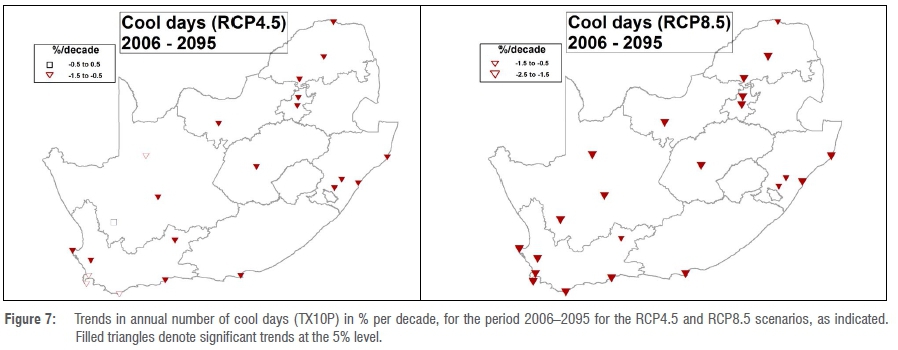
A general decrease in the number of cool days is observed (Figure 7a) for most stations of -1.5 to -0.5%/decade under conditions of the RCP4.5 pathway and mostly -1.5 to -2.5%/decade under RCP8.5.
The trend results for hot days (not shown) indicate generally stronger warming than with cool days, with most stations in the interior under RCP4.5 showing increases of +1.5 to +2.5%/decade, and under RCP8.5 in excess of +2.5%/decade.
Extreme minimum and maximum temperatures
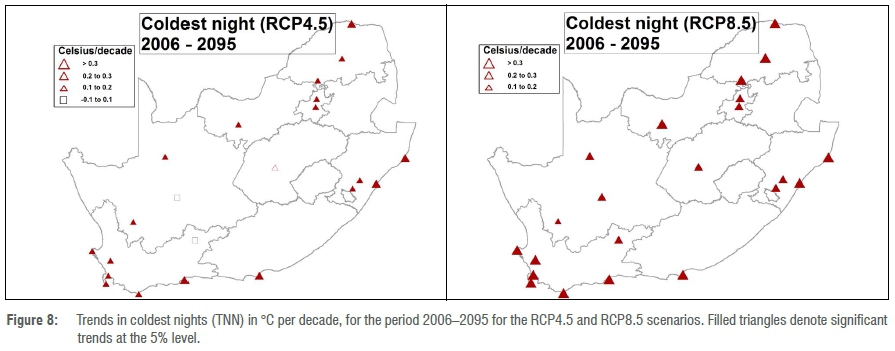
Trends in the coldest night of the year (Figure 8) under RCP4.5 conditions are non-significant at some locations in the interior, to more than +0.3 °C/decade along the south and east coasts and the far north at Musina (Limpopo Province). Under RCP8.5, trends are also lower in the interior, but mostly +0.1 to +0.2 °C/decade, and higher than +0.3 °C/decade along the coast and northern interior.
For the warmest night of the year (not shown), the northern half of the country shows significant trends of higher than +0.2 °C/decade and +0.3 °C/decade under RCP4.5 and RCP8.5 conditions, respectively.
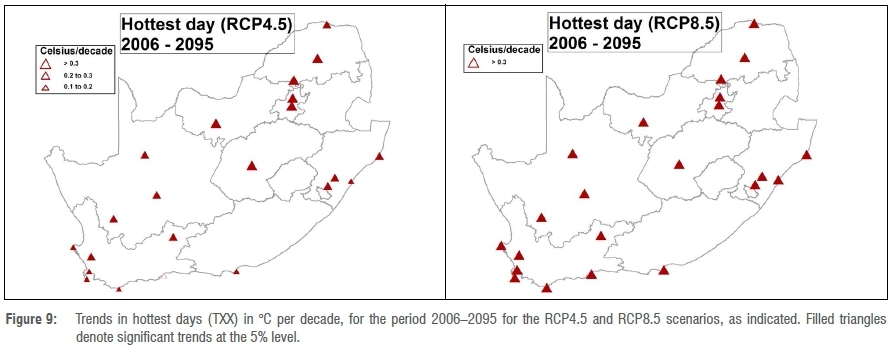
For the hottest day of the year, trends from just higher than +1 °C/decade are shown in the south to more than +0.3 °C/decade in the north (Figure 9) under RCP4.5. Under RCP8.5, all stations show trends higher than +0.3 °C/decade.
Trends in the coldest day are somewhat lower than those for the hottest day under RCP4.5, but for RCP8.5 are still higher than +0.3 °C/decade for all stations.
Cold and warm spells
General increases in warm spells are evident, but less so in the southeast of the country. Most stations in the remainder of the country show trends of more than +0.6 days/decade under RCP4.5 conditions. Except for the south coast, all stations showed trends in warm spells in excess of +0.6 days/decade.
The results for the future trends in cold spells are spatially quite variable under RCP4.5 conditions. However, under RCP8.5, a picture emerges in which decreases in cold spells are more pronounced in the central and northern parts (decreases lower than -6 days/decade).
Discussion and conclusion
The impact of present and future global warming on South African near-surface temperatures has been investigated by conducting a detailed and critical point station analysis on climate change model performance and projections. Overall, the results from both station observations and RCM-generated mmm confirm the findings of previous studies that over recent decades significant warming took place in most of South Africa.1,2 The results generated by the RCA4 RCM downscaling largely confirm findings from observed temperature data analyses. However, it is apparent that the mmm trend exhibits less variability, both spatially and in magnitude. Here it should be emphasised that the RCM outputs do not reflect the exact interannual variability of the observed climate, but rather reflect the general state of the climate over an extended period, and more efficiently so over longer periods. Despite this, the RCM outputs were still able to reflect the general climatic trend over the 1951-2005 historical period of analysis. For the annual means of the maximum and minimum temperatures, and the mean thereof, the mmm show for all three cases, average trends very close to the trends from the observed data. One can infer that the general difference between obs and mmm results is that the mmm is not able to simulate larger trends effectively. There can be various causes for this ineffectiveness, e.g. the length of the analysis period and urbanisation, which is not considered in the modelling.
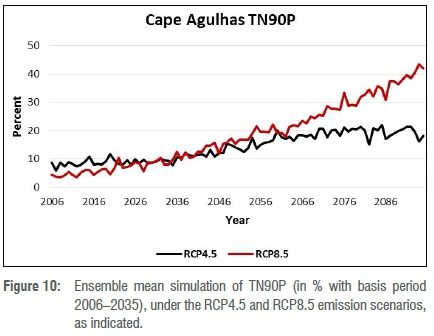
As expected, modelled trends under RCP8.5 show stronger warming than under RCP4.5, and for both pathways the warming trends in extreme temperatures are on average stronger than the historical trends. Here it is interesting to note the temporal constancy of the modelled future trends. The general result for all stations and extreme value indices is illustrated here with Figure 10, which presents the ensemble mean projection of the TN90P index at Cape Agulhas. Under RCP8.5, one can clearly see an acceleration of trend, especially in the second half of the future period, while the trend under RCP4.5 shows more constancy. It would seem that similar near-linear trends for both pathways can be assumed for the next few decades, but a second-order polynomial is probably a more realistic way to represent the index trends in the far-future under RCP8.5.
Other studies, e.g. Ringard et al. for West Africa24, indicate similarities in trends in extreme temperatures between observations and simulations and an acceleration of the trend thereafter. For the higher RCP pathways, the trends tend to remain similar throughout the 21st century with little indications of decrease. We have found similar results in that, for the RCP4.5 pathway, warming trends tend to be close to constant and near linear. However, the RCP8.5 pathway indicates a future scenario in which the increase in surface temperatures, including extremes, accelerates, and therefore a simple linear trend will not represent these trends in a realistic manner.
Acknowledgements
We acknowledge the CORDEX model downscaling project for the use of the daily model simulations. We also thank the anonymous reviewers who contributed to the improvement of the manuscript.
Authors' contributions
A.C.K. did most of the conceptualisation, developed the methodology, mapped the results and wrote the first draft of the manuscript. J.C.d.W.R. did the extraction and formatting of the CORDEX model data time series and assisted with the conceptualisation of the research. S.M. and S.N. did the analyses of the historical and model time series, i.e. calculations of index values and trends. T.E.M. assisted with the background literature review, specifically that relevant to the analysis of CORDEX model data.
References
1.Kruger AC, Nxumalo M. Surface temperature trends from homogenized time series in South Africa: 1931-2015. Int J Climat. 2017;37(5):2364-2377. https://doi.org/10.1002/joc.4851 [ Links ]
2.MacKellar N, New M, Jack C. Observed and modelled trends for rain and temperature for South Africa: 1960-2010. S Afr J Sci. 2014;110(7/8), Art. #2013-0353, 13 pages. https://doi.org/10.1590/sajs.2014/20130353 [ Links ]
3.Kruger AC, Sekele SS. Trends in extreme temperature indices in South Africa: 1962-2009. Int J Climatol. 2012;33(3):661-676. https://doi.org/10.1002/joc.3455 [ Links ]
4.Kruger AC, Shongwe S. Temperature trends in South Africa: 1960-2003. Int J Climatol. 2004;24(15):1929-1945. https://doi.org/10.1002/joc.1096 [ Links ]
5.Laprise R, Hernández-Díaz L, Tete K, Sushama L, Šeparović L, Martynov A, et al. Climate projections over CORDEX Africa domain using the fifth-generation Canadian Regional Climate Model (CRCM5). Clim Dyn. 2013;41:3219-3246. https://doi.org/10.1007/s00382-012-1651-2 [ Links ]
6.Russo S, Marchese AF, Sillmann J, Immé G. When will unusual heat waves become normal in a warming Africa? Environ Res Lett. 2016;11, Art. #054016, 10 pages. https://doi.org/10.1088/1748-9326/11/5/054016 [ Links ]
7.Engelbrecht F, Adegoke J, Bopape MM, Naidoo M, Garland R, Thatcher M, et al. Projections of rapidly rising surface temperatures over Africa under low mitigation. Environ Res Lett. 2015. https://doi.org/10.1088/1748-9326/10/8/085004 [ Links ]
8.Landman WA, Engelbrecht FA, Hewitson B, Malherbe J, Van der Merwe J. Towards bridging the gap between climate change projections and maize producers in South Africa. Theor Appl Climatol. 2018;10, Art. #085004, 16 pages. https://doi.org/10.1007/s00704-017-2168-8 [ Links ]
9.Jones C, Giorgi F, Asrar G. The Coordinated Regional Downscaling Experiment (CORDEX). An international downscaling link to CMIP5. CLIVAR Exchanges. 2011;16:34-40. [ Links ]
10.Intergovernmental Panel on Climate Change (IPCC). Climate change 2013: The physical science basis. In: Stocker TF, Qin D, Plattner GK, Tignor M, Allen SK, Boschung J, et al., editors. Contribution of Working Group I to the Fifth Assessment Report of the Intergovernmental Panel on Climate Change. Cambridge, UK: Cambridge University Press; 2013. [ Links ]
11.Undén P, Rontu L, Jarvinen H, Lynch P, Calvo J, Cats G, et al. HIRLAM-5 scientific documentation. Norrkoping, Sweden: Swedish Meteorological and Hydrological Institute; 2002. [ Links ]
12.Riahi K, Roa S, Krey V, Cho C, Chirkov V, Fisher G, et al. RCP 8.5 - A scenario of comparatively high greenhouse gas emissions. Clim Change. 2011;109:33-57. https://doi.org/10.1007/s10584-011-0149-y [ Links ]
13.Haerter JO, Hagemann S, Moseley C, Piani C. Climate model bias correction and the role of timescales. Hydrol Earth Syst Sci. 2011;15:1065-1079. https://doi.org/10.5194/hess-15-1065-2011 [ Links ]
14.Ho CK, Stephenson DB, Collins M, Ferro CAT, Brown SJ. Calibration strategies: A source for additional uncertainty in climate change projections. Bull Am Meteorol Soc. 2012;93:21-26. https://doi.org/10.1175/2011BAMS3110.1 [ Links ]
15.CSIRO and Bureau of Meteorology. Climate change in Australia. Information for Australia's natural resource management regions: Technical report. Melbourne: CSIRO and Bureau of Meteorology, Australia; 2015. [ Links ]
16.Moberg A, Jones PD. Regional climate model simulations of daily maximum and minimum near-surface temperatures across Europe compared with observed station data 1961-1990. Clim Dyn. 2005;23:695-715. https://doi.org/10.1007/s00382-004-0464-3 [ Links ]
17.Dale A, Fant C, Strzepek K, Lickley M, Solomon S. Climate model uncertainty in impact assessments for agriculture: A multi-ensemble case study on maize in sub-Saharan Africa. Earth's Future. 2017;5:337-353. https://doi.org/10.1002/2017EF000539 [ Links ]
18.Ehhalt D, Prather M, Dentener F, Derwent R, Dlugokencky EJ, Holland E, et al. Atmospheric chemistry and greenhouse gases. In: Houghton JT, Ding Y, Griggs DJ, Noguer M, Van der Linden PJ, Dai X, et al., editors. Climate change 2001: The scientific basis. Contribution of Working Group I to the Third Assessment Report of the Intergovernmental Panel on Climate Change. Cambridge, UK: Intergovernmental Panel on Climate Change; 2001. p. 244-245. [ Links ]
19.Notz D. How well must climate models agree with observations? Phil Trans R Soc A. 2015;373, Art. #20140164, 16 pages. https://doi.org/10.1098/rsta.2014.0164 [ Links ]
20.Sillmann J, Kharin VV, Zwiers FW, Zhang X, Bronaugh D. Climate extremes indices in the CMIP5 multimodel ensemble: Part 2. Future climate projections. J Geophys Res Atmos. 2013;118:2473-2493. https://doi.org/10.1002/jgrd.50188 [ Links ]
21.Dosio A. Projections of climate change indices of temperature and precipitation from an ensemble of bias-adjusted high-resolution EURO-CORDEX regional climate models. J Geo-phys Res Atmos. 2016;121:5488-5511. [ Links ]
22.Zhang X, Yang F. RClimDex (1.0): Manual. Ontario: Environment Canada; 2004. [ Links ]
23.Kruger AC. Climate of South Africa. Climate regions: WS45. Pretoria: South African Weather Service; 2004. [ Links ]
24.Ringard J, Dieppois B, Rome S, Diedhiou A, Pellarin T, Konaré A, et al. The intensification of thermal extremes in west Africa. Global Planet Change. 2016;139:66-77. https://doi.org/10.1016/j.gloplacha.2015.12.009 [ Links ]
25.Arora VK, Scinocca JF, Boer GJ, Christian JR, Denman KL, Flato GM, et al. Carbon emission limits required to satisfy future representative concentration pathways of greenhouse gases. Geophys Res Lett. 2011;38(5), L05805, 6 pages. https://doi.org/10.1029/2010GL046270 [ Links ]
26.Voldoire A, Sanchez-Gomez E, Salas Y, Mélia D, Decharme B, Cassou C, et al. The CNRM-CM5.1 global climate model: Description and basic evaluation. Clim Dyn. 2013;40:2091-2121. https://doi.org/10.1007/s00382-011-1259-y [ Links ]
27.Rotstayn LD, Collier MA, Jeffrey SJ, Kidston J, Syktus JI, Wong KK. Anthropogenic effects on the subtropical jet in the southern Hemisphere: Aerosols versus long-lived greenhouse gases. Environ Res Lett. 2013;8, Art. #014030, 8 pages. https://doi.org/10.1088/1748-9326/8/1/014030 [ Links ]
28.Hourdin F, Foujols MA, Codron F, Guemas V, Dufresne JL, Bony S, et al. Impact of the LMDZ atmospheric grid configuration on the climate and sensitivity of the IPSL-CM5A coupled model. Clim Dyn. 2013;40:2167-2192. https://doi.org/10.1007/s00382-012-1411-3 [ Links ]
29.Watanabe S, Hajima T, Sudo K, Nagashima T, Takemura T, Okajima H, et al. MIROC-ESM 2010: Model description and basic results of CMIP5-20c3m experiments. Geosci Model Dev. 2011;4:845-872. https://doi.org/10.5194/gmd-4-845-2011 [ Links ]
30.Collins WJ, Bellouin N, Doutriaux-Boucher M, Gedney N, Halloran P, Hinton T, et al. Development and evaluation of an earth-system model - HadGEM2. Geosci Model Dev Discuss. 2011;4:997-1062. https://doi.org/10.5194/gmd-4-1051-2011 [ Links ]
31.Ilyina T, Six KD, Segschneider J, Maier-Reimer E, Li H, Nuńez-Riboni I. The global ocean biogeochemistry model HAMOCC: Model architecture and performance as component of the MPI-Earth System Model in different CMIP5 experimental realizations. J Adv Model Earth Syst. 2013;5(2):287-315. https://doi.org/10.1029/2012MS000178 [ Links ]
32.Tjiputra JF, Roelandt C, Bentsen M, Lawrence DM, Lorentzen T, Schwinger J, et al. Evaluation of the carbon cycle components in the Norwegian Earth System Model (NorESM), Geosci Model Dev. 2013;6:301-325. https://doi.org/10.5194/gmd-6-301-2013 [ Links ]
33.Dunne JP, John JG, Adcroft AJ, Griffies SM, Hallberg RW, Shevliakova E, et al. GFDL's ESM2 global coupled climate-carbon earth system models. Part I: Physical formulation and baseline simulation characteristics. J Clim. 2012;25(19):6646-6665. https://doi.org/10.1175/JCLI-D-11-00560.1 [ Links ]
 Correspondence:
Andries Kruger
Email: Andries.Kruger@weathersa.co.za
Received: 28 Mar. 2018
Revised: 09 Jan. 2019
Accepted: 20 Jan. 2019
Published: 29 May 2019
EDITORS: Nicolas Beukes Yali Woyessa
FUNDING: None

