


Services on Demand
Article
 English (pdf)
 Article in xml format
 Article references
Indicators

Related links
-
 Cited by Google
 -
 Similars in Google
Share

 Permalink
South African Journal of Science
On-line version ISSN 1996-7489
Print version ISSN 0038-2353
S. Afr. j. sci. vol.115 n.5-6 Pretoria May./Jun. 2019
http://dx.doi.org/10.17159/sajs.2019/5372
RESEARCH ARTICLES
Nurdle drifters around South Africa as indicators of ocean structures and dispersion
Eckart H. SchumannI; C. Fiona MacKayII, III; Nadine A. StrydomIV
IDepartment of Geosciences, Institute for Coastal and Marine Research, Nelson Mandela University, Port Elizabeth, South Africa
IIOceanographic Research Institute, South African Association for Marine Biological Research, Durban, South Africa
IIISchool of Life Sciences, University of KwaZulu-Natal, Durban, South Africa
IVZoology Department, Nelson Mandela University, Port Elizabeth, South Africa
ABSTRACT
Dispersion processes in the ocean typically involve wind, ocean currents and waves. All these factors were included in an analysis to model nurdle dispersion from an accidental spill in Durban Harbour, South Africa, in October 2017. Nurdle sightings on beaches by members of the public are used as indicators of the dispersion which extended over 2000 km of the South African coastline in a period of 8 weeks. Using known oceanographic current structures, satellite imagery, wave data and surface wind drift values of between 5% and 8% of wind speed, good agreement was found between the modelled dispersion and nurdle sightings. In particular, it was found that nurdles remained in specific sections of the coast for long periods, and that sporadic wind events were required to move them into new coastal areas. Such results may also contribute to understanding the dispersal behaviours and strategies adopted by larval stages of marine organisms, particularly fishes, that have pelagic larval durations that extend over weeks to months. The event was recognised as a major pollution incident rivalling other nurdle spillages reported worldwide, and extensive efforts were made to collect the nurdles, particularly along the northern KwaZulu-Natal coast. However, 9 months later, less than 20% had been recovered. The results emphasise the connectivity of different ocean regions, and in particular that pollution of the ocean is not a localised activity. Matter discharged at one point will disperse over a wide area - in this case, significantly further afield than the area of recovery operations.
SIGNIFICANCE:
• Wind drift in the upper metre or two of the ocean has been notoriously difficult to quantify, and the spread of nurdles along the South African coastline can only be explained by using drift percentages two or three times the generally accepted value of 3% or less. Nonetheless, it is important to realise that there are substantial differences in dispersion rates between the upper few centimetres of the ocean and that even a metre or two deeper.
• The rapid manner in which nurdles, and other microplastics, can be dispersed is important in terms of understanding the spread of this form of pollution in the world's oceans. The results also confirm the important role that wind can play in the movement of eggs, larvae and invertebrates and the significance of vertical migrations in and out of the surface layers.
• Finally, the results confirm many of the accepted coastal current regimes on the east and south coasts of South Africa. Moreover, it is shown that certain sections can have very long residence times, where drifters are only removed under sustained wind conditions.
Keywords: wind; currents; dispersion processes; microplastic pollution; larval movement
Introduction
On 10 October 2017, a storm caused by an upper air cut-off low hit Durban on the South African east coast. It caused considerable damage, and in particular in Durban Harbour at least two 12-m-long shipping containers were washed off the carrier MSC Susanna.
The severely ruptured containers were allegedly left submerged in the harbour for several days before the contents became known. First responders were the public who noted that tiny plastic pellets (nurdles) were washing up on local swimming beaches in the days after the storm. Almost a month later, the scale of the spill precipitated the engagement of local and global salvage and emergency response companies to clean 200 km of beaches north and south of Durban. It is estimated that approximately 49 tonnes - representing some two billion microplastic nurdles - were spilled into Durban Harbour during this incident. Information on the spill was coordinated by CoastKZN, an interactive web-based information portal maintained by the Coastal Zone and Estuaries research groups at the Oceanographic Research Institute (www.coastkzn.co.za), Durban.
Nurdles are small polyethylene pellets - approximately the size of a lentil (5 mm in diameter) - and serve as raw material in the manufacture of plastic products. They are made from synthetic substances and petrochemical products that give them high mouldability for such manufacture.
In the ocean, nurdles are buoyant, float on the surface and come under the direct influence of winds, waves and ocean currents. This and their environmental persistence mean that they are distributed widely in the world's oceans and deposited on beaches even in remote locations. Further information about nurdles, including their fate and effect in the environment, can be obtained from organisations such as International Pellet Watch (www.pelletwatch.org).
Shortly after initial deposition on KwaZulu-Natal (KZN) beaches, these microplastics were found on the entire south-east coast of South Africa and later also to the west along the south coast. The movement of nurdles in this study is based on first reports of where nurdles were found on beaches, primarily by members of the public coordinated by a social media group (the KZN Waste Network) formed to communicate and report sightings. As such it cannot be considered definitive, although media reports served to make this a popular topic, and the public were then particularly aware of what to look for and where to report sightings. Of the estimated 49 tonnes spilled, just over 9 tonnes had been recovered by February 2018. Later, salvage of the nurdles by response teams (25.8 tonnes until October 2018) may provide evidence for longer-term circulation systems within and beyond the KZN shelf.
Despite the inherent and likely long-lasting effects of this local disaster, it afforded an opportunity to study nurdle movement, firstly off KZN and then off the southeast and south coasts in the context of deposition locations and drift duration before settlement. The analysis presented attests to a remarkably rapid dispersion of this plastic pollution and demonstrates the manner in which ocean regions are intimately connected. As such, these results may also provide valuable insight into the dispersal and population connectivity of the pelagic larval stages of marine organisms such as fishes.
A brief background of known oceanographic conditions in the relevant regions is given first, followed by a discussion of the dispersion effects of winds, waves and currents. Nurdle movement is considered only for the first 8 weeks after the spill as that is when the most specific and traceable movements in the ocean occurred. Thereafter other effects such as deposition on the shore, burial, re-exposure and re-transportation offshore would have become increasingly important.
Moreover, UV-exposure and mechanical abrasion effects on the plastic drifters may influence nurdle buoyancy1 and as movement of the nurdles under the influence of wind and waves is critically dependent on their position in the water column, the dispersion trajectories could also vary. Some nurdles remained for long periods in close proximity to selected coastal areas, possibly being washed onto beaches and then moved again by subsequent waves, while others were taken far into the deep ocean.
Ocean environment
Investigations into the oceanic environment off the east and south coasts of South Africa have been ongoing for decades2, and only a brief description of relevant features is given here.
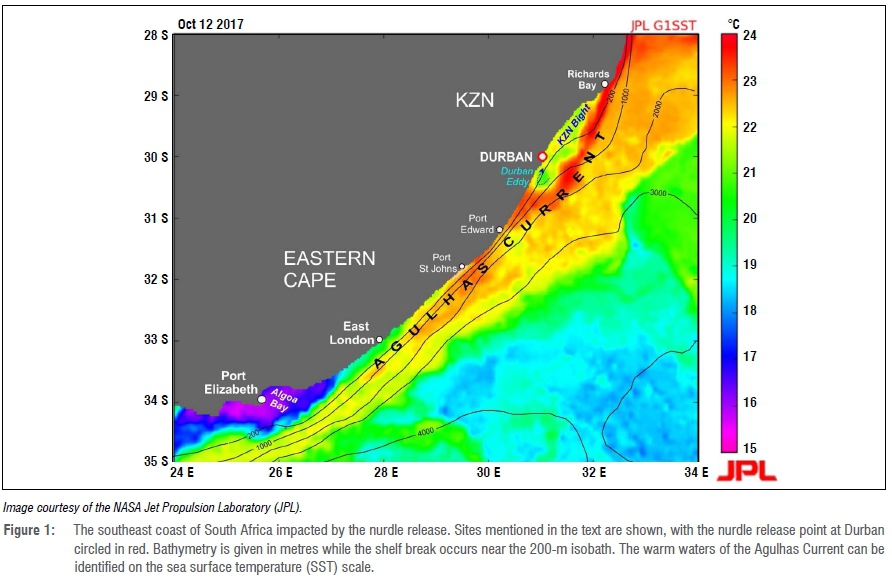
The region is dominated by the Agulhas Current, a western boundary current constrained by planetary vorticity considerations to flow southwestwards along the shelf edge on the southeast coast of South Africa.3,4 Warm oceanic water from the tropics and subtropics is taken southwestwards as a narrow, fast-flowing tongue of water5, with a 4° to 5° cooling of surface waters from north to south (Figure 1). Surface current speeds in the core of the Current can exceed 2 m/s, with a marked offshore speed gradient on the inner boundary, as well as with depth.
The core of the Agulhas Current generally lies offshore of the shelf break. However, off the KZN coast, the variations in coastline orientation and terrace-like bathymetry result in a distinct region to the north of Durban and inshore of the Current termed the KZN Bight (Figure 1). The Agulhas Current generally lies 40-50 km offshore in this area and a northwards flow is evident off Durban.6,7 On the shallow shelf off Richards Bay, Schumann8 found that the currents were essentially wind-driven, while Lutjeharms et al.9 confirmed that persistent upwelling occurs in the northern Bight as the Agulhas Current moves offshore north of Richards Bay.
Roberts et al.10 provide a review of past investigations, and also conducted intensive measurements using a number of different data sources to obtain a synoptic picture of circulation patterns off KZN. Their results corroborated the earlier investigations with a cyclonic circulation evident for much of the time, although on occasion northeast or southwest currents occurred along the entire Bight. With smaller mesoscale eddies evident, a longer residence time of at least 14 days was found, particularly in the northern section.
The shelf narrows south of Durban with a consequent onshore movement of the Agulhas Current as a result of the inherent vorticity structures.11 Consistent onshore flow occurs some 50 to 60 km south of Durban, with a recirculation northward flow from that area.12 This is referred to as the Durban eddy13 and, when present, northeastward currents can reach up to 1 m/s14.
Meanders in the flow are seen on a regular basis, with the larger-scale Natal Pulse occurring several times a year15, although the definition of such large meanders is open to interpretation16. The origin of the meanders appears to lie off KZN with a breakaway at the Durban eddy, or otherwise farther north in the KZN Bight.13 At the time of the nurdle spill, satellite imagery does not depict evidence of a Natal Pulse or any other major meanders in the flow (Figure 1).
To the south of Port Edward, the narrow shelf means that the Agulhas Current flows generally close to the coast, while south of East London the shelf widens again, forcing the core of the Current farther offshore. As the coastline veers west, colder water is often observed close to the coast, upwelled by a combination of widening isobaths, bottom boundary flows and winds.17 The widening Agulhas Bank forms a complex inshore region dominated by winds, insolation effects, coastal morphology and bathymetry as the influence of the Agulhas Current diminishes.18
Winds play a dominant role in the motion of the upper layers of the ocean. The major axes of coastal winds around South Africa generally follow the coastline.19 Nonetheless, local coastal features can result in wind regime changes, e.g. off KZN20 and Algoa Bay21.
Effects of winds, waves and ocean currents on nurdles
Nurdles are buoyant and float at or near the sea surface, while it is likely that a small percentage could also protrude above the sea surface. As such, their movement in the ocean is primarily a result of prevalent winds, waves and larger-scale ocean currents. The inherent turbulence in the surface layers ensures a continual movement of nurdles in and out of the surface and the layers immediately below.
Orbital velocities of particles under ocean waves are not precisely circular, and there is a net forward motion, termed the Stokes Drift, which is dependent directly on wave period and height and inversely on wave length. Frictional effects of wind moving over the ocean surface will also induce a movement of water in the direction of the wind, decreasing rapidly with depth. Moreover, these two processes are not independent of each other, because winds are also the primary mechanism in generating waves.
The ocean surface is a very complex regime, and it has been difficult to precisely measure the processes involved in the movement of floating material. Most investigations have considered movement in a near-surface layer a few metres deep and have found a drift of between 1.5% and 4.1% of wind speed.22 Laboratory and theoretical studies23 have determined a commonly accepted value of 3%. Veering to the right in the northern hemisphere as a result of the Coriolis force was found to vary between 0 and 34°.
The small size of the nurdles means that it is important to know what happens in the upper 10 mm of the sea surface. A recent investigation by Laxague et al.24 was able to measure the net surface movement under winds of 4.3 m/s and small waves (period 1.9 s and significant wave height 0.86 m). A drift of over 13% of wind speed was found in the top 10 mm, with this movement more than twice that over the top 1 m and more than four times that over the top 10 m (Figure 2). No veering was found in the upper 0.5 m, but it did increase with depth.
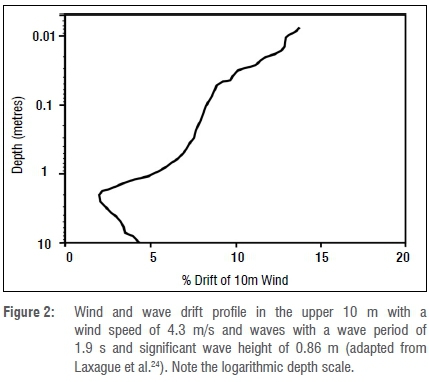
These results show that wind and waves can cause substantial movement of material floating on the surface of the sea. At this stage it is not clear in what manner these results can be extrapolated to stronger winds and bigger waves; moreover the situation will be more complex if winds and waves are acting in different directions. However, because of the turbulence in the upper few metres, nurdles will be spread out over this whole regime, involving a range of drift speeds. In this analysis movement of nurdles between 3% and 10% of wind speed will be considered as a compromise for the range of depths where nurdles would have been situated; Figure 2 indicates that values could be higher in the very near surface.
Moreover, the effect of an underlying, large-scale ocean current is included as a scalar add-on. In the case of the fast-flowing Agulhas Current the added movement of surface drifters will in many cases be substantially higher than that from wind alone.
At the coast the transport of nurdles onto beaches will have depended on prevalent waves and tides and will also have been in a continual state of deposition and removal. With millions of nurdles present, many would have found their way onto the beaches for people to find - most likely at the wrack line from the highest daily tide.
Data and analyses
The following ocean and atmospheric data were used in this analysis:
•Wind: The South African Weather Service maintains a number of weather stations along the South African coast, and hourly wind speed and direction measurements were obtained for all relevant locations. Weather station sites used are given on the figures.
• Satellite imagery: The NASA Jet Propulsion Laboratory website (https://sst.jpl.nasa.gov/SST/#) combines all available sea surface temperature (SST) data sets at various spatial resolutions to produce global 1-km SST images (G1SST). These false-colour SST images are used to identify possible current structures, in particular the warm Agulhas Current and upwelling features.
• Waves: NOAA host an ftp site (ftp://polar.ncep.noaa.gov/pub/history/waves/) from which hindcast wave data derived from wind fields can be obtained at positions every half degree latitude and longitude.
• Ocean currents: The Copernicus Marine Environmental Monitoring Service determines global ocean gridded sea surface heights during satellite overpasses (www.marine.copernicus.eu). Using these heights, absolute geostrophic currents can be derived, which is especially useful for Agulhas Current flow.
The effect of the wind is shown by means of progressive vector diagrams (PVDs). These effectively show the movement of a mass of water under the influence of the wind by drawing the hourly vector movement of the water, and then adding the next hourly vector onto the end of the first vector. The percentage effect of the wind can be varied as required, and as previously indicated, values from 3% to 10% are used in these analyses.
Time sequence of nurdle beach deposition
Nurdle movement was assessed from reports by the public when nurdles were found on beaches and recorded on the website of CoastKZN.
The storm which resulted in the Durban harbour nurdle release occurred on 10 October 2017. It is evident that the nurdles dispersed immediately, but it took several days for the public to become aware of the event, and sightings were reported only a week or more later. Table 1 gives a record of reported sightings on coastal beaches, which were then incorporated into Figures 3, 4 and 5.
Most reported nurdle sightings occurred north of Durban on beaches along the KZN Bight; in this case only the number of days in October, November and December with sightings are given (Figure 3). The situation south of Durban is considered separately and here the actual dates of sightings are given. Similarly for Figures 4 and 5, the actual dates of sightings are given, with subjective assessments of the volume of nurdles found. Note that the last day considered in this analysis is 10 December 2017.
It must be recognised at the outset that the sighting reports depended on a number of factors:
• The nurdles had to be washed onto a beach and be visible.
• There had to be a concerned member of the public who noticed (and collected) the nurdles.
• The member of the public had to report the presence of the nurdles, in this case to CoastKZN.
There were no other known nurdle sources at the time, and the reports that were received were verified to ensure that they originated in the Durban Harbour spill. Nurdles that have been in the ocean for some time are affected by photo radiation and become discoloured. Also, hydrophobic pollutants such as persistent organic pollutants cause further discolouration by being adsorbed onto nurdles from the surrounding seawater.1,25
There is no certainty about the actual dates when nurdles reached specific coastal locations, as they could have been present for some time before being reported. However, given the ongoing publicity afforded to the spill and the number of organised coastal clean-up events to physically remove the nurdles, it is unlikely they remained unobserved for more than a few days. Nonetheless, there were undoubtedly some nurdles on different beaches that went unreported.
Wind, ocean structures and nurdle movement
The movement of nurdles is divided into three sections with different wind and ocean regimes: these are north and south of Durban and then along the east and south coasts.
North of Durban
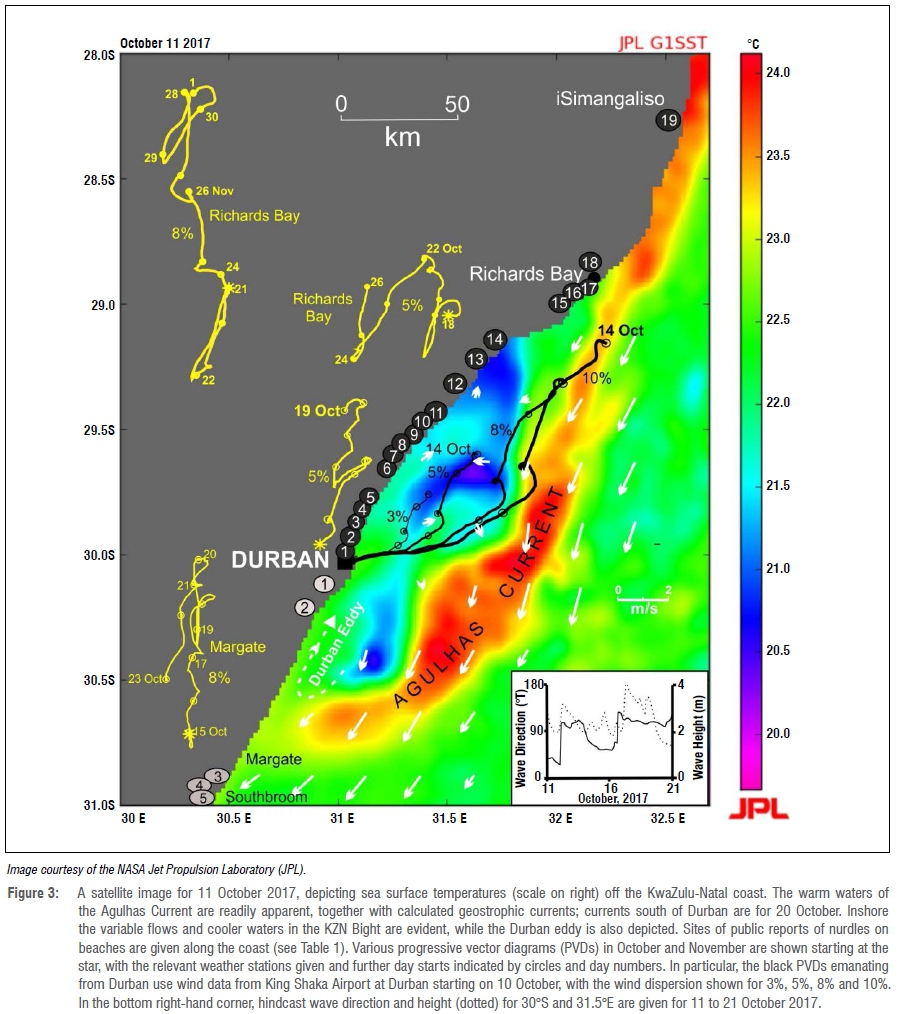
The strong southwesterly storm winds that caused the damage in Durban Harbour were also responsible for dispersing the nurdles out of the harbour and into the adjacent ocean. The situation is depicted in a satellite image taken on 11 October showing offshore SST structures (Figure 3). Of particular importance is the warm Agulhas Current in a typical position offshore of the KZN Bight and then moving closer to the coast some distance south of Durban; ocean currents and waves at the time are also shown.
The wind data from King Shaka International Airport were used to model nurdle movement, with four different wind drift percentages applied, namely 3%, 5%, 8% and 10%. The strong winds meant that the nurdles were rapidly moved out to sea; however, the different surface wind drift percentages show remarkably different results.
Four days are depicted, with most movement happening on the first day, 10 October. The 3% and 5% drifts did not transport the nurdles more than 30 km offshore, essentially just within the variable flow in the KZN Bight. On the other hand, the 8% drift would have taken the nurdles into the inshore shear zone, while only the 10% drift would have taken nurdles well into the Agulhas Current. Higher drifts would have been even more effective in transporting the nurdles farther offshore.
The actual movement of the nurdles over the days following the spill would have encompassed all of these movements, as it is clear from the results of Laxague et al.24 that the dispersion and movement of the nurdles would have depended critically on their position in the water column. Those nurdles in the upper 10 mm of the ocean would have separated very quickly from those nurdles even a few centimetres deeper. As such, after a day or two, some nurdles will have been swept away southwestwards by the Agulhas Current, while others will have entered the quieter waters to the north in the KZN Bight.
The Stokes Drift associated with the waves from about 120 °T prevalent on 11 October would have acted against the offshore movement of the nurdles. However, the relatively small amplitude (2.1 m) waves would not have had a substantial impact. Later waves were mainly from the south, increasing northward movement of surface waters.
A 5% wind drift from King Shaka International Airport is also shown from 11 October (Figure 3 in yellow). The winds were more southerly, and the movement of nurdles was northwards close to the coast and into the KZN Bight; the period up to 19 October is shown.
Also depicted is the 5% drift using wind data from Richards Bay starting on 18 October, when the winds were variable and generally nearly parallel to the coast. These winds would have retained the nurdles within the KZN Bight, and the large number of reported sightings through to 10 December confirms that the nurdles remained in the area (Table 1).
Until December 2017, there were no reported nurdle sightings north of Richards Bay, probably because the continental shelf narrows to within 5 km of the coast and the southwestward flow of the Agulhas Current is correspondingly closer to the coast, inhibiting movement northwards. However, as indicated in Table 1, on 1 December nurdles were reported at the border of the iSimangaliso World Heritage site, some 70 km north of Richards Bay.
A PVD from Richards Bay over the period 21 November to 1 December indicates that from 22 to 28 November there were consistent southerly winds, which could have swept nurdles northwards more than 100 km. An inspection of satellite imagery at the time shows that the Agulhas Current was also not well defined off the coast, indicating that currents were probably slack: this would have allowed nurdle movement northwards.
Nurdles were reported at Bhanga Nek, situated at 27°N and more than 200 km north of Richards Bay on 4 December, and indicates that nurdle movement continued northward (Table 1).
South of Durban
Nurdles that reached the Agulhas Current would have been taken southwestwards at speeds of up to 2 m/s in the core. As discussed earlier, the Current typically moves closer to the coast with the narrowing shelf farther south, and nurdles on the inshore boundary would have taken 4 days or more to reach this area some 140 km south of Durban. Nurdles were reported in the Southbroom area from 21 October (Table 1 and Figure 3).
The recirculation flow northwards associated with the Durban cyclonic eddy13 is evident on 20 October, and Figure 3 also depicts a PVD using wind data from Margate. It is clear that from around 16 October a southerly wind would have carried nurdles northward, and their presence was reported at Winkelspruit immediately south of Durban on 25 October. It is therefore likely that the nurdles found there would have followed a much longer path than immediately out of the harbour southward on 10 October.
Figure 4 shows the situation for those nurdles that were taken southwestwards by the Agulhas Current after exiting Durban Harbour. It is surmised that the majority that beached were on the inner boundary of the Current, as it is likely that those that reached the core would have been taken into the Southern Ocean.
Substantial numbers of nurdles must have been located on this inner boundary or closer to the coast, with reported sightings spread over the approximately 350 km from Port Edward to East London from 27 October to 4 November. The waves on 28 October were from the southwest with reasonably long periods (13 s) and moderate amplitudes (3 m), and would have facilitated the onshore movement of nurdles.
The PVD using wind data from Port St Johns over the period 25 October to 4 November shows a variable wind regime and little net movement. As expected, most of the winds were aligned more or less parallel to the coastline. Roberts et al.13 have also described a small quasi-permanent cyclonic eddy off Port St Johns which would have been effective in retaining nurdles in the area; moreover, Table 1 shows that they were sighted well into November.
Farther south, at East London and Port Alfred, substantial easterly winds were present from 28 October to 4 November (yellow PVDs in Figure 4). In the ocean, two black PVDs are depicted where inshore southwestward Agulhas Current currents are combined with the 8% wind-driven surface nurdle movement. At the offshore position just north of East London, the initial current speed was assumed to be 1 m/s southwestward, decreasing until 2 November when no currents were included. Off Port Alfred, the initial position is closer to the coast and the current was assumed to be 0.8 m/s, decreasing until no currents were included from 1 November. Wave directions over this period were from the east, which would have assisted nurdle movement westward.
The added effect of the Agulhas Current is substantial, compared with the 8% movement from only wind. Under these conditions, nurdles would have been carried out of the Agulhas Current and into Algoa Bay and, correspondingly, nurdles were reported in the area at the end of October and beginning of November (Table 1). Southwesterly-component winds also commenced at Port Elizabeth from around 4 November, which would have retained the nurdles in the area.
South Coast
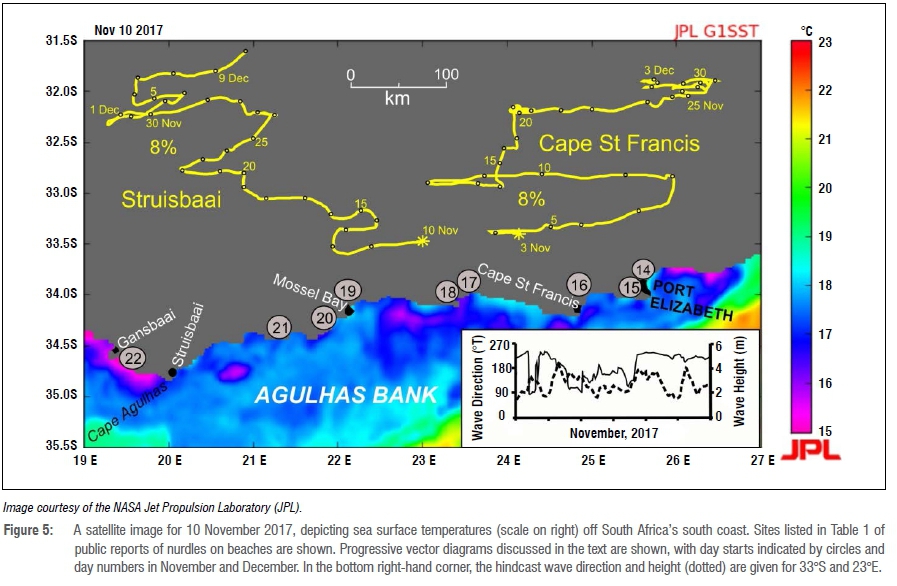
Figure 5 depicts the next stage in nurdle movement along the South African coast, from the end of October and into December 2017. No current structures are given in the figure because of the day-to-day variability on the wide continental shelf area of the Agulhas Bank.18
The PVDs for Port Elizabeth in Figure 4 and Cape St Francis in Figure 5 show that southwesterly winds prevailed until about 8 November. Thereafter there was a 4-day period during which time strong easterly winds would have taken nurdles over 200 km westward with an 8% wind drift. Subsequent winds were mainly from the south and west.
Figure 5 shows marked upwelling at the prominent capes, as a result of the easterly winds.18,26 The dynamics associated with such upwelling produces westward currents at the coast, assisting the movement west. The wave directions were predominantly from the south but with an admixture of easterly waves at times; from about 20 November this changed to being predominantly from the south-southwest.
As a result, nurdles were found along the whole of the south coast from 20 November and into December. The PVD for the weather station at Struisbaai has a different orientation, with a marked northeasterly trend over the whole period. This indicates that once around Cape Agulhas, the nurdles would have moved consistently west along the coast and, for this analysis, culminated at Gansbaai on 5 December.
Discussion
The analyses presented here reconstruct the conditions and factors at play in the dispersion of nurdles along about 2000 km of the South African east and south coasts in a relatively short (8-week) period after a spill in Durban Harbour. Where microplastic pollution has received attention in the past in the context of effects on the environment and bioaccumulation25,27, only recently has attention focused on the mechanisms of movement and eventual fates of these particles28,29.
Existing knowledge of conditions along various sections of the coast is used, together with satellite imagery, coastal wind data, satellite altimetry based geostrophic currents and hindcast wave data to explain the dispersion of the nurdles. The results are dependent on the effect of wind on objects floating in the surface layers of the ocean, and the results of Laxague et al.24 have justified the use of a percentage wind drift greater than the commonly accepted 3% of the wind speed. Indeed, it is apparent that the good agreement between where nurdles were found and their proposed trajectories is dependent on such higher values.
However, it is important to recognise the variation in wind drift speed over the upper layers of the ocean, and that nurdles in the upper 10 mm will have been moved much farther than those even 1 m deeper. With the turbulence present in the ocean surface and a consequent spread of nurdles with depth, it can therefore be expected that they would have been dispersed widely, and the trajectories presented here are representative of only some of the many routes that would have been taken. In particular, these routes use an average value of 8% wind drift to explain where nurdles were found by members of the public.
The analysis also sheds some light on the sporadic manner in which such surface drifters can be dispersed by the wind. Along many coastal sections, winds vary in both direction and speed almost on a daily basis, and under such conditions the drifters can oscillate in position without an overall substantive movement. It is then that the periods of sustained winds are important, that is, when the drifters can be moved hundreds of kilometres in one direction over a few days. This is evident in all three figures (Figures 3-5), where there are periods when drifters would have remained within sections of the coast, and others when they would have been moved substantial distances.
Additionally, this study adds insight to environmental and ecological aspects of ocean dispersion. Microplastics, of which nurdles form a component, are found in the water column in all coastal/marine, estuary and river environments.30-32 Understanding the movement of such particles can add insight into the location of long-term deposition sites e.g. on beaches, in beach sediments or even in the deep ocean floor when they have, through various processes, sunk to the benthic layer.33
Microplastics (100 nm - 5 mm in diameter, e.g. fragments, particles, fibres, pellets) and their marine prevalence are an increasing focus of study as they can be directly ingested by biota across trophic levels from fishes to mammals, turtles and seabirds.34 Even at developing larval stages, ingestion has been documented and assertions made as to the health and developmental risks.35 Fish larvae have been found to have high levels of microplastic pollution in coastal seas - an area where both biological and pollutant particles are highly concentrated.35 A new consideration is trophic transfer whereby plastic is moved up the food chain by predation on fauna that have ingested or have associated plastic. Similar to biomagnification of chemical pollutants up the food chain, particles can be further concentrated in top predators.34 These are examples of individual organism-level health risks. Recent indications suggest that microplastics could also manifest at the population level, with population shifts, altered behaviours and changes in ecological function.36
Understanding the fate of passive particles is further useful in the study of contaminants. Ogata et al.25 studied the pollutant concentrations of nurdles found beached round the world relative to ambient levels and residence times in waters related to circulation patterns. Off the South African coast (south of Durban), nurdle contamination indicated recent use of an organochlorine, persistent organic pollutant - Lindane - at levels representing orders of magnitude higher than any other global study site.25 Microplastics interact with persistent organic pollutants and contaminate marine biota when ingested.34
Nurdle movement also mimics passive biological particles such as drifting eggs, larvae or even adult invertebrates. Many marine species have small, pelagic early life history stages. Population connectivity of these species necessitates understanding the origin and routes of dispersing eggs and larvae between subpopulations.37 Understanding the dispersal routes and processes during the early life history stages of fishes with respect to adult spawning grounds, preferred nursery and feeding habitats, is still relatively poorly understood.
Opportunities to study marine larval movement in the context of population connectivity are vital for both benthic species that use the planktonic larval stages to connect sessile populations38 and for the management and conservation of fished species that require regional management efforts39.
Acknowledgements
This analysis could not have proceeded without the participation of members of the public who reported the presence of nurdles on South African beaches independently and through the KZN Waste Network. The work of CoastKZN is acknowledged in collating all this information and making it available, in particular Rabia Wahab and Marinel Wilemse of the Oceanographic Research Institute. The Oceanographic Research Institute funded the data capturers. Funding for CoastKZN is provided by the KZN Department of Economic Development, Tourism and Environmental Affairs. Mr G Sampson of the South African Weather Service kindly provided the wind data, while the NASA Jet Propulsion Laboratory and NOAA are acknowledged for satellite imagery and ocean wave data and the Copernicus Marine Environmental Monitoring Service provided calculated geostrophic currents.
Authors' contributions
E.H.S.: Original formulation; design of methodology; creation of models; data collection; data analysis; validation; writing - the initial draft; writing - revisions; project management. C.F.M.: Data collection; validation; data curation; writing - revisions; project management. N.A.S.: Original formulation; writing - revisions; project management.
References
1.Song YK, Hong SH, Jang M, Han GM, Jung SW, Shim WJ. Combined effects of UV exposure duration and mechanical abrasion on microplastic fragmentation by polymer type. Environ Sci Technol. 2017;51(8):4368-4376. https://doi.org/10.1021/acs.est.6b0615 [ Links ]
2.Schumann EH. Coastal ocean studies off Natal, South Africa. Lecture Notes on Coastal and Estuarine Studies. Vol. 26. New York: Springer Verlag; 1988. [ Links ]
3.Schumann EH. The coastal ocean off southeast Africa, including Madagascar. In: Robinson AR, Brink KH, editors. Special edition: The global coastal ocean, the sea. Vol. 11. New York: John Wiley & Sons; 1998. p. 557-582. [ Links ]
4.Lutjeharms JRE. The Agulhas Current. Berlin: Springer; 2006. [ Links ]
5.Grundlingh ML. On the course of the Agulhas Current. S Afr Geogr J. 1983;65:49-57. https://doi.org/10.1080/03736245.1983.10559671 [ Links ]
6.Pearce AF, Schumann EH, Lundie GS. Features of the shelf circulation off the Natal coast. S Afr J Sci. 1978;74:328-331. [ Links ]
7.Schumann EH. The coastal ocean off the east coast of South Africa. Trans Roy Soc S Afr. 1987;46:215-229. https://doi.org/10.1080/00359198709520125 [ Links ]
8.Schumann EH. Low frequency fluctuations off the Natal coast. J Geophys Res. 1981;86:6499-6508. https://doi.org/10.1029/JC086iC07p06499 [ Links ]
9.Lutjeharms JRE, Gründlingh ML, Carter RA. Topographically induced upwelling in the Natal Bight. S Afr J Sci. 1989;85:310-316. [ Links ]
10.Roberts MJ, Nieuwenhuys C, Guastella LA. Circulation of shelf waters in the KwaZulu-Natal Bight, South Africa. Afr J Mar Sci. 2016;38:7-21. https://doi.org/10.2989/1814232X.2016.1175383 [ Links ]
11.Gill AE, Schumann EH. Topographically induced changes in the structure of an inertial coastal jet: Application to the Agulhas Current. J Phys Oceanogr. 1979;9:975-991. https://doi.org/10.1175/1520-0485(1979)009<0975:TICITS>2.0.CO;2 [ Links ]
12.Schumann EH. Inshore circulation of the Agulhas Current off Natal. J Mar Res. 1982;40:43-55. [ Links ]
13.Roberts MJ, Van der Lingen CD, Whittle C, Van den Berg M. Shelf currents, lee-trapped and transient eddies on the inshore boundary of the Agulhas Current, South Africa: Their relevance to the KwaZulu-Natal sardine run. Afr J Mar Sci. 2010;32:423-447. https://doi.org/10.2989/1814232X.2010.512655 [ Links ]
14.Guastella LA, Roberts MJ. Dynamics and role of the Durban cyclonic eddy in the KwaZulu-Natal Bight ecosystem. Afr J Mar Sci. 2016;38:23-42. https://doi.org/10.2989/1814232X.2016.1159982 [ Links ]
15.Lutjeharms JRE, Roberts HR. The Natal Pulse: An extreme transient on the Agulhas Current. J Geophys Res. 1988;93:631-645. https://doi.org/10.1029/JC093iC01p0063 [ Links ]
16.Rouault MJ, Penven P. New perspectives on Natal Pulses from satellite observations. J Geophys Res. 2011;116(C7), C07013, 14 pages. https://doi.org/1+0.1029/2010JC006866 [ Links ]
17.Goschen WS, Schumann EH, Bernard KS, Bailey SE, Deyzel SHP. Upwelling and ocean structures off Algoa Bay and the south-east coast of South Africa. Afr J Mar Sci. 2012;34:525-536. https://doi.org/10.2989/1814232X.2012.749810 [ Links ]
18.Schumann EH. Wind-driven mixed layer and coastal upwelling processes off the south coast of South Africa. J Mar Res. 1999;57:671-691. https://doi.org/10.1357/002224099321549639 [ Links ]
19.Schumann EH. The propagation of air pressure and wind systems along the South African coast. S Afr J Sci. 1989;85:382-385. [ Links ]
20.Hunter IT. Climate and weather off Natal. In: Schumann EH, editor. Coastal ocean studies off Natal, South Africa. Lecture Notes on Coastal and Estuarine Studies. Vol. 26. New York: Springer Verlag; 1988. p. 81-100. [ Links ]
21.Schumann EH, Illenberger WK, Goschen WS. Surface winds over Algoa Bay, South Africa. S Afr J Sci. 1991;87:202-207. [ Links ]
22.Chang Y-C, Chen G-Y, Tseng R-S, Centurioni LR, Chu PC. Observed near-surface currents under high wind speeds. J Geophys Res. 2012;117(C11), C11026, 6 pages. https://doi.org/10.1029/2012JC007996 [ Links ]
23.Wu J. Sea-surface drift currents induced by wind and waves. J Phys Oceanogr. 1983;13:1441-1451. https://doi.org/10.1175/15200485(1983)013<1441:SSDCIB>2.0.CO;2 [ Links ]
24.Laxague NJM, Özgökmen TM, Haus BK, Novelli G, Shcherbina A, Sutherland P, et al. Observations of near-surface current shear help describe oceanic oil and plastic transport. Geophys Res Lett. 2017;44:1-5. https://doi.org/10.1002/2017GL075891 [ Links ]
25.Ogata Y, Takada H, Mizukawa K, Hirai H, Iwasa S, Endo S, et al. International pellet watch: Global monitoring of persistent organic pollutants (POPs) in coastal waters 1: Initial phase data on PCBs, DDTs, and HCHs. Mar Pollut Bull. 2009;58(10):1437-1446. https://doi.org/10.1016/j.marpolbul.2009.06.014 [ Links ]
26.Schumann EH, Ross GJB, Goschen WS. Cold water events in Algoa Bay and Cape south coast, South Africa, in March/April, 1987. S Afr J Sci. 1988;84:579-584. [ Links ]
27.Cole M, Lindeque P, Halsband C, Galloway TS. Microplastics as contaminants in the marine environment: A review. Mar Pollut Bull. 2011;62:2588-2597. https://doi.org/10.1016/j.marpolbul.2011.09.025 [ Links ]
28.Zhang H. Transport of microplastics in coastal seas. Estuar Coast Shelf Sci. 2017;199:74-86. https://doi.org/10.1016/j.ecss.2017.09.032 [ Links ]
29.Critchell K, Lambrechts J. Modelling accumulation of marine plastics in the coastal zone; what are the dominant physical processes? Estuar Coast Shelf Sci. 2016;171:111-122. https://doi.org/10.1016/j.ecss.2016.01.036 [ Links ]
30.Ng KL, Obbard JP. Prevalence of microplastics in Singapore's coastal marine environment. Mar Pollut Bull. 2006;52(7):761-767. https://doi.org/10.1016/j.marpolbul.2005.11.0174 [ Links ]
31.Browne MA, Galloway TS, Thompson RC. Spatial patterns of plastic debris along estuarine shorelines. Environ Sci Technol. 2010;44(9):3404-3409. https://doi.org/10.1021/es903784e [ Links ]
32.Sadri SS, Thompson RC. On the quantity and composition of floating plastic debris entering and leaving the Tamar Estuary, Southwest England. Mar Pollut Bull. 2014;81(1):55-60. https://doi.org/10.1016/j.marpolbul.2014.02.020 [ Links ]
33.IMO/FAO/UNESCO-IOC/UNIDO/WMO/IAEA/UN/ UNEP/UNDP Joint Group of Experts on the Scientific Aspects of Marine Environmental Protection. Sources, fate and effects of microplastics in the marine environment: Part two of a global assessment. London: International Maritime Organization; 2016. Available from: http://www.gesamp.org/site/assets/files/1275/sources-fate-and-effects-of-microplastics-in-the-marine-environment-part-2-of-a-global-assessment-en.pdf [ Links ]
34.Setälä O, Lehtiniemi M, Coppock R, Cole M. Microplastics in marine food webs. In: Zeng EY, editor. Microplastic contamination in aquatic environments. Amsterdam: Elsevier; 2018. p. 339-363. https://doi.org/10.1016/B978-0-12-813747-5.00011-4 [ Links ]
35.Galloway T, Cole M, Lewis C. Interactions of microplastic debris throughout the marine ecosystem. Nat Ecol Evol. 2017;1, Art. #0116. https://doi.org/10.1038/s41559-017-0116 [ Links ]
36.Steer M, Cole M, Thompson RC, Lindeque PK. Microplastic ingestion in fish larvae in the western English Channel. Environ Pollut. 2017;226:250-259. https://doi.org/10.1016/j.envpol.2017.03.062 [ Links ]
37.Pineda J, Hare JA, Sponaugle S. Larval transport and dispersal in the coastal ocean and consequences for population connectivity. Oceanography. 2007;20(3):22-39. https://doi.org/10.5670/oceanog.2007.27 [ Links ]
38.Cowen RK, Sponaugle S. Larval dispersal and marine population connectivity. Annu Rev Mar Sci. 2009;1:443-466. https://doi.org/0.1146/annurev.marine.010908.163757 [ Links ]
39.Putman NF, Lumpkin R, Sacco E, Mansfield KL. Passive drift or active swimming in marine organisms? Proc R Soc B. 2016;283(1844), Art. #20161689, 9 pages. http://dx.doi.org/10.1098/rspb.2016.1689 [ Links ]
 Correspondence:
Eckart Schumann
Email: eckarts@mweb.co.za
Received: 24 July 2018
Revised: 04 Feb. 2019
Accepted: 04 Feb. 2019
Published: 29 May 2019
EDITOR: Nicolas Beukes
FUNDING: Oceanographic Research Institute (South Africa); KZN Department of Economic Development, Tourism and Environmental Affairs

