


Servicios Personalizados
Articulo
 Inglés (pdf)
 Articulo en XML
 Referencias del artículo
Indicadores

Links relacionados
-
 Citado por Google
 -
 Similares en Google
Compartir

 Permalink
South African Journal of Science
versión On-line ISSN 1996-7489
versión impresa ISSN 0038-2353
S. Afr. j. sci. vol.115 no.3-4 Pretoria mar./abr. 2019
http://dx.doi.org/10.17159/sajs.2019/5910
COMMENTARIES
On defining droughts: Response to 'The ecology of drought - a workshop report'
Jennifer M. Fitchett
School of Geography, Archaeology and Environmental Studies, University of the Witwatersrand, Johannesburg, South Africa
Keywords: Lincoln Declaration; standardised precipitation index
Situated between the subtropics and the mid-latitudes, South African climate is dominated by persistent anticyclonic conditions year round.1,2 As a consequence, the region is relatively water scarce by global standards.2,3 During years of below-average rainfall, significant biometeorological impacts are felt by natural systems and human populations, yet often these are under-researched and under-reported, particularly in developing regions.4 Efforts to bring together interdisciplinary teams to collaborate in quantifying the impacts of adverse climatic conditions on ecosystem function are thus tremendously valuable. Swemmer et al.5 report on one such workshop, presenting important insights into the detriments, and in some cases benefits, of the below-average rainfall experienced in 2015-2016.
The findings regarding the impacts on herbivore mortality, migration and the utilisation of artificial waterholes, and the spatial heterogeneity in vegetation changes including grass and forb growth patterns and tree deaths5, are valuable in tracking the impacts of regional-scale water scarcity during events of below-average rainfall. These findings are not disputed. Rather, this Commentary reflects on issues surrounding the definition of a drought event, and in particular the use of a drought classification scale that discriminates exclusively between 'wet' and 'drought' conditions. It must be stated outright that the definition of drought does not affect the veracity of the workshop report by Swemmer et al.5 pertaining to the impacts of a rainfall reduction on herbivores and vegetation, nor do I contest that below-average rainfall occurred during this period.
Swemmer et al.5 present a map demonstrating 24-month standardised precipitation index (SPI) scores for an end run-date of May 2016. On the basis of this map, the authors argue that a severe to extreme drought 'appears' to have been experienced in northeastern Mpumalanga, the eastern half of the Free State and northern KwaZulu-Natal.5 It is curious that the authors use such tentative language, when the occurrence of a drought formed the primary basis of their workshop. It is also curious that they did not perform independent climatological analysis, nor present the methodology for SPI calculation conducted by the ARC or justification for the use of a 24-month SPI plot (as opposed to 6- or 12-month plots which are also produced by ARC in their UMLINDI newsletters).
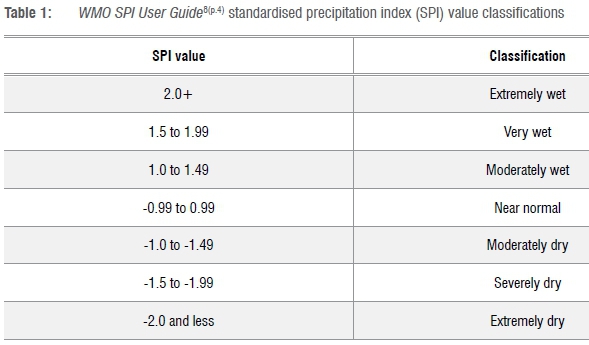
The SPI is one of the most widely used measures of meteorological drought conditions globally6, and, following the Lincoln Declaration7, it has been formally adopted by the World Meteorological Organization (WMO) as the formal metric on which drought conditions should be classified and quantified, with a WMO SPI User Guide published to standardise calculation and interpretation of SPI score8. It is therefore highly appropriate to use the SPI in a workshop on drought and any publications that follow, but such use of the SPI should follow WMO conventions to facilitate comparison of results across WMO member countries. The WMO SPI User Guide groups SPI scores into seven discrete classifications ranging from extremely dry, with scores <-2, to extremely wet, with scores >+2, and with scores ranging from +0.99 to -0.99 classified as near normal (Table 18). A drought event is thereafter declared on the basis of SPI scores of <-1.5, i.e. severely dry conditions.9 The map presented by Swemmer et al.5 is not consistent with the WMO SPI User Guide classifications. The plot discriminates eight rather than seven classifications which span 'extremely wet' to 'extreme drought'.5 There are no SPI values assigned to any of these classifications, so it is not possible to determine whether the upper boundary of 'mild drought' is associated with an SPI score of -1.5, or whether it refers to all SPI scores of less than zero. The plot also contains no classification for normal conditions.
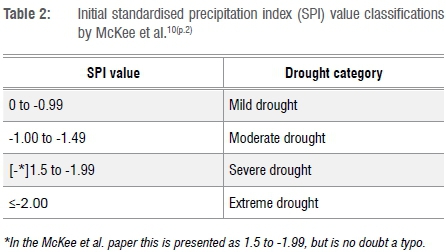
This classification system is reminiscent of the original presentation of the SPI by McKee et al.10 in a 1993 conference proceedings paper (Table 2), which provides four classifications of drought conditions with SPI scores spanning 0 to <-2. However, this first publication predates the Lincoln Declaration, and the initial SPI had been revised in the inter-leading period in terms of both the method of calculation and the classifiers. The re-categorisation in particular followed critiques by leading academics in the domain of drought climatology, such as Prof. Agnew of University College London who wrote 'In McKee's classification…all negative indexes (SPI) are taken to indicate the occurrence of drought; this means for 50% of the time, drought is occurring. This is clearly nonsense!'11. This sentiment was supported by Hayes12, Guttman13 and the US National Drought Mitigation Centre14 among others, which lead to the re-categorisation in the WMO SPI User Guide8. It is curious that this plot uses a classification that has been rejected in published literature and revised in a formal WMO user guide. Unfortunately, as the map uses an outdated classification system with no quantifiable metrics on which a reclassification could be inferred, the definition by Swemmer et al.5 of 2014-2016 as a period of drought cannot be supported by the data presented.
The findings regarding the ecological impacts of rainfall reduction would be more strongly presented if they were coupled by independent climatological analyses, with clearly outlined methodology that is consistent with WMO user guides. The authors themselves express certain reservations with their approach to the measurement of drought in their discussion section:
It was clear that annual rainfall is not a sufficient metric to properly understand, and predict, the ecological impacts of drought. Other metrics such as the length of intervals between rainfall events or the incidence of rain in the dry season, also need to be considered, as well as the effect of higher temperatures […] spatial variability in rainfall also needs to be measured adequately to properly understand the severity of drought.5
Indeed, an analysis of a wider range of climatological variables, the exploration of a wider range of drought definitions including hydrological drought (where dam or river levels are reduced) and agricultural drought (where soil moisture levels decline, often as a function of coupled temperature-precipitation changes) would strengthen their analysis of any drought-related ecological changes.15 A key threat posed by climate change is an increased frequency, intensity and severity of extreme climatic events - it is therefore imperative that we accurately monitor, record and reflect on such hazards.
References
1.Tyson PD, Preston-Whyte RA. The weather and climate of southern Africa. Oxford: Oxford University Press; 2005. [ Links ]
2.Roffe SJ, Fitchett JM, Curtis C. Classifying and mapping rainfall seasonality in South Africa: A review. S Afr Geog J. In press 2019. https://doi.org/10.1080/03736245.2019.1573151 [ Links ]
3.King J, Mitchell S, Pienaar H. Water supply and demand. In: King J, Pienaar H, editors. Sustainable use of South Africa's inland waters. Pretoria: Water Research Commission; 2011. p. 1-16. [ Links ]
4.Easterling DR, Meehl GA, Parmesan C, Changnon SA, Karl TR, Mearns LO. Climate extremes: Observations, modelling and impacts. Science. 2000;289(5487):2068-2074. https://doi.org/10.1126/science.289.5487.2068 [ Links ]
5.Swemmer AM, Bond WJ, Donaldson J, Hempson GP, Malherbe J, Smit IPJ. The ecology of drought - a workshop report. S Afr J Sci. 2018;114(9/10), Art. #5098, 3 pages. https://doi.org/10.17159/sajs.2018/5098 [ Links ]
6.Amin Asadi Zarch M, Sivakumar B, Sharma A. Droughts in a warming climate: A global assessment of standardized precipitation index (SPI) and reconnaissance drought index (RDI). J Hydrol. 2015;526:183-195. https://doi.org/10.1016/j.jhydrol.2014.09.071 [ Links ]
7.World Meteorological Organization. Lincoln Declaration on Drought Indices [document on the Internet]. c2009 [cited 2018 Dec 21]. Available from: http://www.wmo.int/pages/prog/wcp/agm/meetings/wies09/documents/Lincoln_Declaration_Drought_Indices.pdf [ Links ]
8.World Meteorological Organization. Standardised precipitation index user guide. WMO-no. 1090. Geneva: World Meteorological Organization; 2012. [ Links ]
9.Roault M, Richard Y. Intensity and spatial extension of drought in South Africa at different time scales. Water SA. 2003;29(4):489-500. [ Links ]
10.McKee TB, Doesken NJ, Kleist J. The relationship of drought frequency and duration to time scales. Paper presented at: Eighth Conference on Applied Climatology; 1993 January 17-22; Anaheim, CA, USA. [ Links ]
11.Agnew CT. Using SPI to identify drought. Drought Network News. 2000;1:6-12. [ Links ]
12.Hayes MJ. Revisiting the SPI: Clarifying the process. Drought Network News. 2000;18:13-14. [ Links ]
13.Guttman NB. Accepting the standardized precipitation index: A calculation algorithm. J Am Water Resour As. 1999;35(2):311-322. https://doi.org/10.1111/j.1752-1688.1999.tb03592.x [ Links ]
14.NDMC. Drought monitoring: SPI program [software on the Internet]. No date [cited 2018 Dec 20]. Available from: https://drought.unl.edu/droughtmonitoring/SPI/SPIProgram.aspx [ Links ]
15.Duan K, Mei Y. Comparison of meteorological, hydrological and agricultural drought responses to climate change and uncertainty assessment. Water Res Man. 2014;28(14):5039-5054. [ Links ]
 Correspondence:
Jennifer Fitchett
Jennifer.Fitchett@wits.ac.za
Published: 27 March 2019

