


Services on Demand
Article
 English (pdf)
 Article in xml format
 Article references
Indicators

Related links
-
 Cited by Google
 -
 Similars in Google
Share

 Permalink
South African Journal of Science
On-line version ISSN 1996-7489
Print version ISSN 0038-2353
S. Afr. j. sci. vol.115 n.1-2 Pretoria Jan./Feb. 2019
http://dx.doi.org/10.17159/sajs.2019/5146
RESEARCH ARTICLE
The influence of science reading comprehension on South African township learners' learning of science
Angela StottI; Tanya BeeldersII
IOpen and Distant Learning, University of the Free State, Bloemfontein, South Africa
IIComputer Science and Informatics, University of the Free State, Bloemfontein, South Africa
ABSTRACT
The majority of South African township learners have poor reading comprehension skills, which is known to impact negatively on their understanding of content subjects such as science, although the extent of the impact is not fully understood. We explored this impact, as well as the extent to which reading comprehension accounted for the differential effectiveness observed for out-of-class, text-dependent science intervention programmes. Eye movement and mouse-click data were collected from 65 Grade-8 and Grade-9 township learners as they read texts and answered electronic quizzes about electric circuits and lightning on a computer fitted with eye-tracking hardware and software. These data were used to describe the learners' reading and question-answering patterns and derive a composite English for science and technology (EST) reading comprehension index for each learner. Correlations were sought between this index and the learners' Natural Sciences marks and the benefit gained from two previous out-of-school science intervention programmes. Most learners were able to engage meaningfully with a less text-rich, moderately familiar quiz, but there was a prevalence of reading avoidance, guessing and reliance on superficial text features to answer questions for a more text-rich, unfamiliar quiz. Moderate to strong correlations were found between the EST index and both Natural Sciences and intervention marks. The findings suggest that while a significant number of higher achieving township learners possess sufficient levels of EST reading comprehension skills to benefit from text-based interventions, the majority require help in developing EST reading comprehension skills to enhance the likelihood of the intervention's success.
SIGNIFICANCE:
•From this study, we infer that a small group of South African township learners, identifiable by their relatively high Natural Sciences marks, are able to read English science texts with sufficient comprehension to be able to benefit from text-dependent interventions, including engagement with self-study interactive software. The majority, however, read such texts at the frustration level, making it unlikely for interventions to be effective if they rely on the learner being able to engage in independent reading
Keywords: differential intervention effectiveness; English for science and technology; eye tracking; science education; second-language learning
Introduction
The approximately 80% of South African learners who attend the poorer Quintile 1-4 schools, mostly situated in rural and township areas, rank at or near the bottom in international tests of reading comprehension1, as well as of science knowledge2. Promotion of general and subject-specific reading comprehension may well be the key to improving performance in science, because reading with comprehension develops generic cognitive abilities3 and empowers a learner to continue learning from texts beyond periods of class instruction. Minimal possession of such skills, by the majority of South African learners from communities with lower socio-economic status, contributes to the gap that widens over time between lower and higher academic achievers4,5, as skill breeds further skill, whereas weaker learners' learning trajectories may flatten to the point that they attend school without learning6. Further, low teacher content knowledge, large class sizes, low expectations and poor time management in the schools attended by these learners, trap them in their poverty.7 Much money has been spent on intervention programmes aimed at reversing this situation, with little large-scale success8, although small pockets of progress are evident.
Problem statement
The first author has been involved in such intervention programmes for the past 5 years, particularly working towards improving the learning of the natural sciences by Grade 8 and 9 township learners. The differential effectiveness of the intervention programmes she has researched during this time (see for example Stott9) have led to the formulation of the hypothesis explored in this article, namely that learners' ability to read basic English science texts with comprehension determines the extent to which learners benefit from intervention programmes.
The ability to read basic science texts with comprehension could be seen as a basic form of English for science and technology (EST) comprehension. This ability is dependent on general reading comprehension of the language of learning and teaching (LoLT), English in this case, as well as on the learners' understanding of the technical language of science, which includes prior knowledge of concepts relevant to the text and the ability to engage with a denser and more abstract writing style than is used in conversational language or in genres of text such as fiction.10 Although the category of EST is broad, including the language used in science texts beyond school engagement such as theses and academic articles, in this article the term EST is used to refer to the kind of English used in age-appropriate and second-language-appropriate texts intended to help South African learners engage with science and technology learning. Here the term includes the kind of language found in South African science textbooks aimed at these learners and approved by the Department of Basic Education.
The ability to read such texts with comprehension makes it possible for learners to extend learning time by engaging in activities such as reading texts at home, successfully completing homework, writing and reviewing notes and engaging with related software for which technical requirements are present. Effective engagement in such practices is known to enhance learning.11 Provision of timely and appropriate feedback is also known to enhance learning.12 The ability to read with comprehension in a particular language means that written feedback given, for example by a teacher or software, in that language, can result in learning occurring, extending the possibilities of provision of beneficial timely, efficient and personalised feedback. However, the extent to which this feedback is feasible in the South African township school context needs to be established because it appears that many of these learners have such low LoLT skills that they instead need skilful and time-consuming face-to-face guidance by a teacher who mediates dialogue in the vernacular and the LoLT as they help the learner bridge language and conceptual gaps.13
The intervention described in Stott9 provided learners with the opportunity to engage with appropriate software to extend teaching and learning time, and to provide immediate, individualised feedback, beyond that given in the face-to-face sessions. The software used included low-language-demand quizzes as described and argued for in Stott14. Although this intervention model appears to be both time and personnel efficient, the observed differential effectiveness demands a greater understanding of this situation to ensure appropriate allocation of intervention funds in the future. Therefore, we sought to explore the extent to which EST reading comprehension skills may affect science achievement and explain the differential effectiveness of science interventions in the township context, as was observed in these previous studies (e.g. Stott9).
Although it is known that the likelihood of South African township learners passing mathematics can be predicted on the basis of their reading comprehension scores3, we do not know how strongly these learners' science marks correlate with reading comprehension scores. Further, although it is known that English second language learners in South African townships grow up and are educated in text-poor environments1,15 where reading for pleasure is almost non-existent16, that they have poor EST reading comprehension levels, and that they employ superficial textual strategies17, our understanding of what these learners do as they engage with science texts is limited.
A highly effective way to observe learners' engagement with science texts is through the use of eye-tracking equipment, a research methodology as yet underutilised in the South African township context. We made use of such equipment as we sought to answer the research questions: (1) How do South African township learners engage with the reading required to answer gap-fill and multiple-choice electronic science quizzes? (2) To what extent are South African township learners' Natural Sciences marks related to their EST reading comprehension? (3) To what extent is the benefit that relatively high-performing South African township learners gain from after-school science intervention programmes related to their EST reading comprehension?
Conceptual and theoretical framework
According to Gough and Tunmer18, reading comprehension (R) is the product of decoding (D) and language comprehension (C): R = D x C. Decoding refers to the ability to recognise written words and language comprehension refers to understanding the language. Language comprehension involves the formation of three levels of representation of understanding: surface, situation and global representation and models.19 The reader forms a surface representation by understanding the words of a sentence and how they relate to one another. A situation model is formed by integrating successive sentences and a global model through incorporating background knowledge. Formation of situation and global models requires use of inference, knowledge of text structure, employment of comprehension monitoring and considerable working memory usage.20
Becoming a skilled reader takes many years of practice, with development initially requiring a focus on decoding, and later on language comprehension.18 Some people are able to develop the skills of integration, inference and comprehension monitoring needed for developing language comprehension on their own as they practise reading and as their levels of background knowledge, understanding of text structure and metacognitive skills grow with exposure and maturation.19 Others, termed poor comprehenders19 or hyperlexic readers18, tend to 'bark at print'21-23, i.e. decode without comprehension. Unless these learners receive explicit help in developing comprehension skills24,25, they will continue to read at the frustration level26 and will therefore probably employ reading avoidance behaviour, stunting their academic development and reducing the chance of benefitting from intervention programmes4.
Lesiak and Bradley-Johnson26 define reading at the frustration level as having less than 90% decoding accuracy and 60% or lower language comprehension. They identify two reading levels above frustration level: instructional (95% decoding accuracy and 75% comprehension) and independent (98% decoding accuracy and 95% comprehension). Learners reading at the independent level are able to direct their own learning through reading, whereas the likelihood of those at the instructional level doing so would be enhanced if they received reading comprehension instruction.
Interventions, such as the one described in Stott9, which include a component of software engagement, can be undermined by learners' attempts to make progress through the software without engaging in the intended cognitive activity - so-called 'gaming the system'27. Howland et al.28 provide three distinguishing criteria for software usage to promote meaningful learning: it should be used actively, intentionally and constructively. A learner who attempts to game the system may appear active even though their use of the software is random or superficially strategic, rather than involving intentional sense-making central to constructive learning. Eye-tracking equipment has the potential to aid a researcher in making judgements about the difference between activity with or without intentionality.29 Although this method has even successfully been done using complex models which infer cognitive processing30, in this research simple observation of gaze direction was considered sufficient because it revealed a prevalence of blatant attempts to game the system, as is discussed below.
Methods
The study was conducted within a pragmatic paradigm using the frameworks for integrated methodology (FraIM).31 The FraIM is an appropriate methodology for this research because it is flexible and responsive, which was particularly relevant to the iterative process of inductive and deductive analyses engaged in to answer the first two research questions. Although eye-tracking hardware and software has been used to guide inferences about cognitive processing in a number of international studies29, it has never been used to aid the description of English second language learners' engagement with electronic quizzes and derivation of an EST reading comprehension. Therefore a pioneering approach was required, for which the FraIM's pragmatic guidelines are well suited. Within this paradigm, validity is addressed through the concept of warrantable research, which is based on Toulmin's32 argument framework. Warrantable research is internally consistent so that claims can be made transparently and critically in response to the research questions.
The sample
The sample consisted of 65 Grade 8 and 9 learners who attended two schools in Botshabelo, a township approximately 50 km from Bloemfontein, at the time of data collection. The first author had been working as a mentor to the science teachers in these schools for the previous 3 years and was therefore aware of the science material to which the learners had been exposed. A subset (n=50) of these learners was chosen for inclusion in this research because these learners had participated in either or both interventions reported on in Stott9 during the previous year, and/or a yet-unpublished mechanics intervention 6 months before the collection of these data. This subsample was used to answer the third research question. These learners had been included in these interventions because they had been identified by their teachers as the highest achieving learners in their grade, although in reality their Natural Sciences marks ranged widely, from under 20% to 90%. The remainder of the learners (n=15) were conveniently chosen to be included in this research to increase the range of the sample used to answer the other research questions. These learners were those available at the time testing was done. Inclusion in this research was voluntary and accompanied by written assent and consent from the learners and their parents, respectively. Identities are protected through anonymous reporting. Ethical clearance for conducting this research was obtained from the University of the Free State (UFS-HSD2016/1391).
Data collection
An eye tracker is a piece of hardware with specialised software which allows eye movements to be captured while a participant looks at a stimulus. For this study, a Tobii TX300 eye-tracker was used to capture data and Tobii Studio 3.4.5 was used for data extraction and analysis. A screen-capture video, which included the learner's eye movements and mouse clicks, was made and a gaze plot was generated for each learner's individual engagement with the tasks described in the next section. A gaze plot shows the gaze of a participant overlaid on the stimulus. Each dot represents a fixation and the size indicates the duration of the fixation. A fixation is a period of time during which the eye is held relatively still in order to look at an object of interest.33 These videos and gaze plots were analysed to derive a detailed description of each learner's engagement behaviour as well as three reading comprehension sub-scores (for three different task formats) which were combined to form an EST reading comprehension index.
Each learner's Natural Sciences mark for the year was obtained from the school's database. This mark is composed of scores obtained for tests and examinations set by the Department of Education, together with practical work and projects assigned by the teacher, with weightings stipulated by the South African Natural Sciences Curriculum and Policy Statement document.34 These data were used to answer the second research question.
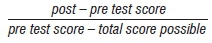
To answer the third research question, the post-test scores (for the interventions referred to previously) of the 50 learners who had participated in the interventions, as well as the normalised gain from pre- to post-tests for these interventions, were used as indicators of the benefit the learners gained from after-school science intervention programmes. Normalised gain corrects for the distortion caused by the greater opportunity to improve associated with a low pre-test score. Normalised gain is calculated as:
Eye-tracking tasks
The eye-tracking tasks are summarised in Table 1. Each of the authors completed a checklist while watching the video of each learner's eye movements and answer choices and examining the learner's gaze plots per screen. The three reading comprehension sub-scores were derived by applying these checklist data and the scores yielded by the software to rubrics, designed for this research, informed by the conceptual framework and explained below. The average of these three reading comprehension sub-scores was taken as the learner's EST reading comprehension index, and was used to indicate the independent variable for Questions 2 and 3.
Figure 1 shows Screen 2, a modified form of a gap-fill quiz which all the learners had had access to earlier in the year, at least in printed form. Each of the drop-down lists provides only two options: more or less. More grammatically correct variations such as most, least, fewer and fewest were waived in favour of greater simplicity and familiarity for the learners. Modifications were made relative to the original quiz which the learners had had access to so as to determine whether superficial recall played any role in the learners' answers. Modification included amending the final statement in a manner which resulted in a less natural wording. The original statement read 'This is because more resistors in parallel are like a thicker pipe which makes current flow more easily', while the modified statement read: 'This is because fewer resistors in parallel are like a thinner pipe which makes current flow less easily.'
Screen 3 consisted of a text about lightning, as well as an accompanying picture illustrating the charge separation within a cloud and resulting polarisation on the ground before lightning strikes. Each learner was instructed to read the text silently and then progress to the next screen. This text was modified from a prescribed Grade 10 Physical Sciences textbook. We can say with confidence that the learners had not seen this particular text before, as the schools these learners attended did not offer Grade 10 and the access these learners have to any books is very limited. The text was modified by shortening and simplifying sentences and analysed using the Flesch-Kincaid measurement, originally developed in 194835 and still widely used as a measurement to ascertain reading difficulty (cf Janan and Wray36). This approach enabled us to diagnose the text as being on a Grade 9 reading level. Because the youngest learners in the sample had just completed Grade 8, this was considered a reasonable level of difficulty. This use of both qualitative justifications, namely the context from which the text was taken and a description of how the text was modified, and a quantitative measurement of readability, is consistent with the view that although quantitative measurements are valuable for their ease of use, they do suffer from a variety of limitations.36
Screen 4 showed the previous screen's text and illustration on the left half of the screen for reference purposes, and four multiple-choice questions on the right half of the screen, each with four options. These multiple-choice questions were designed with at least one choice that had a superficial link between the question and the text. For example, for the question 'Why do you know that conditions are right for lightning if you feel your hair standing up in a storm?', one of the distractors is 'This means that you have a tingling feeling.' This corresponds, superficially, to the text: 'If you ever feel your hair standing up or get a tingling feeling during a storm it could mean charges are moving onto you and you may be in danger of being hit by lightning!'.
The test was administered to each learner individually. As a precaution against learners sharing answers, the questions and their options were rendered randomly each time. This did, however, have the undesired effect of altering the probability each learner had of guessing correctly if they simply picked the first option each time. However, the eye-tracking record enabled us to determine when items were chosen before they had been read, reducing the error caused by fortunate guessing.
The software provided feedback to the learners regarding the correctness of their answers. For the gap-fill quiz this feedback was given when the learner pressed the 'Submit' button. For the multiple-choice quiz, this feedback was given immediately after the learner had selected a choice. The software flagged errors for correction, reduced the learner's score on each incorrect attempt and provided a final mark on correct completion of all the items. All the learners were expected to be familiar with these features as they had been exposed to this kind of software earlier in the year.
EST reading comprehension index
Consistent with a pragmatic research paradigm, the EST reading comprehension index used was designed specifically for this research. Transparency in reporting how each component of this index, as well as the final index, was derived, enables the reader to judge the extent to which the resulting claims are warranted.31 The EST reading comprehension index derived for this research is a five-point scale which is the average of reading comprehension sub-scores 1-3. Each of these sub-scores is designed such that Levels 1-3 refer to behaviours indicative of reading within the frustration level.26 Level 1 refers to reading avoidance behaviour suggesting inability or extreme difficulty even with decoding, with reading comprehension levels below 20%. Level 2 refers to less reading avoidance than Level 1, suggesting that the learner is engaging with decoding, but that either or both of the learner's decoding and language comprehension skills are so poor that the learner engages in guessing without reading for at least some of the time, with reading comprehension levels below 40%. Level 3 refers to the upper section of the frustration level, with no evidence of guessing without reading being observable, suggesting that the learner is decoding the words, but errors in answer choices suggest superficial language comprehension and/or knowledge employment which result in formation of a superficial surface model but faulty situation and global representations. Reading comprehension levels below 60% are included in this level, corresponding to Lesiak and Bradley-Johnson's26 criterion of inclusion in the frustration level of reading. Levels 4 and 5 refer to reading above the frustration level with good (60-80%) and excellent (above 80%) reading comprehension levels observed, respectively. Although decoding accuracy was not measured to enable us to utilise Lesiak and Bradley-Johnson's26 classification system with fidelity, it seems reasonable to label our Levels 4 and 5 as corresponding, at least broadly, to the instructional and independent reading levels, respectively, on the basis of the reading comprehension levels measured.
Sub-scores 1 and 2 were obtained from rubrics which are summarised in the findings section and guided by the principles described above. Sub-score 3 was obtained from the average of the comprehension percentages for the four multiple-choice questions on Screen 4, using the cut-off percentages per level, as given above. The comprehension percentages were obtained as follows: questions answered by guessing without reading, as inferred from the eye movements, were assigned 0%; and other questions were assigned 100% if the correct answer was obtained on the first attempt, with 25% deducted for every successive attempt.
Data analysis
The checklists and descriptions of each learner's reading and quiz-engagement behaviour were analysed qualitatively using summarising descriptions guided by Question 1. To answer Questions 2 and 3, respectively, Pearson's regression value was calculated between the EST reading comprehension index and: (1) the learners' Natural Sciences mark and (2) the post-test score and the normalised gain obtained in the relevant interventions. For all analyses, r>0.6 was taken as showing strong correlation, 0.6-0.3 as moderate, 0.1-0.3 as weak and r<0.1 as no correlation; p<0.01 shows statistical significance. Additionally, the data were represented in manners which aid comprehension of trends within the data as guided by the research questions.
Results
Quiz engagement
Metrics of the participants' eye movements are discussed in detail in a related article23 in which we used the same data set to pursue an understanding of the eye-movement characteristics of barking at print. There are slight discrepancies in the numbers between these two articles because of the different focus of each, coupled with some gaps in the data, dictating slightly different participant exclusion from the original even larger sample.
Table 2 shows the number of learners assigned to each category for reading comprehension sub-score 1, derived from the task which was moderately familiar to the learners. Only one learner answered all the questions correctly. This learner is referred to as Sifiso, and was the only learner to attain a deep level of understanding in the intervention described in Stott9. The unnatural wording of the final question, unsurprisingly, caused difficulty for all the remaining learners. Five of the learners categorised as being fluent (Level 4) completed the final question in the manner to be expected from a natural wording, i.e. as in the original wording, before even reading the full sentence. The remainder of learners seemed to notice the changed format of the sentence, halted in their reading and, in most cases, read the sentence more than once.
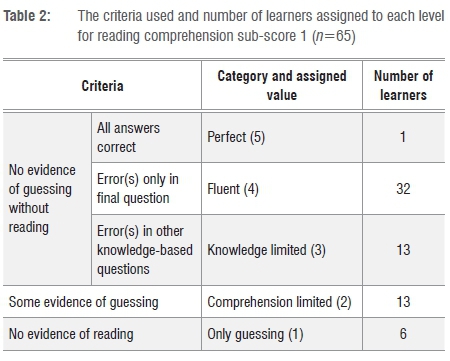
The 13 learners classified as having limited knowledge (Level 3) correctly answered the questions based directly on the diagrams, i.e. related to the relative numbers of resistors in each. However, they made errors in knowledge-based questions linking relative numbers of resistors in parallel to relative resistance. The 13 learners classified as displaying limited reading comprehension as a consequence of showing evidence of some guessing (Level 2) displayed systematic eye movement across the text, and movement of the eyes between the text and the diagrams for much of the time, suggesting some engagement in decoding and a search for language comprehension. However, they answered some of the questions without having read enough of the text to be able to answer from comprehension and/or they incorrectly answered the questions based directly on the diagrams. The six learners classified as having only guessed (Level 1) showed no systematic eye movements across the text or the diagrams. Instead, the options were the only parts of the screen to which they apparently directed their eyes with purpose. Three of these learners did not even address the options in the normal reading sequence, i.e. from left to right within a row, and from top to bottom between rows.
Two of the six learners who showed no evidence of reading for Screen 2's task also showed no evidence of reading for any of the other screens, despite telling us that they had finished reading. These two learners moved their eyes randomly across the reading passages and guessed the answers to the questions without apparently reading anything on the screen. Figure 2 is a gaze plot for one of these learners. For the purpose of comparison, the gaze plot of the highest achieving learner, referred to as Sifiso, is given in Figure 3. Surprisingly, one of the learners who showed no evidence of reading had been chosen as one of the top 30 learners in her class to participate in the intervention described in Stott9. However, her inclusion seems to have been a result of a selection error, because her failing Natural Sciences mark of 17% does not place her in the top 30. Unsurprisingly, she gained little from the intervention, being classified in the 'little memory' category with a post-test score of 6%. An additional 10 learners appeared to read and skip chunks of text alternately, moving their eyes randomly for some of the time, and systematically tracking blocks of text for the rest of the time.
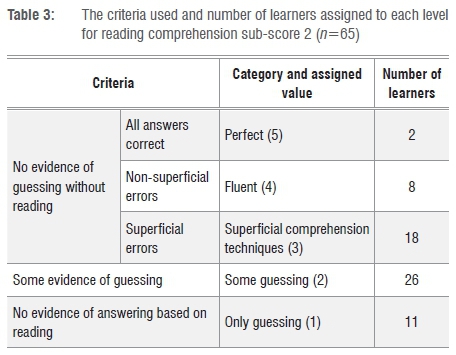
As shown in Table 3, more than half (37) of the learners guessed, without reading, at least one answer, 11 of whom guessed all four answers for the multiple-choice questions on Screen 4. The majority of the remaining learners18 made at least one choice based on superficial correspondence between the distractor and the text, for example, choosing the option about tingling, described earlier.
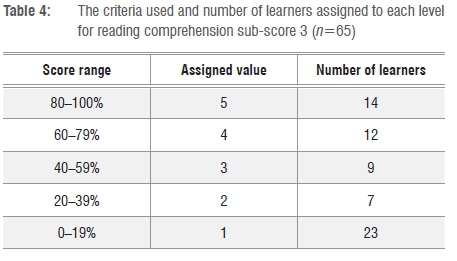
The third reading comprehension sub-score assigned to each learner is determined by the score they obtained for the multiple-choice quiz on Screen 4, as explained previously. As can be seen in Table 4, just less than half of the learners30 achieved under 40%, with a fairly large group14 achieving over 80%.
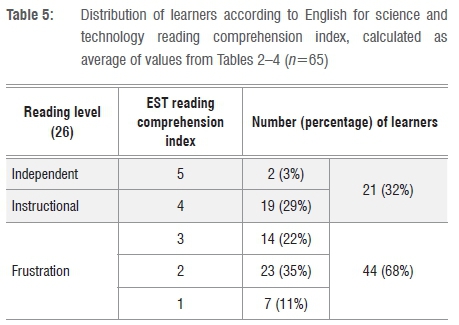
An EST reading comprehension index was calculated for each learner as the average of the three values given in Tables 2-4, respectively. This index is used to answer Questions 2 and 3. As shown in Table 5, 68% of the learners were classified as reading science texts at the frustration level, with just under half the learners30 being rated at Levels 1 or 2, which suggests poor decoding skills in addition to poor language comprehension, as evidenced by reading avoidance and answer-guessing without reading.
EST reading comprehension and science marks
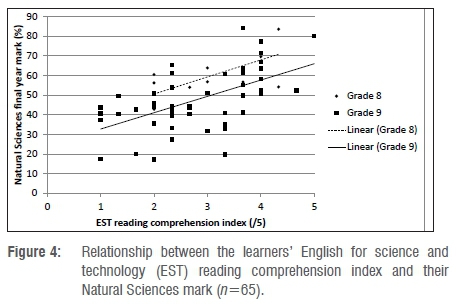
Figure 4 shows the learners' EST reading comprehension index, determined in November 2016 in the manner previously described, plotted against their Natural Sciences 2016 end of year mark. A strong correlation of r=0.60 was found, with p<0.01. All of the learners assigned reading comprehension indices of 4 and 5, and therefore considered to be reading at the instructional and independent levels, scored 50% or higher for Natural Sciences.
EST reading comprehension and intervention benefit
Figure 5 shows the reading comprehension index plotted against the post-test scores obtained by the 50 learners who were involved in either or both of the science previously referred to. Of the 92 learners who had participated in the Electricity intervention, and 27 who had participated in the Mechanics intervention, 43 and 16, respectively, were available for the reading comprehension test. Nine of those tested for reading comprehension had participated in both interventions. These learners have been counted and represented separately for each of the interventions in both the statistics given below and in Figure 5.
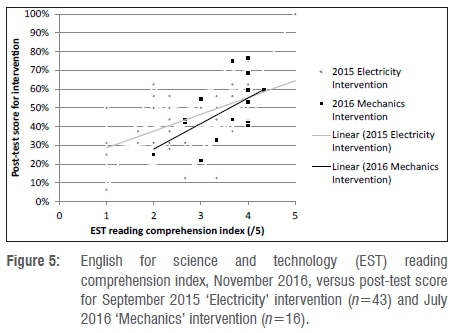
A moderate and significant correlation was found between the score obtained at the end of the intervention and the reading comprehension index (r=0.54; p<0.01). A similar correlation was found between the normalised gain for the intervention and the reading comprehension index (r=0.55, p<0.01). The mean reading index for those learners (n=19) who scored below 40% in these post-tests (M=2.5, SD=0.9) falls within the frustration level, whereas the mean for the learners (n=40) who scored above 40% (M= 3.3, SD=0.9) is slightly above the frustration level. All the learners with reading comprehension indices of 4 and 5, and therefore considered to be reading at the instructional and independent levels, scored 40% or higher for the intervention post-tests and exhibited normalised gains of 0.17 (17%) or higher. However, as Figure 5 and the relatively large standard deviation values show, there is a fair amount of variation in the data for learners having a reading comprehension index below 4.
Discussion
Quiz engagement
The high proportion of learners with poor reading comprehension skills is consistent with findings from benchmarking tests such as PIRLS24,25, as well as a number of other South African studies3,37,38. In this study, 68% (44/65) of the learners in this relatively strong sample were classified as reading at the frustration level for Grade 9 level science texts, with almost half (30/65) of the learners assigned reading comprehension indices of 1 or 2 (out of 5). These indices correspond to at least some answer-guessing without reading, suggesting possible difficulty even with word decoding. This corresponds to Pretorius and Spaull's39 findings of poor decoding skills among the majority of South African township learners. A considerable number of learners (11) guessed all the multiple-choice questions without reading and two did not show any evidence of engaging in any word decoding. Only 10 of the 65 learners were not observed to guess answers, either by answering without reading or on the basis of superficial textual features. This observation is consistent with Dempster's17 findings of much use of superficial text-based strategies when South African English second language learners answered science questions for the Trends in International Mathematics and Science Study (TIMSS). These strategies included choosing options with familiar words or words present in both the text and the answer options. This shows that the danger of engaging in strategies to 'game the system'27 is considerable for text-heavy software. This danger seems to have been considerably reduced for the shorter, more familiar quiz (Screen 2).
Learners who read at the frustration level tend not to engage in self-regulated learning which extends beyond contact with the teacher.26 However, such self-study is vital for a township learner to be able to mitigate the poor class time usage, limited and low-quality teacher-learner contact time, limited and sporadic homework assignment and control and general dysfunctionality of the typical township school.40 These suggest that good reading comprehension is most needed in the very environments which least foster it. The finding that there was a higher prevalence of reading avoidance and guessing for the less familiar, text-heavy quiz than the more familiar, less text-heavy quiz is unsurprising and illustrates the limitation which a low ability to read with comprehension imposes on effective learning of more complex science concepts.41
EST reading comprehension and science marks
The strong correlation found between EST reading comprehension and the learners' Natural Sciences mark extends Pretorius's3 finding that reading comprehension is a good predictor of whether learners are able to pass mathematics. This extension is both to the context of science and with respect to giving greater detail about the relationship between reading comprehension and school marks. It should be noted, however, that we measured EST reading comprehension, which can be expected to be more strongly correlated to science performance than may have been found had fictional texts been used.
EST reading comprehension and intervention benefit
The quiz-engagement patterns help explain the moderate correlation found between learners' reading comprehension and the benefit which they gained from the after-school interventions. Both interventions required engagement with texts in the form of electronic quizzes and/or paper-based reading. The sample includes nine of the learners who were described in Stott9 as being able to learn new concepts from science software before being taught these concepts by a teacher. These learners were all classified as reading above the frustration level, with a reading comprehension index mean of 4 and a range from 3.7 to 5. In contrast, the first author's general experience of working with township learners using science quiz and audiovisual software is that besides a small number of the most academically strong, the learners seem only to gain significant benefit from the software when it is used to revise work which has already been taught and practised in class. This observation is consistent with Probyn's42 findings regarding such learners' dependence on the language-bridging practices of a skilful teacher.
Limitations
Reading comprehension is a complex skill which is difficult to measure validly. Each of the three sub-scores used to calculate the reading comprehension index addressed a somewhat different aspect of reading comprehension and the criteria used to assign each value have been stated. Both researchers rated the learners independently, with Cohen's kappa inter-rater indices of over 0.8. Despite these measures to enhance the validity of the reading comprehension index used, subjective judgement could not be avoided. Also, although the eye-tracking software facilitates the detection of cases in which learners guess without reading, it is not always possible to detect such behaviour. Further, a weakness of using a rating system is that it suggests that the distance between successive categories is equal, which is certainly not the case here.
Conclusion
Improvement of reading comprehension by improving the teaching of decoding skills and through the explicit teaching of reading comprehension strategies, is sorely needed in South African township schools. For learners who are unable to comprehend the language, and in many cases even lack the ability to decode the words used in software and handouts employed in after-school interventions, such interventions are likely to become exercises in 'gaming the system', which leads to minimal learning. The time, effort and expense invested in placing such learners into such programmes would be better spent, for example, in teaching those learners reading comprehension skills or offering their place to a learner whose reading comprehension skill enables them to benefit from the programme. The strong correlation found between EST reading comprehension and Natural Sciences marks suggests that these marks could be used as a fairly reliable and easily obtainable proxy for EST reading comprehension within the township school context.
In this study, we have shown that there are considerable numbers of learners (32% of this relatively strong sample) in the township context who are able to comprehend EST texts above the frustration level despite having been schooled in an environment which is generally unfavourable to the development of reading comprehension. For these learners, at least, interventions which include text-dependent components such as engagement with electronic software, does seem a viable supplement to the education they receive in their schools as long as appropriate access and motivation can be provided.
Acknowledgement
We thank Fred Lubben for reviewing drafts of this manuscript.
Authors' contributions
A.S.: Conceptualisation, data analysis, writing the first draft. T.B.: Conceptualisation, data collection, data analysis, critically reviewing the writing.
References
1.Howie SJ, Combrinck C, Roux K, Tshele M, Mokoena GM, McLeod PN. PIRLS Literacy 2016 progress in International Reading Literacy Study 2016: South African children's reading literacy achievement. Pretoria: Centre for Evaluation and Assessment, 2017. [ Links ]
2.Reddy V, Visser M, Winnaar L, Arends F, Juan A, Prinsloo C, et al. TIMSS 2015: Highlights of mathematics and science achievement of grade 9 South African learners. Pretoria: Human Sciences Research Council, 2016. [ Links ]
3.Pretorius EJ. Reading ability and academic performance in South Africa: Are we fiddling while Rome is burning? Lang Matters. 2002;33(1):169-196. https://doi.org/10.1080/10228190208566183 [ Links ]
4.Pretorius EJ, Currin S. Do the rich get richer and the poor poorer?: The effects of an intervention programme on reading in the home and school language in a high poverty multilingual context. Int J Educ Dev. 2010;30(1):67-76. https://doi.org/10.1016/j.ijedudev.2009.06.001 [ Links ]
5.Spaull N, Kotze J. Starting behind and staying behind in South Africa: The case of insurmountable learning deficits in mathematics. Int J Educ Dev. 2015;41:13-24. https://doi.org/10.1016/j.ijedudev.2015.01.002 [ Links ]
6.Muralidharan K, Zieleniak Y. Measuring learning trajectories in developing countries with longitudinal data and item response theory. Paper presented at: Young Lives Conference; 2013 July 8-9; Oxford, UK. [ Links ]
7.Spaull N. Schooling in South Africa: How low-quality education becomes a poverty trap. S Afr Child Gauge. 2015;12:34-41. [ Links ]
8.Bayat A, Louw W, Rena R. The impact of socio-economic factors on the performance of selected high school learners in the Western Cape Province, South Africa. J Hum Ecol. 2014;45(3):183-196. https://doi.org/10.1080/09709274.2014.11906692 [ Links ]
9.Stott AE. The effectiveness of a conceptually focused out-of-class intervention on promoting learning of electricity by township learners. Afr J Res Math Sci Technol Educ. 2017;21(3):304-315. https://doi.org/10.1080/18117295.2017.1371981 [ Links ]
10.Parkinson J. English for science and technology. In: Paltridge B, Starfield S, editors. The handbook of English for specific purposes. Oxford: John Wiley & Sons; 2013. p. 155-173. [ Links ]
11.Jez SJ, Wassmer RW. The impact of learning time on academic achievement. Educ Urban Soc. 2015;47(3):284-306. https://doi.org/10.1177/0013124513495275 [ Links ]
12.Van der Kleij FM, Feskens RC, Eggen TJ. Effects of feedback in a computer-based learning environment on students' learning outcomes: A meta-analysis. Rev Educ Res. 2015;85(4):475-511. https://doi.org/10.3102/0034654314564881 [ Links ]
13.Probyn MJ. Pedagogical translanguaging: Bridging discourses in South African science classrooms. Lang Educ. 2015;29(3):218-234. https://doi.org/10.1080/09500782.2014.994525 [ Links ]
14.Stott AE. Are instructivist pedagogies more appropriate for learning the sciences in South African low-quintile schools than Western literature suggests? J Educ. 2018;71:39-57. https://doi.org/10.17159/2520-9868/i71a03 [ Links ]
15.Pretorius EJ, Mampuru DM. Playing football without a ball: Language, reading and academic performance in a high-poverty school. J Res Read. 2007;30(1):38-58. https://doi.org/10.1111/j.1467-9817.2006.00333.x [ Links ]
16.Wafawarowa B. Book development policies in Africa. Meta-info bulletin. 2000;9(4):15-16. [ Links ]
17.Dempster ER. Textual strategies for answering multiple choice questions among South African learners: What can we learn from TIMSS 2003? Afr J Res Math Sci Technol Educ. 2007;11(1):47-60. https://doi.org/10.1080/10288457.2007.10740611 [ Links ]
18.Gough PB, Tunmer WE. Decoding, reading, and reading disability. Remedial Spec Educ. 1986;7(1):6-10. https://doi.org/10.1177/074193258600700104 [ Links ]
19.Cain K. Reading development and difficulties. Oxford: John Wiley & Sons; 2010. [ Links ]
20.Swanson HL, Howell M. Working memory, short-term memory, and speech rate as predictors of children's reading performance at different ages. J Educ Psychol. 2001;93(4):720. https://doi.org/10.1037/0022-0663.93.4.720 [ Links ]
21.Samuels SJ. Reading fluency: Its development and assessment. In: Farstrup AE, Samuels SJ, editors. What research has to say about reading instruction. Newark, DE: International Reading Association; 2002. p. 166-183. [ Links ]
22.Applegate MD, Applegate AJ, Modla VB. 'She's my best reader; she just can't comprehend': Studying the relationship between fluency and comprehension. Read Teach. 2009;62(6):512-521. https://doi.org/10.1598/RT.62.6.5 [ Links ]
23.Beelders T, Stott A. Eye movements during barking at print. In: Lopez-Orozco F, editor. Eye tracking and new trends. London: IntechOpen. In press 2018. [ Links ]
24.Zimmerman L, Smit B. Profiling classroom reading comprehension development practices from the PIRLS 2006 in South Africa. S Afr J Educ. 2014;34(3), Art. #962, 9 pages. https://doi.org/10.15700/201409161101 [ Links ]
25.Van Staden S, Bosker R. Factors that affect South African reading literacy achievement: evidence from prePIRLS 2011. S Afr J Educ. 2014;34(3), Art. #838, 9 pages. https://doi.org/10.15700/201409161059 [ Links ]
26.Lesiak J, Bradley-Johnson S. Reading assessment for placement and programming. Springfield: Charles C Thomas; 1983. [ Links ]
27.Muldner K, Burleson W, Van de Sande B, VanLehn K. An analysis of students' gaming behaviors in an intelligent tutoring system: Predictors and impacts. User modeling and user-adapted interaction. 2011;21(1-2):99-135. https://doi.org/10.1007/s11257-010-9086-0 [ Links ]
28.Howland JL, Jonassen DH, Marra RM. Meaningful learning with technology. Upper Saddle River, NJ: Pearson; 2012. [ Links ]
29.Alemdag E, Cagiltay K. A systematic review of eye tracking research on multimedia learning. Comput Educ. 2018;125:413-428. https://doi.org/10.1016/j.compedu.2018.06.023 [ Links ]
30.D'Mello SK, Mills C, Bixler R, Bosch N. Zone out no more: Mitigating mind wandering during computerized reading. In: Hu X, Barnes T, Hershkovitz A, Paquette, L, editors. Proceedings of the 10th International Conference on Educational Data Mining; 2017 June 25-27; Wuhan, China. Worcester, MA: International Educational Data Mining Society; 2017. p. 8-15. [ Links ]
31.Plowright D. Using mixed methods: Frameworks for an integrated methodology. London: Sage Publications; 2011. [ Links ]
32.Toulmin S. The uses of argument. New York: Cambridge University Press; 1958. [ Links ]
33.Rayner K. Eye movements in reading and information processing: 20 Years of research. Psychol Bull. 1998;124(3):372. https://doi.org/10.1037/0033-2909.124.3.372 [ Links ]
34.South African Department of Basic Education (DBE). Natural sciences curriculum and policy statement. Pretoria: DBE; 2011. [ Links ]
35.Flesch R. A new readability yardstick. J Appl Psychol. 1948;32(3):221-233. https://doi.org/10.1037/h0057532 [ Links ]
36.Janan D, Wray D. Readability: The limitations of an approach through formulae. Paper presented at: BERA Annual Conference; 2012 September 4-6; Manchester, England. [ Links ]
37.Spaull N. South Africa's education crisis: The quality of education in South Africa 1994-2011. Report commissioned by CDE. Johannesburg: Centre for Development & Enterprise; 2013. [ Links ]
38.Klapwijk NM. Reading strategy instruction and teacher change: Implications for teacher training. S Afr J Educ. 2012;32(2):191-204. https://doi.org/10.15700/saje.v32n2a618 [ Links ]
39.Pretorius EJ, Spaull N. Exploring relationships between oral reading fluency and reading comprehension amongst English second language readers in South Africa. Read Writ. 2016;29(7):1449-1471. https://doi.org/10.1007/s11145-016-9645-9 [ Links ]
40.Van der Berg S, Spaull N, Wills G, Gustafsson M, Kotzé J. Identifying binding constraints in education. Stellenbosch: Department of Economics, University of Stellenbosch; 2016. [ Links ]
41.Rollnick M. Current issues and perspectives on second language learning of science. Stud Sci Educ. 2000;35(1):93-121. [ Links ]
42.Probyn M. Pedagogical translanguaging: Bridging discourses in South African science classrooms. Lang Educ. 2015;29(3):218-234. https://doi.org/10.1080/09500782.2014.994525 [ Links ]
 Correspondence:
Angela Stott
stottae@ufs.ac.za
Received: 22 May 2018
Revised: 20 Aug. 2018
Accepted: 31 Oct. 2018
Published: 30 Jan. 2019

