


Serviços Personalizados
Artigo
 Inglês (pdf)
 Artigo em XML
 Referências do artigo
Indicadores

Links relacionados
-
 Citado por Google
 -
 Similares em Google
Compartilhar

 Permalink
South African Journal of Science
versão On-line ISSN 1996-7489
versão impressa ISSN 0038-2353
S. Afr. j. sci. vol.115 no.1-2 Pretoria Jan./Fev. 2019
http://dx.doi.org/10.17159/sajs.2019/4793
RESEARCH ARTICLE
Palaeotopography of a Palaeolithic landscape at Bestwood 1, South Africa, from ground-penetrating radar and magnetometry
Konstantinos S. PapadimitriosI; Carl-Georg BankI; Steven J. WalkerII; Michael ChazanIII, IV
IDepartment of Earth Sciences, University of Toronto, Ontario, Canada
IIDepartment of Archaeology, University of Cape Town, Cape Town, South Africa
IIIDepartment of Anthropology, University of Toronto, Ontario, Canada
IVInstitute of Evolutionary Studies, University of the Witwatersrand, Johannesburg, South Africa
ABSTRACT
In order to investigate the buried landscape at the Fauresmith locality of Bestwood 1, outside the town of Kathu in the Northern Cape Province, we performed ground-penetrating radar and magnetometry surveys across the sand-filled central portion of the valley. The radar images a strong continuous reflector which we can assign to the boundary between the Kalahari sands and underlying Banded Ironstone Formation gravels. Moreover, the thickness of the sand delineates a buried depression in the centre of the valley with flat plateaus at the sides. Subtracting the sand thickness from the current topography produces a map of a small stream channel in the northern part of the valley. Analysis of the magnetic gradient data allows us to extend this buried channel further to the south. Our geophysical survey provides a valuable contribution towards understanding the context of hominin occupation along the banks of a small stream in the Kathu Complex.
SIGNIFICANCE:
•We provide an example of combining two geophysical methods to map overburden thickness, useful for archaeological landscape interpretation
Keywords: archaeology; geophysical survey; Fauresmith; human evolution; landscape archaeology
Introduction
The Kathu Complex is a series of archaeological localities - Kathu Pan, Kathu Townlands and Bestwood - that together represent evidence of extraordinarily intensive occupation through the Earlier Stone Age (Acheulean) and the transitional Earlier Stone Age to Middle Stone Age (Fauresmith).1-4 The sheer scale of these localities is unusual and poses challenges for both research and conservation.
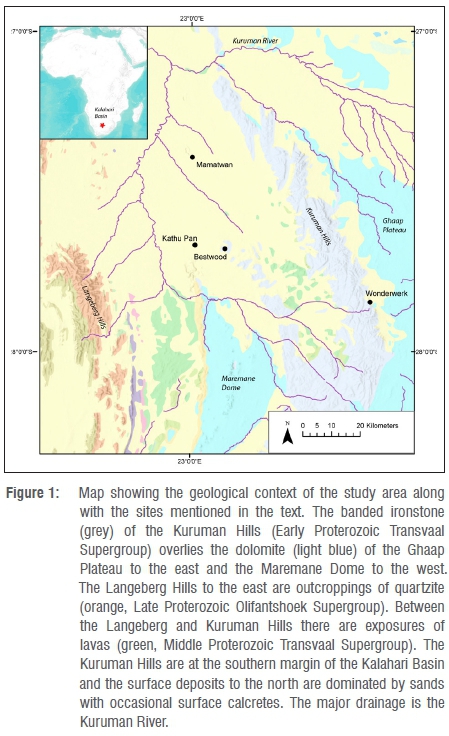
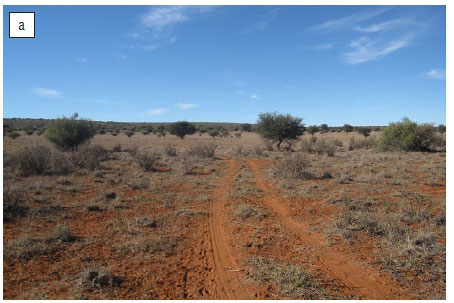
In the research presented here, ground-penetrating radar (GPR) and magnetic gradiometer surveys were conducted to create a 3D subsurface map of the buried Pleistocene landscape at the site of Bestwood 1. GPR was used to map and define subsurface boundaries while gradiometer data, correlated to depth from GPR data, were used to increase the extent of mapping. The study site, Bestwood 1 (27°42′S 23°03′E, UTM zone 34 S), is situated in a south-facing valley in an isolated hill infilled with Kalahari sands. This hill is located at the western edge of the Kuruman Hills where this formation grades into the southern edge of the Kalahari Basin3,4 (Figure 1). The sandy base of the valley is mostly level over its entire north-south extent of 2.8 km (Figure 2a). Valley walls slope gently and are composed of Banded Ironstone Formation (BIF) bedrock overlain by scree consisting of flat weathered slabs of BIF that includes large numbers of stone tools. The stone tools found within the exposed scree are heavily weathered. The boundary between the scree deposits on the hill slopes and the sand infill is gradual and sand has infiltrated between the BIF slabs in the lower slopes.


Quarrying for sand and gravel at the southern end of the valley has exposed a stratigraphic sequence of Kalahari sands with a depth of 2-3 m overlying a deep deposit of BIF gravels extending to a depth of at least 15 m. The interface between the two stratigraphic units is sharp although there is some infiltration of sand into the top of the gravel unit and small fragments of BIF in the sands (Figure 2b).
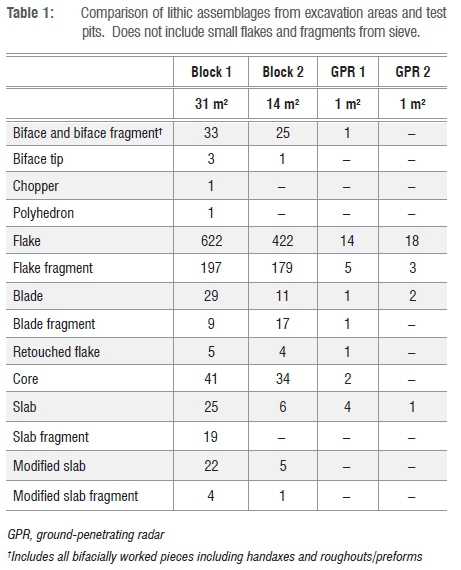
Excavations in two areas 100 m apart in a sand quarry at the south end of the valley have exposed large surfaces (31 m2 in the eastern Block 1 excavation and 14 m2 in the western Block 2 excavation) blanketed by artefacts characteristic of the Fauresmith industry (Figure 2c). In both areas the artefacts lie at the interface between the Kalahari sands and underlying gravels. Unlike the artefacts found on the hill slopes, those found in the quarry excavation are in good condition with virtually no weathering. These artefacts show little to no signs of mechanical damage such as rounded or chipped edges and rarely evidence of differential patination on surfaces. The artefacts are found in a single horizon with some artefacts embedded in clays at the top of the underlying gravel horizon (Figure 2b). There is no 'stacking' of objects and artefacts are mostly lying horizontally. Because of the scale of occupation, the Bestwood 1 occupation cannot be considered a clearly bounded archaeological site and is best treated as a palaeotopography of early human occupation. There is no current evidence of areas of high density of artefacts amidst a background of low density, the so-called 'scatter and patches', but rather what emerges is a fairly continuous density of artefacts across the excavated areas (see comparison of excavation areas in Table 1). Given that the entire area of the surveyed valley is about 2.8x0.4 km, and that to date similar densities of artefacts have been found in all areas tested, the potential scale of hominin occupation is massive. The goal of the geophysical survey was to create a 3D map of the contact between the gravels and the overlying sands across the entire valley and thus to determine the morphology of the potential landscape of hominin occupation.
Methodology
Both ground-penetrating radar and magnetometry surveys were undertaken across the sand-filled central portion of the valley. Based on the results of the geophysical survey, two test pits were excavated to determine the accuracy with which the survey identified the boundary between the gravels and the sands and whether the archaeological evidence of hominin occupation extends beyond the area of the sand quarry at the southern end of the valley.
Ground-penetrating radar
The GPR surveys were conducted using a GSSI SIR-3000 connected to a 200-MHz centre frequency antenna with attached survey wheel (Geophysical Survey Systems Inc., Nashua, New Hampshire, USA). Traces were recorded every 50 mm in two-way travel time (TWTT, in nanoseconds) along profiles by moving the GPR antenna in as straight a line as was possible. Starting and ending coordinates of each line were recorded using a Garmin eTrex Legend H handheld GPS (Garmin International Inc., Olathe, Kansas, USA). to a stated accuracy of ±4 m. Surveys were conducted both along the length of the valley and across its width and included both sand- and cobble-covered portions of the valley slopes; in addition, we collected data from two 20x20 m grids with 0.5x0.5 m and 0.5x1 m line spacing (Figure 3). All post-collection work including the displaying of radargrams was performed in MATLAB.
Magnetics
Magnetics data were collected using a GSM-19GW proton precession gradiometer (GEM Systems, Markham, Ontario, Canada). Data were collected predominantly on the sand-covered valley floor and the base of slopes (Figure 3). Data locations were determined using the instrument's built-in GPS (location accuracy ±5 m from repeat readings). Magnetic surveys were done independently of the GPR surveys; that is, they are not along exactly the same profiles. Magnetics data were transformed in an attempt to quantify signal variability across the valley for correlation to sand thickness derived from GPR, through two methods: pseudo-amplitude and wavelength.
Pseudo-amplitude
A measurement of the pseudo-amplitude of the gradient signal was determined based on the fact that as distance increases from a magnetic source the amplitude of the magnetic anomaly will decrease.5 A moving window of 50-m width was used to calculate the range of the data at 10-m intervals. As magnetic gradient strength declines with the fourth power of distance, we applied a transformation of 1^(-1/4) to the moving window outputs to create a depth analogue.
Wavelength
We chose to extract signal wavelength from the gradient data as distance from a magnetic source controls the wavelength of the anomaly. Data were resampled to an equal step distance and an S-transform was applied. The S-transform uses a scalable Gaussian moving window and fast Fourier transform (FFT) to return the data in a distance-wavenumber representation.6 Wavenumber is then converted to wavelength where wavelength is simply 1/wavenumber and the maximum contributing wavelength to gradient signal at a distance is used for correlation.
Test pit excavation
True sand thickness for the GPR lines was first calculated based on a dielectric range of 3-5 which is appropriate for dry sand.7 To refine the dielectric range and thus the mapping of the reflector, we excavated one 1x1 m test pit in each of the two radar grids (Figure 3). Locations for test pits were chosen based on relatively low TWTT in nanoseconds. A second goal of these test pits was to test the extent of the distribution of artefacts beyond the archaeological exposures in the sand mine at the southern end of the valley. Pits were excavated by hand and excavation was halted when artefact surface and dense gravel was reached. Artefacts were recovered and large artefact distribution was mapped. We noted no groundwater in the sand, neither in the test pits nor in the sand mine. From that observation we infer that any groundwater would drain into the gravel layer, and that the dielectric constant would not change within the sand layer, thus allowing for straightforward conversion from TWTT to depth.
Results
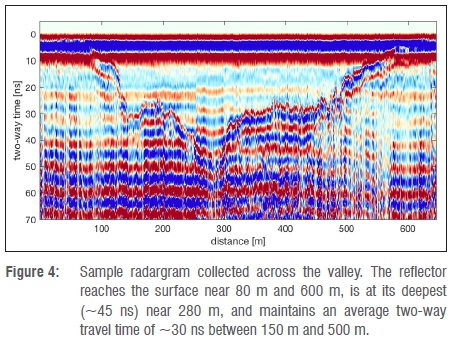
The GPR transects produced a clear signal of the contact between the Kalahari sands and the underlying gravels. Most radargrams revealed a strong, continuous reflector at depth (Figure 4). In radargrams that cross the valley from slope to slope this reflector is first noticed barely downslope of the transition from scree-dominated ground cover to sand cover. The reflection then increases in depth towards the valley centre to a maximum depth and then decreases in depth towards the other slope, terminating just prior to the sand scree interface. Based on this evidence we interpret the reflector to be the transition between the overlying sand and a continuous layer of underlying gravels.
In both test units, similar densities of artefacts to those recovered in the archaeological exposures were found at the interface between the sands and the underlying gravel unit (Table 1). These artefacts are in fresh condition and typologically consistent with the Fauresmith. Depths to the termination of the sand layer were recorded and velocity was calculated to be 15 cm/ns averaged between the two pits which is equivalent to a dielectric constant of 5.
In order to visualise the shape of the reflector (the top of the gravel unit) in three dimensions, a series of manual picks were defined along each radargram. These points define the TWTT to the reflector at a given distance along the profile and the easting and northing coordinates of that point. These points are then combined into a mesh and extrapolated to create a map of the vertical extent of the sand layer in TWTT. Travel times can be converted to depth using

where ν is the velocity of the radar wave, c is the speed of light in a vacuum, and ε is the dielectric constant of the medium through which the wave is passing.8 Depth to a reflection is then one half the travel time multiplied by the velocity in nanoseconds.
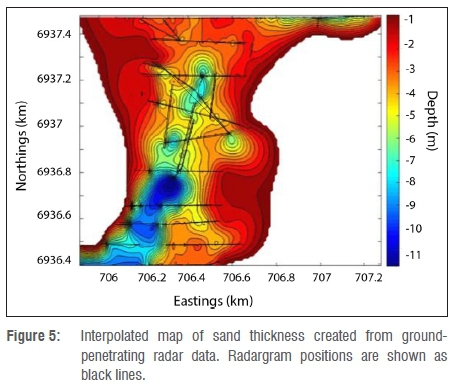
The map of TWTT describing sand thickness was converted to a map of the true thickness of sand, or a map to the top of the reflective boundary, using the velocity determined using the dielectric constant of 5 derived from the test excavations (Figure 5). Two main features are revealed in this image. First, there is an elongate portion of higher than average sand thickness which runs north-south through the valley increasing in thickness to the south. Second, this thick sand region is flanked on both sides by sand of moderate thickness which thins the closer the map approaches to the valley slopes.
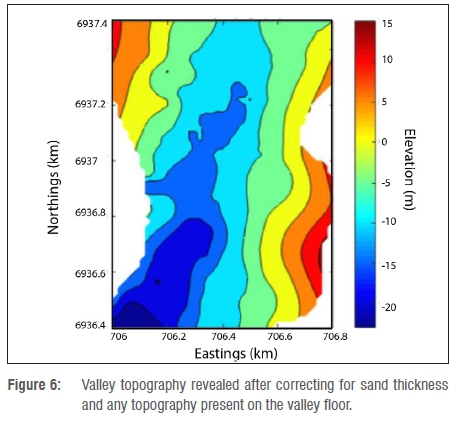
Relative elevation data were collected using a Leica TC series total station (Geosystems AG, Heerbrugg, Switzerland). Elevations across the valley were similarly gridded to GPR data. We then subtracted the values of sand thickness from those of the elevation data to create a map of what the topography of the valley would have looked like before the sands accumulated (Figure 6). These elevation-corrected data accentuate the features of the sand thickness map. The elongate region of high sand thickness is shown to be a more continuous depression and also takes on an element of sinuosity. Flanking the depression are two wide regions of elevation ranging from -5 m to 0 m. These mid-elevation plateaus terminate near the valley slopes where the elevation gradient increases sharply.
Magnetics
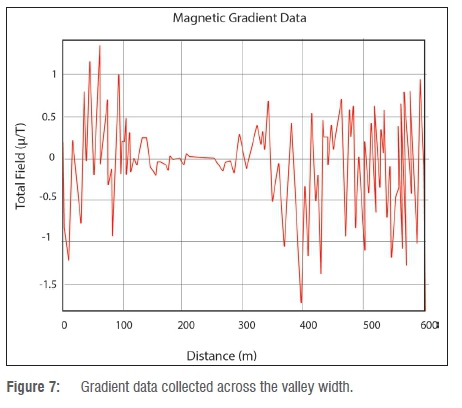
Gradient data show high signal variability over thinner sand and a steadier signal near the centre of the valley (at 150-300 m profile distance) where sand is thicker based on the GPR data (Figure 6). The pseudo-amplitude (PA) data differ from the depth data derived from GPR significantly in that they do not capture the increase in sand thickness from 350 m to 550 m. However, both data sets observe similar looking trends towards their minima: the lowest PA value of approximately -0.31 is at 250 m occurring 50 m sooner than its GPR counterpart (Figure 7) because the origin of the magnetic profile is shifted compared to that of the GPR line.
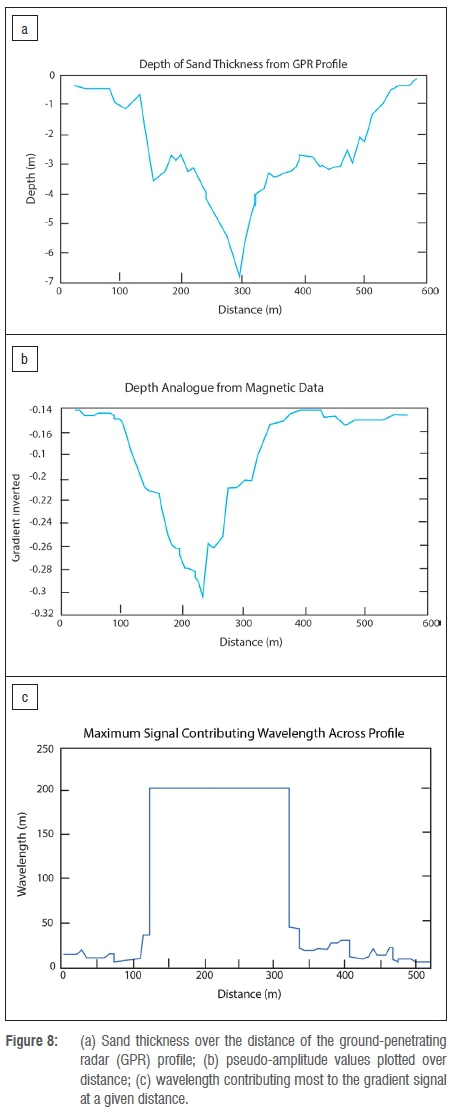
The wavelength trend is inverted from the GPR data as expected. While the data capture subtle variations over thinner sand, they also plot in a much blockier manner as an artefact of the fast Fourier transform. At longer wavelengths the S-transform is unable to resolve more than one wavelength value and as such the maximum plots as a solid bar. This results in a correlation which is unable to differentiate between depth values greater than 5 m, as is seen in Figure 8. Despite the similar looking trends between the two PA data sets and sand thickness data derived from GPR, the single line correlation was not as robust as expected. The PA data correlation produced an R2 value of 0.3 and the wavelength R2 value was also 0.3.
Because of the ability of the PA correlation to better predict thicker sand values, this method was chosen for correlation. The PA transformations were applied to every line of magnetics data collected in the valley. These values were then used to form a mesh and extrapolated to the valley scale. This gridded data set was then checked for correlation against the valley scale map of sand thickness from GPR (if we had corresponding lines of both magnetic and GPR data we would have attempted the analysis on these overlapping measurement locations). The resulting plot of this correlation with an R2 value of 0.6 is shown in Figure 9. The final map of sand thickness (Figure 10) is produced using the linear equation
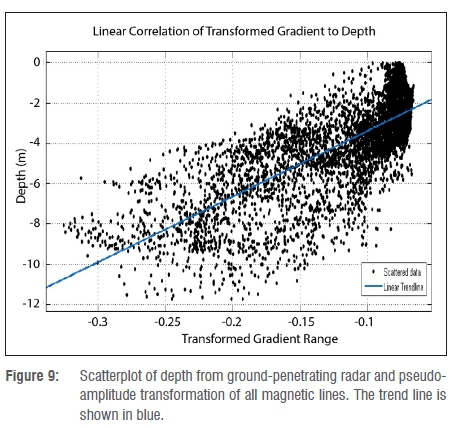
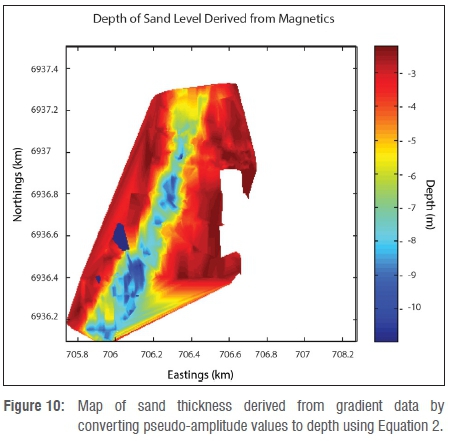

derived from a line of best fit for the scatterplot of PA and sand thickness data.
Discussion
Both GPR and magnetics data produced maps of sand thickness that show similar trends in the Bestwood 1 valley. Consistent between two images is the elongate region of thicker sand and the flanking regions on both sides which show little change in elevation.
The palaeotopography map created by subtracting sand thickness from GPR data accentuates these trends. The elongate region characterised by thick sand is shown to be a channelised feature consistent with a river running north to south through the valley and is more sinuous than is seen in the data not corrected for topography. When compared to the eastern side of the valley, individual radargrams show long traverses of fairly flat topography in the subsurface reflector. These, as well as the similar - yet smaller - tracts of relatively even topography, are interpreted as floodplain terrain.
The magnetically derived sand thickness map helps to support these data. With only the palaeotopography map we were unable to define what the subsurface in the southern portion of the valley looked like. The correlation between PA and depth data does not provide a perfect estimate of depth where sand is shallow. As the PA is responding to the variability of the original gradient signal, it can be seen that it is difficult for this method to distinguish thinner sand layers as their variability remains consistently high. Importantly though, the resulting map of sand thickness shows the same channel structure continuing south, indicating that this feature is likely continuous beyond the mapped limits of this project.
As in applications of geophysical surveys in the Wadi Safsaf and Wadi Arid study areas in southern Egypt8-11 and the Laguna Seca in Portugal12, the geophysical challenge at Bestwood 1 involves imaging the interface between sands and a substrate of either gravels or bedrock. At Bestwood 1 there is a good match between magnetic data and GPR data. The application of magnetics makes it possible to extend the landscape reconstruction of the palaeolandscape across the whole survey area and reveal a buried palaeofluvial channel.
The geophysical research at Bestwood 1 allows us to situate the extensive hominin occupation along a channel incised in an underlying gravel. This channel would have formed part of the hydrological network that drains into the Orange River to the north. Thus, the context of hominin occupation was proximity to flowing water. However, a number of critical issues remain regarding this occupation. Perhaps the most critical is the duration of occupation. As Stern et al.13 have pointed out, there is a strong tendency in Palaeolithic archaeology to treat occupations as a 'moment in time' which clearly is inappropriate for landscapes that are palimpsests of activity over very long periods. It is also important to note the role of ants as currently visible agents of bioturbation in the Kalahari sands, which points to the need for caution in assuming that Bestwood 1 is in fact an intact horizon of occupation rather than a 'stone line' of artefacts that have been concentrated at the base of the sands as the result of bioturbation (for discussion of stone lines see Chazan et al.14; for the role of ants in bioturbation and transport of artefacts see Rink et al.15 and Schoville et al.16). However, the fact that some artefacts are found embedded in a clay matrix at the top of the gravels argues against such a scenario.
The current working hypothesis is that artefacts accumulated in a rapidly aggrading clay deposit that formed along the banks of the channel. Subsequent bioturbation has broken down this clay deposit creating the impression that the artefacts were deposited directly under the Kalahari sands. The duration of the occupation cannot be ascertained but it is undoubtedly a palimpsest of many visits to the area. Detailed analysis of artefact weathering and micromorphology is critical to developing a thorough understanding of the nature of hominin occupation at Bestwood 1.
Conclusion
We had not planned at the outset of this study to combine magnetic and GPR surveys, and instead ran separate surveys. After noticing that the GPR penetration was not good enough in the southern portion, and that our magnetic data showed strong variations in amplitude from the centre to the sides of the valley, we looked more closely at the magnetic data. A reason the correlation between magnetic pseudo-amplitudes and depth to gravels worked well is that the gravels beneath the sand are highly magnetic and produce strong measurable anomalies. Our study shows that using magnetometry to determine depth of the sand layer is feasible in such a setting; however, most of our results do not rely on this part of the analysis. For future surveys with a strongly magnetic bottom layer where GPR cannot be used across much of the survey area, we suggest the collection of magnetic data and GPR profiles along the same profiles to obtain the correlation before extending the analysis to other areas. Our method has proven useful at this site and provided an image of a palaeovalley linked to a site of known hominin occupation.
Geophysical research in the Bestwood 1 valley has helped place this extensive hominin occupation in a landscape context. We can now propose a working hypothesis that there was a hominin occupation of many repeated visits to this valley along the banks of a now buried palaeochannel that was part of the Orange River drainage system. This research demonstrates the essential role of subsurface geophysical survey for understanding palaeotopography of hominin adaptation. Ongoing research at the Bestwood 1 site will refine understanding of the tempo and duration of hominin activity that led to the formation of this remarkable locality and the factors that account for the extensive hominin activity in this particular valley. The geophysical survey also provides the basis for designing a sampling strategy to test the extent of the distribution of archaeological occupation that takes into account now buried landscape features. Our results encourage work at multiple spatial scales of analysis including more fine-resolution research currently underway on the distribution of artefacts within the two excavation blocks as well as a large-scale consideration of the evolution of the Orange River drainage.
Acknowledgements
We thank the Cawood family for their assistance and permission to work on their property. All fieldwork was carried out under permit from SAHRA and funding was provided by the Canadian Social Sciences and Humanities Council and the University of Toronto Research Excursions Program. The Kathu Complex Research Project is co-directed by Michael Chazan and Steven James Walker in association with the Wonderwerk Cave Research Project. We thank the other students participating in the 399 Programme (Sam Edwards, Catarina Sollaci and Stephanie Vaughn) for their help in data collection, Vasa Lukich for her help regarding knowledge of the Bestwood area and Francesco Berna for discussion of the geology, as well as all participants in excavations and fieldwork at Bestwood and the other sites of the Kathu Complex. We particularly thank David Morris and the McGregor Museum, Kimberley, for their ongoing support.
Authors' contributions
K.S.P.: Field data collection, data analysis, writing. C.-G.B.: Research design, field data collection, data analysis, writing. S.J.W.: Field data collection. M.C.: Project director, research design, analysis of lithics, writing.
References
1.Porat N, Chazan M, Grün R, Aubert M, Eisenmann V, Horwitz LK. New radiometric ages for the Fauresmith industry from Kathu Pan, southern Africa: Implications for the Earlier to Middle Stone Age transition. J Archaeol Sci. 2010;37(2):269-283. https://doi.org/10.1016/j.jas.2009.09.038 [ Links ]
2.Walker SJ, Lukich V, Chazan M. Kathu Townlands: A high density Earlier Stone Age locality in the interior of South Africa. PLoS ONE. 2014;9(7), e103436, 11 pages. https://doi.org/10.1371/journal.pone.0103436 [ Links ]
3.Chazan M, Wilkins J, Morris D, Berna F. Bestwood 1: A newly discovered Earlier Stone Age living surface near Kathu, Northern Cape Province, South Africa. Antiquity. 2012;86(331). http://www.antiquity.ac.uk/projgall/chazan331 [ Links ]
4.Chazan M. The Fauresmith and archaeological systematics. In: Runge J, editor. Changing climates, ecosystems and environments within arid southern Africa and adjoining regions. Palaeoecology of Africa 33. London: CRC Press; 2015. p. 59-70. [ Links ]
5.Witten A. Handbook of geophysics and archaeology. London: Equinox Publishing Ltd; 2006. [ Links ]
6.Stockwell RG, Mansinha L, Lowe RP. Localization of the complex spectrum: The S transform. IEEE Trans Inf Theory. 1996;44(4):998-1001. https://doi.org/10.1109/78.492555 [ Links ]
7.Conyers LB. Ground-penetrating radar for archaeology. Walnut Creek, CA: Altamira Press; 2004. [ Links ]
8.McHugh WP, McCauley JF, Haynes CV, Breed CS, Schaber GG. Paleorivers and geoarchaeology in the southern Egyptian Sahara. Geoarchaeology. 1988;3(1):1-40. https://doi.org/10.1002/gea.3340030102 [ Links ]
9.Davis PA, Breed CS, McCauley JF, Schaber GG. Surficial geology of the Safsaf region, south-central Egypt, derived from remote-sensing and field data. Rem Sens Environ. 1993;46(2):183-203. https://doi.org/10.1016/0034-4257(93)90094-E [ Links ]
10.Haynes CV, Maxwell TA, El Hawary A, Nicoll KA, Stokes S. An Acheulian site near Bir Kiseiba in the Darb el Arba'in Desert, Egypt. Geoarchaeology. 1997;12(8):819-832. https://doi.org/10.1002/(SICI)1520-6548(199712)12:8<819::AID-GEA1>3.0.CO;2-8 [ Links ]
11.Grant JA, Maxwell TA, Johnston AK, Kilani A, Williams KK. Documenting drainage evolution in Bir Kiseiba, southern Egypt: Constraints from ground-penetrating radar and implications for Mars. J Geophys Res Planets. 2004;109, E09002, 7 pages. https://doi.org/10.1029/2003JE002232 [ Links ]
12.Conyers LB, Daniels JM, Haws JA, Benedetti, MM. An Upper Palaeolithic landscape analysis of Coastal Portugal using ground-penetrating radar. Archaeol Prospect. 2013;20(1):45-51. https://doi.org/10.1002/arp.1439 [ Links ]
13.Stern N, Bunn HT, Kroll EM, Haynes G, McBrearty S, Sept J, et al. The structure of the Lower Pleistocene archaeological record: A case study from the Koobi Fora formation [and comments and reply]. Curr Anthropol. 1993;34(3):201-225. https://doi.org/10.1086/204164 [ Links ]
14.Chazan M, Porat N, Sumner TA, Horwitz LK. The use of OSL dating in unstructured sands: The archaeology and chronology of the Hutton Sands at Canteen Kopje (Northern Cape Province, South Africa). Archaeol Anthropol Sci. 2013;5(4):351-363. https://doi.org/10.1007/s12520-013-0118-7 [ Links ]
15.Rink WJ, Dunbar JS, Tschinkel WR, Kwapich C, Repp A, Stanton W, et al. Subterranean transport and deposition of quartz by ants in sandy sites relevant to age overestimation in optical luminescence dating. J Archaeol Sci. 2013;40(4):2217-2226. https://doi.org/10.1016/j.jas.2012.11.006 [ Links ]
16.Schoville BJ, Burris LE, Tood LC. Experimental artifact transport by harvester ants (Pogonomyrmex sp.): Implications for patterns in the archaeological record. J Taphonomy. 2009;7(4):285-303. [ Links ]
 Correspondence:
Michael Chazan
mchazan@me.com
Received: 16 Mar. 2017
Revised: 06 June 2017
Accepted: 06 Oct. 2018
Published: 30 Jan. 2019

