


Services on Demand
Article
 English (pdf)
 Article in xml format
 Article references
Indicators

Related links
-
 Cited by Google
 -
 Similars in Google
Share

 Permalink
South African Journal of Science
On-line version ISSN 1996-7489
Print version ISSN 0038-2353
S. Afr. j. sci. vol.114 n.11-12 Pretoria Nov./Dec. 2018
http://dx.doi.org/10.17159/sajs.2018/5062
RESEARCH ARTICLE
Applying the water-energy-food nexus to farm profitability in the Middle Breede Catchment, South Africa
Leanne SeeligerI; Willem P. de ClercqI; Willem HoffmannI; James D.S. CullisII; Annabel M. HornIII; Marlene de WittI
IStellenbosch University Water Institute, Stellenbosch University, Stellenbosch, South Africa
IIAurecon Group, Cape Town, South Africa
IIIWestern Cape Department of Environmental Affairs and Development Planning, Cape Town, South Africa
ABSTRACT
The water-energy-food nexus has emerged as a useful concept to understand the multiple interdependencies that exist between the water, energy and food sectors. The nexus is an ambitious attempt to work across disciplines and scales to understand the workings of these complex systems. It is, however, criticised for being more of a general framework than a practical methodology because of the vast amount of data it would need to make real-life contributions to sustainable development. We show how the nexus approach, when used within a farm budget model, can transform the problem focus in water governance. By changing the relationship among water, energy and food production of a farm, profitability is significantly changed. The water-energy-food nexus debate is discussed within the context of the South African water sector, particularly the Breede River Catchment. Working from within the farm budget model, we demonstrate the impact of moving from an irrigation canal system that requires electricity for pumping, to a gravity-fed piped irrigation system in the Middle Breede River. The finding is that the water-energy-food nexus has the potential to unlock groundbreaking solutions to complex problems in agricultural water management when used in appropriate modelling systems.
Significance:
•The water-energy-food nexus approach can lead to an entirely new framing of water governance problems and therefore solutions to these problems.
•The water-energy-food nexus when used in farm budget models can identify ways of altering farm profitability.
•By addressing the energy cost of farming through an irrigation pipeline system in parts of the Breede Catchment Area, farm profitability could significantly increase.
•A gravity-fed closed pipeline system in parts of the Breede River can improve water availability and reduce farm and management costs.
Keywords: water quality; farm budget models; Breede River; water security solutions; gravity-fed irrigation
Introduction
The devastating impacts of the current drought conditions on agriculture in South Africa's Western Cape Province and the potential risk of climate change has brought into sharp focus the complexity of issues that can affect water security on farms in this province. In this paper, we probe the power of the water-energy-food (WEF) nexus approach to address farm profitability, with the help of a hypothetical farm budget model. Whole-farm budget models, developed using spreadsheet programs, can express complex and sophisticated calculations and relationships in a relatively simple way, thereby enabling the testing of water, food and energy choices on farms. The sophistication of budget models lies in their ability to allow for detail, adaptability and user-friendliness.1-3 The whole-farm budget can thus explore the feasibility of reconfiguring the relationship among water, energy and food, using the farm's profitability as a measure.4
The WEF nexus is defined as the desire to capture multiple interdependencies across three major sectors: water, energy and food.5 It works across disciplines and across scales and spans both state and non-state actors. It is an ambitious attempt to understand complex systems using transdisciplinary research. The ambitious nature of the nexus approach, and its use as a buzzword at many conferences, has led to criticism that it is nothing more than a slogan with little practical application in real-life contexts.6 Some of the criticism is that it needs extensive data to be useful, and that it represents general frameworks rather than useable tools.7
In this paper, we demonstrate how the nexus approach, when embedded in a farm budget model, can make a notable contribution to understanding how a changed relationship among water, energy and food affects farm profitability. We start with a positioning of the broad WEF nexus debate within the South African water sector and then draw links between water, energy and agricultural food production within the Breede River Catchment. In an effort to move beyond the nexus as a general framework, we calculate the impact of moving from an irrigation canal system that requires electricity for pumping, to a gravity-led piped irrigation system in the Middle Breede River, by using a farm budget model approach.
Background
The South African agricultural sector contributes approximately 2% to the gross domestic product (GDP) and employs close to 900 000 people.8 Agriculture in the Western Cape dominates much of South Africa's agricultural export production and provides high-value products such as wine grapes and fruit. This sector is a significant employer - it provides jobs for 150 000 people across the Province.9 South African farmers are under pressure to not only sustain, but also grow this economic contribution, despite factors putting significant financial strain on their agro-businesses and threatening their long-term profitability. This aim is expressed in South Africa's National Development Plan that earmarks agriculture as a sector that will provide new jobs as well as address land reform issues.10 Meanwhile, farmers are struggling to maintain production with less available water, following a drought in the Western Cape11, and rising electricity costs that make it costly to pump and irrigate12.
The word 'nexus' - from the Latin nectere, 'to bind' - speaks of connections linking two or more things.13 The concept of nexus thinking emerged on the international agenda at the World Economic Forum in 2011 in an attempt to better understand the links between the use of resources to provide basic and universal rights to food, water and energy security. It was presented to consider key issues in food, water and energy security through a sustainability lens in order to predict and protect against potential risks of future insecurity.14 The nexus methodology was an attempt to move away from the silo thinking that lead individual sectors to seek solutions only within their terrain of influence, and to overlook solutions that might lie in a holistic complex system approach. However, this desire to advance the basic ideas of integrated water resources management, within the water-energy-food nexus approach is not new.
Integrated Water Resources Management (IWRM) has been the dominant water management paradigm since the 1990s; it emerged from the recognition of the dysfunctional operations of sectoral approaches to water management.15 IWRM aimed to stop fragmentary approaches to water management and high-handed development decisions made for the benefit of a single user group or faction.16 The Global Water Partnership17 defines IWRM as:
…a process that promotes the co-ordinated development and management of water, land and related resources, in order to maximise the resultant economic and social welfare in an equitable manner without compromising the sustainability of vital ecosystems.
South Africa has been a forerunner in this international trend, with IWRM principles already emerging in the 1998 National Water Act18 and the idea of integrated water management being instrumental in bringing about the idea of the Catchment Management Agencies in the country. However, despite this initial interest, it has not necessarily led to the envisaged integration of water management across sectors.15 Water governance remains a separately managed sector. It could be argued that the emergence of the WEF nexus represents an important shift in the debate around IWRM - a shift towards a less water-centric approach to water governance. While IWRM and the nexus approach both seek to integrate water security with other policy sectors, nexus sees the food, energy and water sectors as equal partners, whereas IWRM prioritises water management.19 We demonstrate here that this shift is important, because some water problems, such as those for which the cause lies in factors external to the water sector, cannot be addressed by a 'water-centric' approach alone.20 In such cases, a WEF nexus approach is more effective at locating the cause of a water problem and identifying solutions to the challenge.
The value of the WEF nexus approach has already been recognised by key players in the South African water governance arena with the Water Research Commission identifying it as a new research field within water research.21 Similarly, the World Wide Fund for Nature recognises the nexus concept as a useful framework for action to resolve complex challenges.22 One of their key concerns has been the 20% increase in the agricultural sector's use of electricity since 2009/2010, especially when considered with the energy price hikes that have been experienced by the country over the past decade. Farmers are not easily able to pass this hike on because of the other increasing input costs in the agri-food value chain. These rising energy prices, coupled with the higher wages farmers are obliged to pay by law, are impacting the returns on investment at farm level, putting farmers - particularly emerging, previously disadvantaged farmers - under considerable pressure.
Drawing water-energy-food links in the Breede River Catchment
Agricultural food production at risk
The Breede River Catchment is located in the Western Cape Province of South Africa and is home to approximately 300 000 people.23 The largest town in the catchment is Worcester with a population of approximately 100 000 in 2011.23 Agriculture is the dominant economic driver and largest water user in the catchment, accounting for approximately 87% of the average annual water demand. Municipal use accounts for only 5% of the total demand, with less than 1% rural use and the remaining 7% exported to other catchments.24
One of the most urgent crises in the agriculture sector is the inability of farmers to pay labourers a living wage. It is estimated that agriculture and agricultural processing is responsible for 18% of jobs in the Western Cape.25 The De Doorns farmworker strike of 2012/2013 highlighted the demand from farmworkers for higher wages. Many farmers in the Western Cape were paying above the minimum wage at the time of the strike and they claimed that they were unable to afford the ZAR150 a day that labour unions were demanding. Farmworker wages in the Western Cape are significantly higher than those in the Eastern Cape and KwaZulu-Natal Provinces.26
After the demonstrations, agricultural experts were concerned that farmers would be reducing labour and possibly increasing the use of machinery to reduce financial risk and save on costs in the long term. It was also forecast that some labourers would be paid better wages, but that better pay was likely to lead to job losses overall.23 Notwithstanding these concerns, it is also clear that farm labourers are struggling to survive on the minimum wage of ZAR1503.90 a month27 because of the high cost of food and other commodities. This situation places farming in an unstable social context, and flags the issue that unless farmers can farm more cost-effectively in the future, there is likely to be increasing social unrest in the farming sector.
Such social unrest in the Western Cape has serious consequences for South Africa as a whole, because the Western Cape produces more than 90% of South Africa's agricultural exports.28 There is also evidence that these exports have been increasing with an annual average export growth of 17.8% between 2012 and 2016 and exports totalling ZAR121 billion in 2016 - an increase of 3.8% from 2015. However, agricultural economists see the export increase as being very strongly influenced by a depreciating rand. Moreover, while a weaker rand increases Western Cape fruit sales in Europe, it also increases the cost of imported machinery and pushes up bank interest rates. Many farmers rely on financing from banks and agricultural companies, especially during droughts when harvests are not bountiful, and for this reason the weakening of the rand puts a lot of financial pressure on the farmers.29 This in itself could lead to further job losses and food insecurity.
Electricity cost increases
An important economic driver of change in the Breede River Catchment is the cost of electricity. A recent Water Research Commission study30 stated that since the National Energy Regulator of South Africa in 2013 approved average annual increases in electricity tariffs of 8% for the period 2013/2014 to 2017/2018, irrigating farmers would need to re-evaluate different options to manage energy and water use in the future, because electricity costs constitute a significant part of operating costs for irrigation farmers. In 2009/2010, AgriSA reported that electricity was 4.1% of total input cost and then 5% in 2014/2015.31 They said there had been a slight drop to 4.6% in 2016/2017 but that this drop was probably as a result of mitigation measures by farmers.31 Fruit growers in the Western Cape are unlikely to be able to severely cut electricity consumption, because they already have to maintain the cold chain in their packing and storage processes, which again relies on electricity. With consumers being under pressure, farmers are going to struggle to pass all of the increases in cost in fruit production onto the market.31
Water quantity and quality at risk
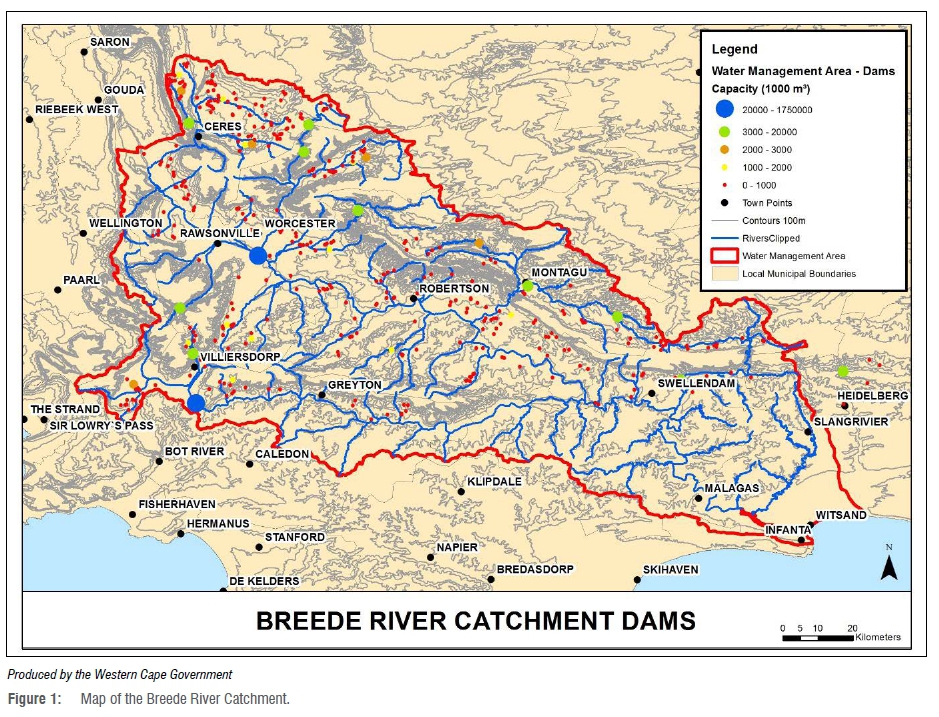
The Skurweberg Mountains near Ceres form the headwaters of the Breede River32, which then flows in a southeasterly direction over a distance of approximately 320 km to its Indian Ocean estuary at Witsand (Figure 1). Numerous tributaries join the main stem from the mountain ranges that flank the Breede River Valley. The largest tributary of the Breede River, the Riviersonderend River, joins the Breede River approximately 20 km upstream from Swellendam. The natural mean annual run-off of the Breede-Riviersonderend system is about 1857 million m3, and its present-day mean annual run-off is about 1156 million m3.24 The differences between natural and present-day mean annual run-offs do not necessarily match the sum of domestic, industrial and irrigation water requirements, because the former does not include the impacts of afforestation, invasive alien plants, irrigation/wastewater treatment return flows and nett evaporation from water bodies. In addition, a significant portion of the water (90 million m3 per year) from the Theewaterskloof Dam on Riviersonderend River is exported to the City of Cape Town. Invasive alien plants, particularly pines and eucalypts, occurring in the upper catchment areas of the Breede River Catchment and in the riparian areas, at current levels of invasion, are estimated to account for approximately 5.3% of the registered water use, and if left unaddressed could spread to impact up to 20.7% of registered water use.33 Because most of the Breede River Catchment receives winter rainfall and farmers harvest in summer, water users in the catchment are very dependent on dams to provide storage to meet their water use requirements. As a result, there are a large number of dams of varying sizes located within the catchment.
Intensive agriculture and urban development have resulted in an array of water quality challenges in the Breede River.32 These challenges include concerns about increased salinity, nutrient enrichment, microbiological water quality, agrochemicals and impacts on dissolved oxygen. Water quality in the Breede River is progressively degraded in a downstream direction as a consequence of water abstractions and irrigation return flows entering the rivers. A recent study of the water quality risks in the Breede River Catchment undertaken by the Western Cape Department of Environmental Affairs and Development Planning34 highlighted the risks associated with the maintenance and management of certain wastewater treatment works and the social and economic risks for the region associated with the state of a few of the wastewater treatment works. The potential risk to water quality posed by urban and agricultural non-point source pollutions, particularly resulting from rapid urban and informal growth, has also been described in this previous study. The economic risks associated with declining water quality in the Breede River far outweighed the costs of the necessary improvements in the condition of the wastewater treatment works, although it was also noted that some of the water-quality risks will remain because of the presence of informal settlements and continued non-point source pollution from agriculture. Eliminating the need to use the Breede River as a conveyance system for water from the main dams to the downstream farmers could therefore significantly reduce these water-quality risks for agricultural irrigation.
A farm budget model to test the water-energy-food nexus
In modern agriculture, quantitative methods are widely employed to assess the performance of industries and specific areas, within these industries, and to justify support and intervention strategies by government. Scientists use quantitative methods in innovative ways to assist food producers to make sense of complex decision-making.35 Researchers and producers employ quantitative, scientific methods to communicate issues and implications to policymakers with the aim of effecting adoption.2,36 The main advantage of simulation as a quantitative method is that the outcomes of different variables can be evaluated without actual observation and disruption within the physical system. Simulation also allows for the time-efficient and cost-saving evaluation of numerous alternative possibilities or combinations thereof.37-39
Farming is a complex and unpredictable endeavour. The reality of permanent crop production is that investment decisions are made without perfect knowledge of future water availability.40 Whole-farm models are used to better understand the multiple dimensions and complex interrelationships of farms.41,42 Modelling is an attempt to validate accurate representations of the real world. By varying the parameters and assumptions of the model, research questions of a descriptive, causal and predictive nature can be partially addressed.43-45 Computer models are particularly useful in this regard for exploring hypothetical systems and quantitatively comparing, and designing, alternative management options in relatively stable patterns.46-48
Budgeting is perhaps the most widely used non-optimising method (not designed to identify the 'best' possible outcome) of financial planning. The popularity of budgets stems from their simplicity of use and the fact that they aid in the heuristic approach to decision-making.49 The development of computer technology introduced a dimension to budgeting methods that allowed budgets to be used as dynamic planning and decision-making tools. In this sense, budgets can now also be classified as simulation models that are based on accounting principles and methods, rather than purely on mathematics.2,50,51
The key to useful models is relative simplicity, which can be obtained by setting well-defined objectives. The pre-occupation of systems researchers with simulation and model building, with less attention to applications, may lead to either limited practical use or suspicion among producers who do not understand the principle or function of the model.52 Another limitation of whole-farm budget models is their non-optimising nature.
The availability of irrigation water determines, in physical terms, the crop mix and the amount of land that is useable on a farm. The physical size and geography of the farm also determines the investment required in infrastructure, movable assets and other inputs. This investment requirement, along with the harvest, determines the projected income. The income and cost factors are therefore greatly influenced by a change in irrigation water availability and quality. Net farm income is commonly used for a financial comparison of farming units. With some adaptation, whole-farm models may also be extended over time to calculate returns on capital invested and to calculate profitability indicators such as the internal rate of return on capital investment (IRR) or net present value (NPV).
What is the typical farm?
A tool that can be used to assess farm profitability and to determine the effect of variations in a range of variables on farm-level profitability is the 'typical farm'. The typical farm model allows for evaluation and comparison of the effect of various managerial decisions and options in a cost- and time-efficient way.53 The typical or representative farm model cannot accurately reflect internal managerial problems for individual, unique farm units. The impact of trends, strategies and policy options on whole-farm profitability can be assessed by using a typical farm.54
The whole-farm approach provides a more reliable basis for assessing the potential impact of variables on which to base policies and programmes. The typical farm concept is based on existing enterprises, practices and environmental factors. Feuz and Skold55 define a typical farm as 'a model farm in a frequency distribution of farms in the same universe'. In essence, it is a synthetically constructed model farm based on the expected structure of a farm in a particular area.56
Describing a typical farm in the Middle Breede River Catchment
The Breede River irrigation area is a diverse farming area of high-value, irrigated, mostly long-term crops. The area, however, has been subdivided into four relatively homogeneous areas. These areas are defined as relatively homogeneous based not only on soil and climate, but also on farm size, farmer association and crop type. The initial identification of the areas was based on the areas as used by the South African Wine Industry Information & Systems (SAWIS) in the farmer study group work. The farm sizes and land distribution for the typical farms was done according to statistics obtained from industry organisations.57-59 The farm description for each area was presented to industry role players for validation of the assumptions. It was also suggested and accepted that production cost figures be used based on the industry information published by Hortgro and VinPro, representing the fruit and wine industries, respectively.
By definition, relatively homogeneous farming areas are similar in physical characteristics like climate, soil and farm size, but also in the formal and institutional-like affiliations to agribusinesses. For the Breede River, the areas that were identified are Breedekloof, Worcester, Robertson and Montagu and are shown in Figure 2. For each area, a typical farm was identified, which would be recognised as characteristic by farmers of the area. Typical is closer to modus, or the most commonly occurring, rather than average. The purpose is to establish a basis for comparing alternatives and so it should be representative. Farmers must be able to identify with the 'typical farm'.
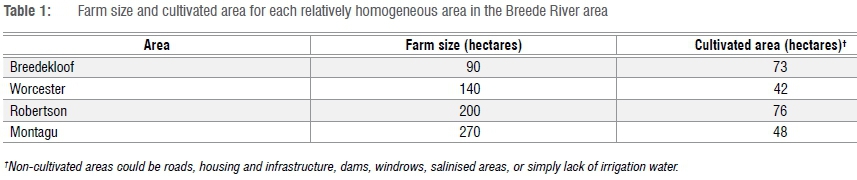
The first dimension of whole-farm modelling is that of establishing the physical extent and processes concerned in the farm system, that is, the farm size and cultivated area. The important consideration is that not all land is included in the investment requirement: only the productive area contributes to output and income. Table 1 shows the farm size for each of the areas as well as the area that is cultivated.
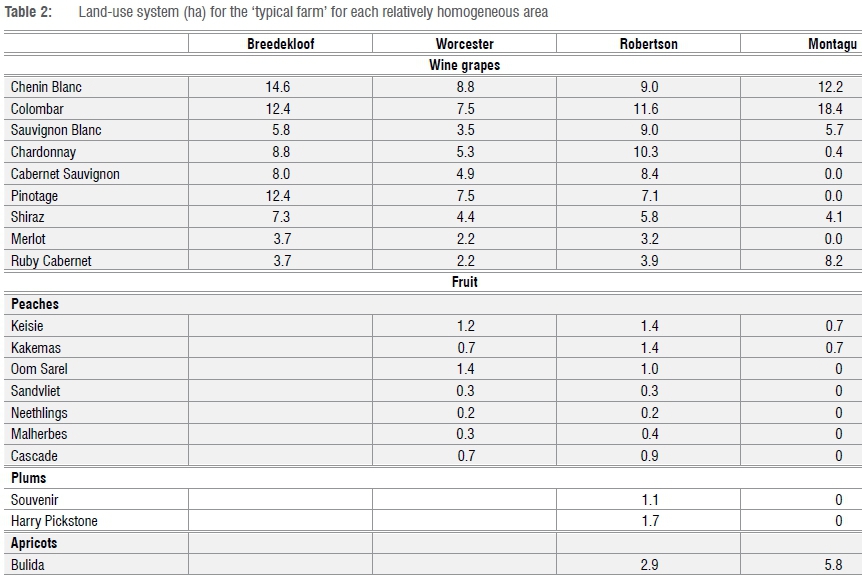
The crop mix for wine grapes that is implemented on each farm is often done in conjunction with wine cellars. This crop mix is the typical cultivar mix. SAWIS and Hortgro data were used for the initial land-use pattern identification. These data were presented to industry role players for validation. The validated land-use patterns for each typical farm are presented in Table 2. This group included personnel from VinPro, Hortgro and SAWIS, as well as producers, winemakers and viticulturists from cellars; Intelegro and Nexus (chemical suppliers); and Yara and Nitrophoska (fertiliser suppliers). The industry role players validated both the land-use patterns of the typical farm and the investments, costs and yields, to establish the gross margins of the farm within each homogeneous region.
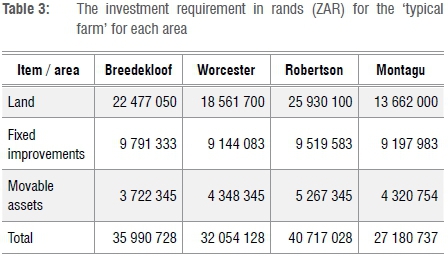
For each farm, a set of assumptions is required for quantities and prices for both inputs and products. The cost and expected income were taken from industry bodies: VinPro does financial study group work for the wine industry and Hortgro for the fruit industry. Production costs are thus based on the outcome of study group data for each area - an average cost amongst a group of producers ranging from 16 to about 26 participants. Fixed improvements were also determined with the assistance of land valuators and farmers. The same is the case for the fruit industry. Prices for land were obtained from banks and farm valuators and not from estate agents. The farm values might therefore be somewhat conservative as the farms that require financing are often in some difficulty. Profitability is a function of income generated by some investment. The investment requirement for the typical farm for each area is presented in rand value in Table 3. The investment requirement thus includes investment in land, fixed improvements (orchards, vineyards, buildings, houses, irrigation dams and pump stations and fencing) and movable assets (tractors, implements, equipment).
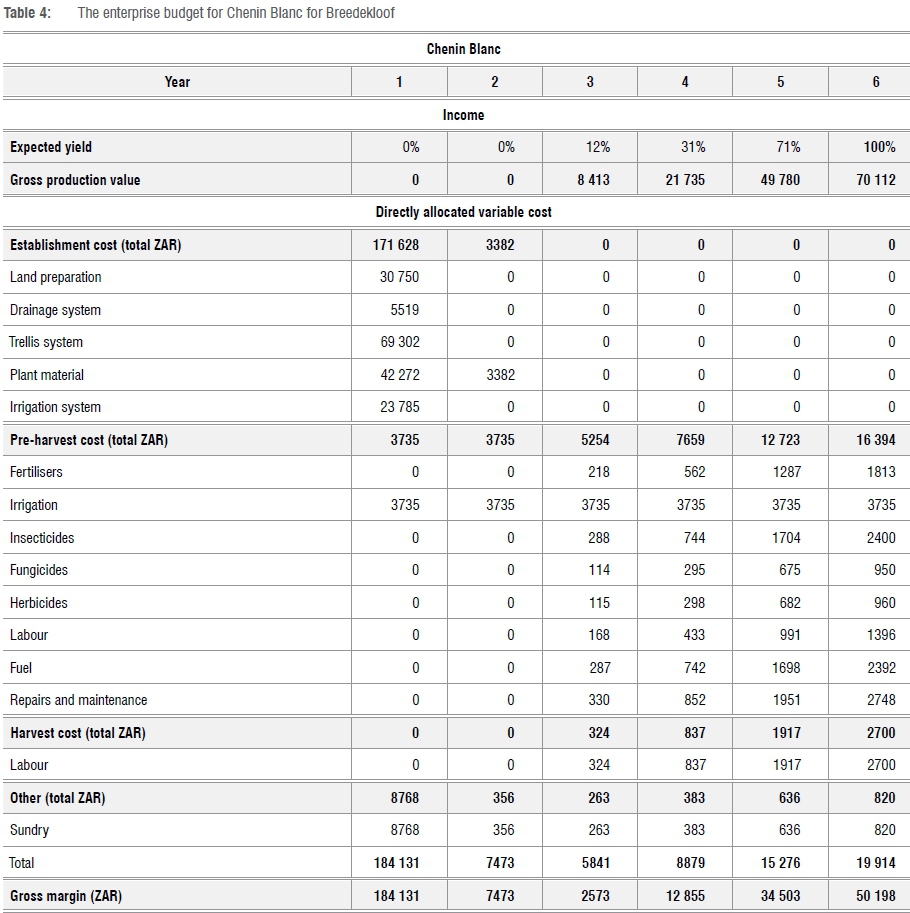
The operational component of a farm is expressed in the model in the form of an enterprise budget. The enterprise budgets were compiled for each wine cultivar separately and integrated into the whole-farm model by multiplying the area under each crop by the expected profitability. Table 4 shows the enterprise budget for the Chenin Blanc wine cultivar for Breedekloof as example of the structure. The model is developed for a 25-year period, but only the first 6 years are presented in Table 4, from Year 6 onwards the vineyard will expectedly run on full bearing capacity until the last year. The model is parameterised to the extent that input and output quantities can be changed separately. This functionality allows for the model to be used for risk assessment and the identification of key drivers of profitability.
The gross production value is a function of yield and expected price. The yield assumptions are relatively conservative, and as shown in Table 4, are expected to reach full bearing capacity in Year 6. The establishment cost occurs in Year 1 of the life of a vineyard. From Year 2 onwards, the production costs will steadily increase according to the yield expectations. The gross margin serves as a basis for the modelling component and it is the difference between gross production value and allocated variable cost. For this cultivar the expected gross margin stabilises at ZAR50 198 for the remainder of the expected life of the vineyard over 20 years.
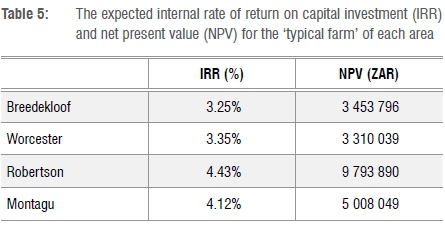
The various enterprises are integrated into the whole-farm gross margin level, by subtracting the variable costs from the income. Fixed and overhead costs are then subtracted from the gross margin to calculate a figure that would resemble net farm income. From this net farm income annual figure, the capital replacement is subtracted to give the net annual flow after capital replacement. The model is structured to show the impact of changes in: input or output quantities, input and output prices, fixed costs levels, changes in land utilisation, crop replacement schedules and movable asset replacement costs. Profitability is an indication of yield on investment and in this case is indicated by the IRR and NPV. These profitability indicators are calculated on a capital budget format and thus include capital replacements in normal farming cycles (machinery and orchards and vineyards). The normal increase in land values is ignored. It is important to note that the IRR in this case is a real return, in other words one should still add inflation to calculate the nominal rate of return. Table 5 shows the expected IRR and NPV for each typical farm.
Reconfiguring the water-energy-food nexus
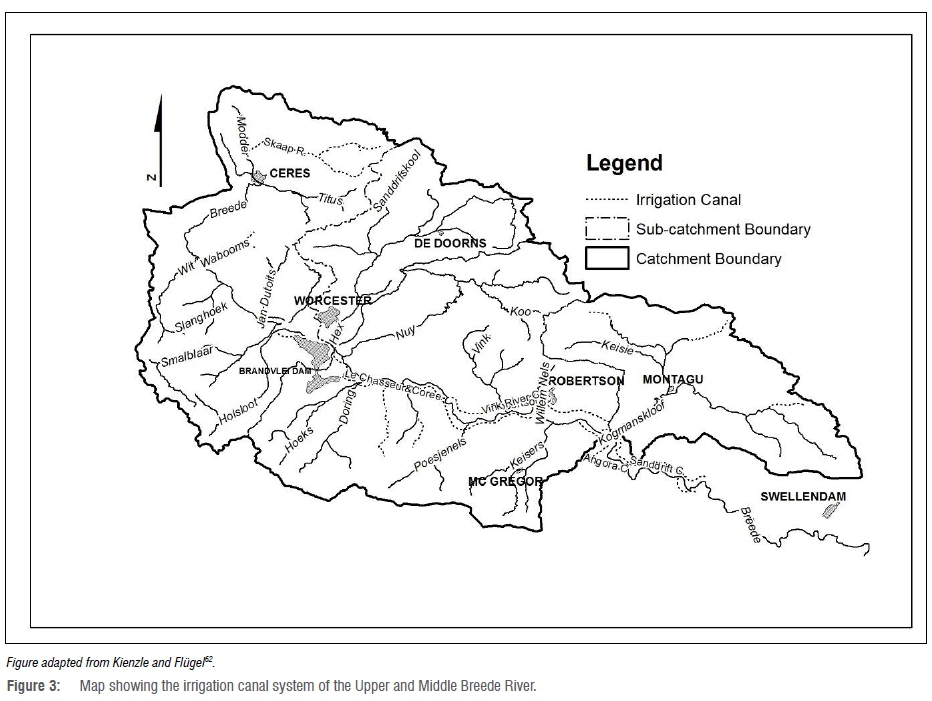
As discussed earlier, water quality and quantity are both serious threats to water security in the Breede River Catchment. It is predicted that the Western Cape will possibly become drier and drier over the years as climate change predictions become a reality.61 Many of the farms in the Breede River Catchment receive water via canal systems, which at some points are over 100 years old. Figure 3 illustrates the canal systems in the catchment.
Large amounts of the already little available surface water disappear through leakages and evaporation in this inefficient system. While many farms have access to groundwater, some of this groundwater is brackish because of the geology of the area and return flows. The middle and lower reaches of the Breede River are most affected, with salinity levels progressively increasing in a downstream direction.63 These high salinity levels force farmers to irrigate more, to leach out the salts. Indications are that farmers are over-irrigating to compensate for salinity and other forms of pollution. Approximately 22 million m3/a of fresh water is released from the Greater Brandvlei Dam into the Breede River to reduce salinity of the river water.
Use of a gravity-led piped system from the dams would improve water quality by supplying clean water fresh from the dams and not allowing the geological salinity of the Breede River Catchment soils, nor the agri-polluted return flows from the farmers or the storm water from informal settlements, to contaminate river water for irrigation, and subsequently the soil. This improvement in the water quality would reduce over irrigation of soils to produce good food, resulting in less water having to be used by farmers in the entire system. The freshwater releases from the Greater Brandvlei Dam, which are currently used to dilute the pollutants in the water, could therefore be minimised.
Applying the reconfigured nexus approach to the farm budget model
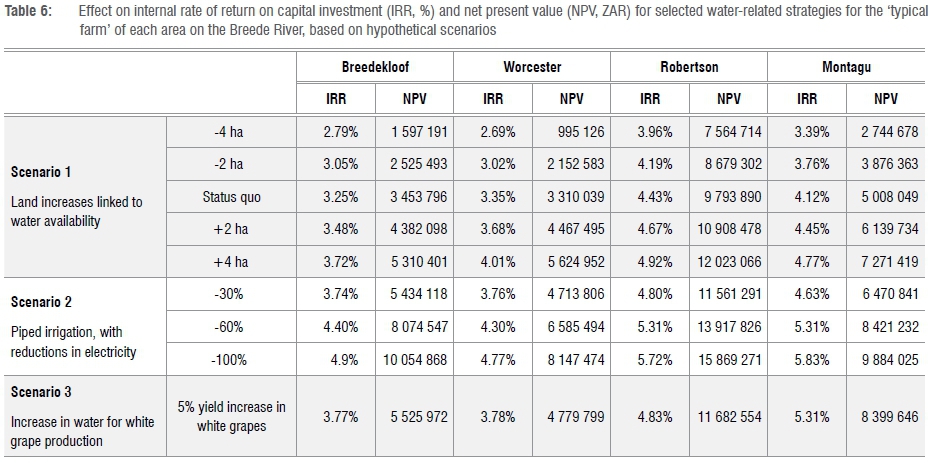
The farm budget model can provide an understanding of the feasibility of replacing the current open canal system with a gravity-led piped system. The expected effect of irrigation and electricity is measured against the baseline presented in Table 5. Three scenarios were modelled. In the first scenario, more and less irrigated land is made available, which reflects the possibility of increasing or reducing the water available for irrigation, and the impact that this has on farm profitability was assessed. Both 2 ha and 4 ha increases in land use were simulated in each case. In the second scenario, it was assumed that water is delivered under pressure through a pipeline system with various reductions in electricity as a cost, together with the maintenance and cost of pumps. This assumption has a direct effect on cost saving and profitability. A third scenario was based on the possibility of more water being made available for crop production, with a specific application to a crop of white grapes. Producers may increase irrigation quantity for white wine cultivars and stimulate increased yields (personal communications with researchers and producers). The increase in water quantity leads to a 5% yield increase of white grape cultivars, with differing profitability in the different homogeneous areas. This scenario is very much dependent on individual cellars and their target markets. The correlation between high yields and lower quality wine may exclude this option in some areas, although cellars may target lower price or wine for distillation markets. The expected financial outcome for each of the scenarios is presented in Table 6.
The analysis shows a high positive impact on IRR and NPV in all regions under Scenario 2, where a gravity-fed piped system cuts electricity costs, with 30%, 60% and 100% reductions which are based on the topographical fall of the land in relation to the source of the water. The model shows that, given the high cost of electricity, with further price increases expected, by the provision of gravity-fed piped water, which provides the pressure for irrigation water, and the subsequent reduction in electricity, the profitability of the typical farm can increase. With a 5-10% increase in irrigated land (approximately 4 ha) across all typical farms in this analysis in the Breede River Catchment, as in Scenario 1, there are strong parallels to a 30% reduction in electricity in Scenario 2. This analysis proves that placing emphasis on the energy element of the water-energy-food nexus in a catchment management system can have extremely positive impacts on food production and economic growth at the farm level.
The idea of introducing solar energy powered pumps was not included in the analysis. It is worth investigating as a supplementary form of energy. It is, however, unlikely to be suitable as an exclusive form of energy generation because farmers in this region pump both during the day and night. This means if solar energy was introduced, farmers would need to use batteries to store the solar energy. This would involve a significant capital outlay and would need to be the subject of another research exercise.
Farmers' opinions on the impacts of the piped system
Farmers and irrigation board members interviewed in the Cogmanskloof Area near Montagu (Figure 1) were in favour of using a piped gravity-fed system in their area, given that the altitude drops from the catchment dam to their farms. They assessed that 25% of the water was lost through evaporation and leaks in the aging canal system. An estimated ZAR13 million investment in 20 km of gravity-fed piped water from Potjieskloofdam would significantly reduce their electricity costs and save them sufficient quantities to significantly increase the profitability of their farms. The irrigation board projected that the irrigation system for the area would become so profitable, the board would be able to release water for about 50 ha to the government for distribution to emerging farmers, subject to more detailed analysis by water specialists. It was estimated that repairing the current canal system that was ageing would be equally as expensive as implementing the new pipeline system, but that the repairs would make no contribution to improving the water, food and energy crisis in the Montagu area. However, in the lower Robertson area with water travelling significant distances from the higher catchment to reach smaller incremental altitudinal decreases onto a flatter plateau, stakeholders were less confident that a gravity-fed irrigation system could be put in place. They argued that the capital cost of piping water from Brandvlei Dam to the farms in the Breede River lower down was too high and the gradient insufficient to significantly reduce the use of electrical pumps. The hypothetical testing of the value of a reconfiguration of the WEF nexus in the Middle Breede Area using the farm budget model enables the cost of electricity to be adjusted to gauge projected impact of the gravity-fed piped irrigation system.
Conclusion
It was not the aim of this paper to provide conclusive evidence of the use of a piped-irrigation system versus a canal system in the Breede River Catchment, but rather to demonstrate how the adoption of a WEF nexus approach for agricultural water management in the Breede allowed a new problem identification to emerge. By focusing on the relationship between water and energy, rather than water scarcity alone, more water was made available at a reduced cost and with improved quality in the Middle Breede River Catchment. Moreover, if addressed, the analysis showed that it would not only increase farm profitability and address water quality for agriculture, but would also improve the efficiency of water use in the catchment and enable progress to be made on water allocation reform as well as possibly even introduce avenues towards more equitable land redistribution. In this way, we have demonstrated how the WEF nexus approach can provide insights into how integrated water management can be applied in a particular agricultural context.
As water is a limiting factor in agriculture, especially given climate change and drought conditions which are anticipated to increase water stress, particularly on the agriculture sector, it is expedient to manage electricity costs through gravity-fed piped irrigation water, where possible, and to improve water quality in this way. It is thought that the option of gravity-fed piped water should be validated on a case-by-case basis, given the advantages of improved water quality, as well as the modelled advantages of enhanced profitability with reduced electricity usage, within this study. There are also many other, non-technical aspects that also need to be addressed on a case-specific basis, such as land ownership and access for pipeline routes, as well as environmental impact assessments.
The insights into the WEF nexus were achieved by extending the focus on water quantity and quality to the high cost of using electricity to pump water, through a non-optimised, budget-based model. By addressing the energy cost, water use efficiency and water quality risks through an integrated dam and irrigation pipeline system, farm profitability could significantly increase, allowing farmers to look at new ways of addressing equity and land redistribution in the area. This gravity-fed closed system had several other projected benefits. It could reduce salinity in the system by limiting return flows off farms. It could free up additional fresh water from the Brandvlei Dam, positioned higher up in the catchment, that would have been used to flush out the additional salinity. Lastly, the piped system is an alternative to spending capital on reducing the leakages that were occurring in the current canal system, with greater benefits, in terms of the management of water quality and quantity through reduced evaporation levels. All these possibilities could be opened up by simply adopting a WEF nexus approach, rather than a singular focus on water.
Acknowledgements
This study was funded by the Western Cape Department of Environmental Affairs and Development Planning. We thank colleagues from Viticulture at the Agricultural Research Council in Nietvoorbij, Stellenbosch, the Robertson Winery in Robertson, farmers in Cogmanskloof as well as representatives from irrigation boards in Robertson and Cogmanskloof for sharing their knowledge.
Authors' contributions
L.S.: conceptualisation; data collection; literature review; writing the initial draft and revisions; project management. W.P.d.C.: conceptualisation; methodology; technical review and input; data analysis; funding acquisition. W.H.: conceptualisation; methodology; data collection; sample analysis; data analysis; writing the initial draft and revisions. J.D.S.C.: data analysis; writing the initial draft and revisions. A.M.H.: methodology; data collection; writing revisions; project leadership. M.d.W.: literature review; writing the initial draft and revisions; technical review.
References
1.Dillon JL, Hardaker JB. Farm management research for small farmer development. Rome: Food and Agriculture Organization; 1984. [ Links ]
2.Dorward PT, Shepherd DD, Wolmer WL. Developing farm management type methods for participatory needs assessment. Agric Syst. 1997;55(2):239-256. https://doi.org/10.1016/S0308-521X(97)00009-7 [ Links ]
3.Keating BA, McCown RL. Advances in farming systems analysis and intervention. Agric Syst. 2001;70(2-3):555-579. https://doi.org/10.1016/S0308-521X(01)00059-2 [ Links ]
4.Morgan-Davies C, Wilson R, Waterhouse T. Impacts of farmers' management styles on income and labour under alternative extensive land use scenarios. Agric Syst. 2017;155:168-178. https://doi.org/10.1016/j.agsy.2017.04.011 [ Links ]
5.Leck H, Conway D, Bradshaw M, Rees J. Tracing the water-energy-food nexus: Description, theory and practice. Geogr Compass. 2015;9(8):445-460. https://doi.org/10.1111/gec3.12222 [ Links ]
6.Wichelns D. The water-energy-food nexus: Is the increasing attention warranted, from either a research or policy perspective? Environ Sci Policy. 2017;69:113-123. https://doi.org/10.1016/j.envsci.2016.12.018 [ Links ]
7.Kaddoura S, El Khatib S. Review of water-energy-food nexus tools to improve the nexus modelling approach for integrated policy making. Environ Sci Policy. 2017;77:114-121. https://doi.org/10.1016/j.envsci.2017.07.007 [ Links ]
8.Den Hartigh W. Agriculture is still creating employment in SA. Farmers Weekly. 2016 May 11. Available from: https://www.farmersweekly.co.za/agri-news/south-africa/agriculture-is-still-creating-employment-in-sa/ [ Links ]
9.Braham V, Dotwana A. Final land chapter. State of environment outlook report for the Western Cape Province 2014-2017 [document on the Internet]. c2018 [cited 2018 Aug 21]. Available from: https://www.westerncape.gov.za/eadp/files/atoms/files/03_Land.pdf [ Links ]
10.South African National Planning Commission. National Development Plan 2030. Our future - make it work. Pretoria: Government Printing Works; 2011. [ Links ]
11.Chambers D. Western Cape agriculture adds up the cost of the continuing drought. Business Day. 2018 July 19. Available from: https://www.businesslive.co.za/bd/national/2018-07-19-western-cape-agriculture-adds-up-the-cost-of-the-continuing-drought/ [ Links ]
12.Green Cape. Market intelligence report [webpage on the Internet]. c2016 [cited 2018 Oct 08]. Available from: https://greencape.co.za/assets/GreenCape-Agriculture-MIR-2016 [ Links ]
13.Oxford Dictionary [online]. Nexus [cited 2018 Mar 13]. Available from: https://en.oxforddictionaries.com/definition/nexus [ Links ]
14.Biggs EM, Boruff B, Bruce E, Duncan JMA, Haworth BJ, Duce S, et al. Environmental livelihood security in Southeast Asia and Oceania: A water-energy-food-livelihoods nexus approach for spatially assessing change. Colombo, Sri Lanka: International Water Management Institute; 2014. https://doi.org/10.5337/2014.231 [ Links ]
15.Mehta L, Movik S. Flows and practices: Integrated water resources management (IWRM) in African contexts. IDS Working Papers. 2014;2014(438):1-34. https://doi.org/10.1111/j.2040-0209.2014.00438.x [ Links ]
16.Giordano M, Shah T. From IWRM back to integrated water resources management. Int J Water Resour Dev. 2014;30(3):364-376. https://doi.org/10.1080/07900627.2013.851521 [ Links ]
17.Global Water Partnership. The need for an integrated approach [webpage on the Internet]. No date [cited 2018 Mar 13]. Available from: https://www.gwp.org/en/About/why/the-need-for-an-integrated-approach/ [ Links ]
18.Claassen M. Integrated water resource management in South Africa. Int J Water Gov. 2013;1(3-4):323-338. https://doi.org/10.7564/13-IJWG12 [ Links ]
19.Benson D, Gain A, Rouillard J. Water governance in a comparative perspective: From IWRM to a 'nexus' approach? Water Altern. 2015;8(1):756-773. [ Links ]
20.De Loë RC, Patterson JJ. Rethinking water governance: Moving beyond water-centric perspectives in a connected and changing world. Nat Resour J. 2017;57:75. [ Links ]
21.Water Research Commission. Water energy food security [webpage on the Internet]. No date [cited 2018 Mar 13]. Available from: http://www.wrc.org.za/Pages/LH3-WaterEnergyFoodSecurity.aspx# [ Links ]
22.Von Bormann T, Gulati M. The food energy water nexus: Understanding South Africa's most urgent sustainability challenge. Johannesburg: WWF-SA; 2014. [ Links ]
23.Statistics South Africa. Statistics by place [webpage on the Internet]. No date [cited 2018 Mar 13]. Available from: http://www.statssa.gov.za/?page_id=964 [ Links ]
24.South African Department of Water Affairs and Forestry (DWAF). Strategic framework for national water resource quality monitoring programmes. Report no. N/0000/REQ0204. Pretoria: Resource Quality Services, DWAF; 2004. [ Links ]
25.Maree D. Why Western Cape agriculture matters to the South African economy. Business Report. 2017 June 28. Available from: https://www.iol.co.za/business-report/why-western-cape-agriculture-matters-to-sa-economy-10007415 [ Links ]
26.Visser M, Ferrer S. Farm workers' living and working conditions in South Africa: Key trends, emergent issues, and underlying structural problems. Pretoria: International Labour Organization; 2015. [ Links ]
27.Erasmus D. More than just low wages behind De Doorns strike. Farmers Weekly. 2012 November 19. Available from: https://www.farmersweekly.co.za/agri-news/south-africa/more-than-just-low-wages-behind-de-doorns-strike/ [ Links ]
28.Green Cape. Market intelligence report [webpage on the Internet]. c2017 [cited 2018 Mar 13]. Available from: https://www.greencape.co.za/assets/Uploads/GreenCape-Agri-MIR-2017-electronic-FINAL-v1.pdf [ Links ]
29.Du Preez P. Impact of downgrade on agriculture [webpage on the Internet]. c2017 [cited 2018 Mar 13]. Available from: https://www.cover.co.za/impact-downgrade-agriculture/ [ Links ]
30.Venter M, Grové B, Van der Stoep I. The optimisation of electricity and water use for sustainable management of irrigation farming systems. Water Research Commission report no. TT717/17. Pretoria: Water Research Commission; 2017. Available from: http://www.wrc.org.za/Knowledge%20Hub%20Documents/Research%20Reports/TT%20717_final%20web.pdf [ Links ]
31.Slabbert A. Eskom increase unaffordable - AgriSA. Grid defection will accelerate utility's death spiral. MoneyWeb. 2017 October 06. Available from: https://www.moneyweb.co.za/news/south-africa/eskom-increase-unaffordable-agrisa/ [ Links ]
32.South African Department of Water Affairs and Forestry (DWAF). State of the rivers report: Rivers of the Breede Water Management Area. Pretoria: DWAF; 2011. Available from: http://www.dwaf.gov.za/iwqs/rhp/state_of_rivers/WCape/Breede2011.pdf [ Links ]
33.Cullis JD, Gorgens AH, Marais C. A strategic study of the impact of invasive alien plants in the high rainfall catchments and riparian zones of South Africa on total surface water yield. Water SA. 2007;33(1):35-42. http://hdl.handle.net/10520/EJC116404 [ Links ]
34.Jakku E, Thorburn PJ. A conceptual framework for guiding the participatory development of agricultural decision support systems. Agric Syst. 2010;103(9):675-682. https://doi.org/10.1016/j.agsy.2010.08.007 [ Links ]
35.Cullis JDS, Rossouw N, Du Toit G, Petrie D, Wolfaardt G, De Clercq W, et al. Economic risks due to declining water quality in the Breede River Catchment. Water SA. 2018;44(3):464-473. [ Links ]
36.Kuehne G, Llewellyn R, Pannell DJ, Wilkinson R, Dolling P, Ouzman J, et al. Predicting farmer uptake of new agricultural practices: A tool for research, extension and policy. Agric Syst. 2017;156:115-125. https://doi.org/10.1016/j.agsy.2017.06.007 [ Links ]
37.Daellenbach H, McNickle D, Dye S. Management science: Decision-making through systems thinking. Basingstoke: Palgrave Macmillan; 2012. [ Links ]
38.Nance RE, Sargent RG. Perspectives on the evolution of simulation. Oper Res. 2002;50(1):161-172. https://doi.org/10.1287/opre.50.1.161.17790 [ Links ]
39.Strauss PG. Decision-making in agriculture: A farm-level modelling approach [MSc Agric thesis]. Pretoria: University of Pretoria; 2005. [ Links ]
40.Adamson D, Loch A, Schwabe K. Adaptation responses to increasing drought frequency. Aust J Agric Resour Econ. 2017;61(3):385-403. https://doi.org/10.1111/1467-8489.12214 [ Links ]
41.Diogo V, Reidsma P, Schaap B, Andree BP, Koomen E. Assessing local and regional economic impacts of climatic extremes and feasibility of adaptation measures in Dutch arable farming systems. Agric Syst. 2017;157:216-229. https://doi.org/10.1016/j.agsy.2017.06.013 [ Links ]
42.Jones JW, Antle JM, Basso B, Boote KJ, Conant RT, Foster I, et al. Brief history of agricultural systems modeling. Agric Syst. 2017;155:240-254. https://doi.org/10.1016/j.agsy.2016.05.014 [ Links ]
43.Brenner T, Werker C. A taxonomy of inference in simulation models. Comput Econ. 2007;30(3):227-244. https://doi.org/10.1007/s10614-007-9102-6 [ Links ]
44.Brennan T. Review of reasoning and method in economics: An introduction to economic methodology. J Econ Issues. 1981;15(3):796-799. [ Links ]
45.White AR. Inference. Philos Quart. 1971;21(85):289-302. https://doi.org/10.2307/2218655 [ Links ]
46.Attonaty JM, Chatelin MH, Garcia F. Interactive simulation modeling in farm decision-making. Comput Electron Agr. 1999;22(2-3):157-170. https://doi.org/10.1016/S0168-1699(99)00015-0 [ Links ]
47.Douthwaite B, Hoffecker E. Towards a complexity-aware theory of change for participatory research programs working within agricultural innovation systems. Agric Syst. 2017;155:88-102. https://doi.org/10.1016/j.agsy.2017.04.002 [ Links ]
48.Robson AJ. The spreadsheet: How it has developed into a sophisticated modelling tool. Logist Inform Manage. 1994;7(1):17-23. https://doi.org/10.1108/09576059410052340 [ Links ]
49.Rehman T, Dorward A. Farm management techniques and their relevance to administration, research and extension in agricultural development: Part 1 - Their evolution and use in developed countries. Agric Admin. 1984;15(3):177-189. https://doi.org/10.1016/0309-586X(84)90065-7 [ Links ]
50.Malcolm LR. Fifty years of farm management in Australia: Survey and review. Rev Mark Agric Econ. 1990;58(1):24-55. [ Links ]
51.Pannell DJ. Lessons from a decade of whole-farm modeling in Western Australia. Rev Agric Econ. 1996;18(3):373-383. https://doi.org/10.2307/1349622 [ Links ]
52.Doyle CJ. Application of systems theory to farm planning and control: Modelling resource allocation. Systems theory applied to agriculture and the food chain. London: Elsevier Applied Science; 1990. p. 89-112. [ Links ]
53.Blackie MJ, Dent JB. The concept and application of skeleton models in farm business analysis and planning. J Agric Econ. 1974;25(2):165-175. https://doi.org/10.1111/j.1477-9552.1974.tb00538.x [ Links ]
54.Carter HO. Representative farms: Guides for decision making? J Farm Econ. 1963;45(5):1448-1455. https://doi.org/10.2307/1236842 [ Links ]
55.Feuz DM, Skold MD. Typical farm theory in agricultural research. J Sust Agr. 1992;2(2):43-58. https://doi.org/10.1300/J064v02n02_05 [ Links ]
56.Ash A, Gleeson T, Hall M, Higgins A, Hopwood G, MacLeod N, et al. Irrigated agricultural development in northern Australia: Value-chain challenges and opportunities. Agric Syst. 2017;155:116-125. https://doi.org/10.1016/j.agsy.2017.04.010 [ Links ]
57.Hortgro. Key deciduous fruit statistics. Paarl: Hortgro; 2016. [ Links ]
58.South African Wine Industry Information & Systems (SAWIS). SA wine industry 2016 statistics nr 41. Paarl: SAWIS; 2016. [ Links ]
59.VinPro. Cost guide 2017/2018. Paarl: VinPro Agricultural Economic Services; 2017. [ Links ]
60.South African Wine Industry Information & Systems (SAWIS). SA wine regions [document on the Internet]. c2017 [cited 2018 Aug 21]. Available from: http://www.sawis.co.za/cert/download/Regions_-_Aug_2017.pdf [ Links ]
61.CSIR. SA climate experts warn of a drier future in Western Cape [webpage on the Internet]. c2017 [cited 2018 Aug 21]. Available from: https://www.csir.co.za/sa-climate-experts-warn-drier-future-western-cape-0 [ Links ]
62.Kienzle S, Flügel WA. The salinity of the Breede River and its tributaries between Brandvlei dam and H5M04: Summary of daily data up to September 1987. Pretoria: Hydrological Research Institute: Breede River Research Programme (BRSRP), Department of Water Affairs; 1988. [ Links ]
63.South African Department of Water Affairs and Forestry (DWAF). Breede water management area: Water resources assessment. Pretoria: DWAF; 2002. [ Links ]
 Correspondence:
Leanne Seeliger
seeliger@sun.ac.za
Received: 07 May 2018
Revised: 21 Aug. 2018
Accepted: 22 Aug. 2018
Published: 27 Nov. 2018

