


Serviços Personalizados
Artigo
 Inglês (pdf)
 Artigo em XML
 Referências do artigo
Indicadores

Links relacionados
-
 Citado por Google
 -
 Similares em Google
Compartilhar

 Permalink
South African Journal of Science
versão On-line ISSN 1996-7489
versão impressa ISSN 0038-2353
S. Afr. j. sci. vol.114 no.11-12 Pretoria Nov./Dez. 2018
http://dx.doi.org/10.17159/sajs.2018/4313
RESEARCH ARTICLE
Modelling the length of time spent in an unemployment state in South Africa
Jeanette Z. Nonyana; Peter M. Njuho
Department of Statistics, University of South Africa, Johannesburg, South Africa
ABSTRACT
The deteriorating global economic conditions have worsened the unemployment situation, especially among the youth in sub-Saharan Africa. Structural factors such as the length of time spent in unemployment and job sustainability have a considerable effect on the persistence of unemployment for an individual. Non-parametric models were fitted to data consisting of 4.9 million unemployed South Africans to determine the duration dependence and probabilities associated with unemployment. The prospect of finding employment depends on unemployment duration where the rate of finding employment decreases as the length of time in unemployment increases. On average, unemployment exit is observed at lower rates, which translates to people remaining unemployed for longer durations. The human capital of the unemployed deteriorates when more time is spent in an unemployment state, thus making one less employable. Based on the Markov chain processes results, the created jobs are less sustainable because the employed transition back to an unemployment state over time. These findings suggest that the problem of unemployment in South Africa is multidimensional.
Significance:
•The structural factors associated with unemployment should be modelled to address the unemployment situation in South Africa.
•The probability of remaining unemployed increases as the length of stay in unemployment increases.
•The lengthy unemployment duration results from a low rate of exiting unemployment.
Keywords: unemployment persistence; unemployment duration; non-parametric; duration dependence
Introduction
Unemployment is a universal problem; however, the problem is more extreme in some economies. South Africa is amongst the economies with extreme levels of unemployment. The average world unemployment rate was 6.0% in 2013; the regions comprising the sub-Sahara and countries in the Organisation for Economic Co-operation and Development (OECD) recorded higher unemployment rates than the average world rate - 7.7% and 8.0%, respectively.1,2 South Africa is one of the sub-Saharan countries with the highest unemployment rate (24.7%), together with Lesotho (24.7%), closely followed by Swaziland (22.5%)1,3; whilst Greece and Spain were the OECD countries with the highest unemployment rates, at 27.5% and 26.1%, respectively2.
Unemployment conditions are associated with dire economic factors and structural factors. The main economic condition that relates to unemployment is slow economic growth, which slows the demand for labour. In most economies, slow growth is responsible for aggravated unemployment rates, whilst levels of employment improve with improvement in economic conditions.
In South Africa, higher unemployment rates are observed even when the economy is doing well. This observation suggests that unemployment in South Africa is more related to structural factors than economic factors. The main structural factors that are responsible for the current unemployment conditions in South Africa are technological advancements and a skills mismatch.4 Statistics South Africa (Stats SA)5 indicates that a large section of the labour force is unskilled (that is, they have an educational attainment of below a matric qualification) and many people have never been employed. Technological advancement directs employment growth towards highly skilled sectors6, thus impacting negatively on the lowly skilled labour force7. The adjustment to new technologies by industries has resulted in decreased absorption rates among lowly skilled economically active persons.
The number of jobs in the manufacturing industry decreased from 2 million in 2009 to 1.8 million in 2015.3 The decrease in jobs in the manufacturing industry is attributed to technology and utilisation of sophisticated equipment.8 Manufacturing jobs in the USA decreased by 33% between 2000 and 2010, with technological advancement accounting for most of the decrease.9
Unemployment is reduced by increased levels of education.10 However, unemployment among South African graduates has increased from a rate of 7.6% in 2008 to 9.9% in 2013. According to Altman6, graduates' unemployment is associated with a qualifications mismatch. In addition to a qualification mismatch, Mok and Jiang11 found that, in China, graduate unemployment is also influenced by massification of higher education. In Africa, the increase in higher education enrolments is said to be disproportionate to the increase in economic growth.12 A notable increase of graduates has been observed in South Africa: the number of graduates with degrees or diplomas has increased by 21% between 2010 and 2014 (from 153 000 to 185 000).13 During the same period, Stats SA recorded an increase of 109 000 in the number of unemployed people with a tertiary qualification.3 According to Oluwajodu et al.14, graduate unemployment in South Africa is rising with unemployment.
Lack of skills, industrial adjustment and unemployment duration are other structural factors that impact negatively on South African unemployment rates. However, these factors result from technological advancement and the skills mismatch. Few studies have focused on unemployment duration as an important factor that impacts on unemployment conditions. Studies conducted to examine the impact of structural factors in the labour market have focused on membership of the workforce in a trade union, access to social security benefits, employment security, mismatch between job seekers and vacancies, minimum wage and factors which drive a wedge between consumer and producer prices.10 In this study, we focused on unemployment duration as a structural factor that impacts on the current unemployment condition in South Africa.
Unemployment duration is defined as the length of time individuals spend unemployed. In South Africa, an individual is said to be in long-term unemployment if they are unemployed for a continuous period of 1 year or longer; those unemployed for a period of less than 1 year are considered to be in short-term unemployment.15 The stability of any country correlates with its unemployment status.16 It is thus necessary to critically model the available data with a view to finding workable solutions.
Objectives
The objectives of the study were to:
•Investigate the impact of unemployment duration on unemployment persistence.
•Determine the sustainability of jobs by predicting labour market movements.
•Make policy recommendations based on the findings.
Methodology
Data sources
We conducted a secondary analysis on data from Stats SA. Stats SA is a government department in South Africa and is responsible for the collection and publication of official data. Data collected by Stats SA are cleaned and weighted before they are posted on the Stats SA website (http://interactive.statssa.gov.za:8282/webview/) for public usage. Stats SA is solely responsible for ethical considerations.
We used panel data of 4.9 million unemployed people. The panel is created by spanning two cross-sectional data sets from a Quarterly Labour Force Survey (QLFS). QLFS is a household-based survey conducted on a quarterly basis and its sample is based on a stratified two-stage design.15 Data on labour market activities of individuals aged 15 years and older who live in South Africa are collected for the QLFS.
The QLFS sample has features of a longitudinal survey, where 75% of the sample can be matched between two quarters. A panel is created by matching the overlapping sample. The QLFS panel data are designed to track movements of individuals between labour market status for subsequent quarters. Stats SA conducted a quality check for the QLFS panel where the results show that the data are fit for the desired purpose.
The different unemployment durations considered were: less than 3 months, 3 months to less than 6 months, 6 months to less than 9 months, 9 months to less than 1 year, 1 year to less than 3 years, 3 years to less than 5 years, and 5 years or more.
Statistical techniques
The choice of a statistical technique is dependent on the objectives and the nature of the data sets to be analysed. We applied non-parametric models because they are capable of handling incomplete observations or censored objects. The QLFS panel data showed these characteristics, as some people were not available for follow-up interviews. According to Jakoet17, existence of right censored subjects complicates event analysis. Goel et al.18 recommend Kaplan-Meier estimation as the best technique for computing a survival function in the presence of censored objects.
Kiefer19 applied hazard function models to address problems such as censoring associated with duration data. Witchert and Wilke20 recommend use of simple non-parametric models for administrative data, because of their limitations which include various forms of censoring. The unobserved heterogeneity in data sets is handled well by non-parametric models which lead to an understanding of the basics, and produce descriptive results.21
Studies on unemployment duration and the probabilities of leaving unemployment apply different types of data sets. Nickell22 used cross-sectional data, Narendrathan and Stewart23 used longitudinal data, Babucea and Danacica24 used administrative data and Mussida25 used rotating panel data. We applied panel data to identify the dynamic behaviour of the unemployed and control for omitted variables.
Kaplan-Meier estimator
The Kaplan-Meier estimator is a non-parametric estimator of a probability of remaining unemployed beyond time t (survival function).26 In this method, individuals who left the study before they became employed (censored) during a given time are counted among those who survived (those still unemployed when the study concluded) and were not considered as at risk for the next period.27 The Kaplan-Meier method sorts observations from shortest duration to longest duration, which allows for estimation of the probability of remaining unemployed beyond time t without making any assumption about the form of the function. The modelling of the probability of remaining unemployed is as follows:
Suppose T is the time it takes for an individual to secure employment. We define the proportion of those who found employment per given time (cumulative distribution) as:

such that the reverse cumulative equals the probability of remaining unemployed beyond time t, S(t), where

The estimator of S(t) is

where nj is the number of unemployed individuals (individuals at risk) at tj and dj is the number of employed individuals (number of events) at tj, for j = 1, 2, 3, 4, 5, 6 and 7, representing the respective unemployment durations.
Nelson-Aalen estimator
The Nelson-Aalen estimator provides an efficient means of estimating the accumulated probability of exiting employment (cumulative hazard function).28 The cumulative hazard function is then used to estimate the hazard function.
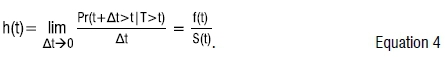
The hazard function h(t) for unemployment is the rate of exiting an unemployment state in an interval [t,t+h], for h very small positive number, given that one was in an unemployment state until time t. Hence for an infinitesimal ∆t,
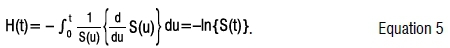
The cumulative hazard function, H(t), is defined as:
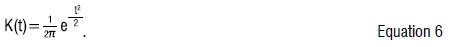
Hazard functions are estimated by applying smoothing techniques to the estimated cumulative hazard. However, the Kernel smoothing techniques for estimating hazard functions are inappropriate for the QLFS panel data. The time variable (unemployment durations) in the QLFS panel is categorical and the number of failures in each duration are mutually exclusive (different people are observed per duration). The Gaussian kernel, K(t), applied in the smoothing hazard has an exponential distribution of the form
We applied the Kaplan-Meier type estimate in Collett29 to estimate hazard functions for the QLFS panel.
The estimated rate of exiting unemployment in the interval t j to t j+1 is defined as:

where Ƭj = t j+1 - t j, and j = 1, 2 and 3 for employment, unemployment and inactivity, respectively.
Markov chains
Markov chain is a random process that changes with time, where the outcome of an experiment depends only on the outcome of the previous experiment.30 It is a statistical technique which studies chance processes for which the knowledge of previous outcomes influences predictions for future experiments.
The chances of moving from unemployment to either employment or inactivity (transition probabilities) are predicted by using the following equation (matrix multiplication):

where
 estimates the probability of leaving state i for state j in n+m steps, pik is the probability of being in state i in n steps, pkj is the probability of being in state j in m steps, for i = 1, 2, 3; j = 1, 2, 3; k = 1, 2, 3. Let 1 = employed (E), 2 = unemployed (U) and 3 = inactivity (I).
Analysis based on non-parametric models
The Kaplan-Meier estimator is applied to estimate the chance that an unemployed person will remain unemployed in a particular unemployment duration. The results are presented in Table 1.
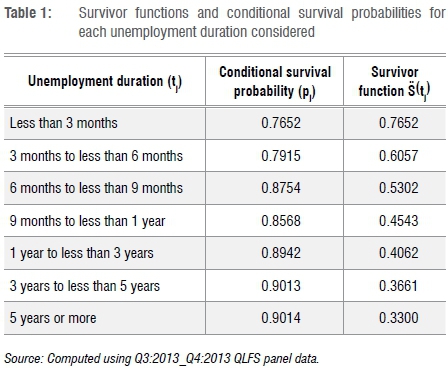
Given the different durations of unemployment, a survival function and conditional survival probabilities are estimated. The conditional survival probability estimates the chance of remaining unemployed per given duration (exclusive), whilst the survival functions estimate the collective chance of those who remained unemployed beyond a given duration. Survival functions are estimated by first calculating conditional probabilities.
For example, the conditional survival probability (pj) of those who searched for employment for a duration of less than 3 months, and the survival function (^S(t)) of those who searched for employment for a duration of 3 months to less than 6 months, are calculated, respectively, as follows:
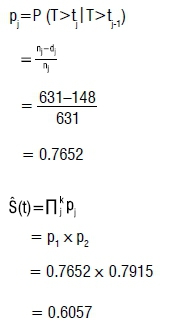
The results in Table 1 show that the conditional survival probabilities increase as the length of stay in unemployment increases. This implies that the likelihood of remaining in unemployment is high among those in long-term unemployment. On the other hand, the survival functions decrease as the length of stay in unemployment increases. The rate of decrease is higher among those who were in unemployment for up to 'less than 9 months'. This implies that people in short-term unemployment have higher unemployment exit rates.
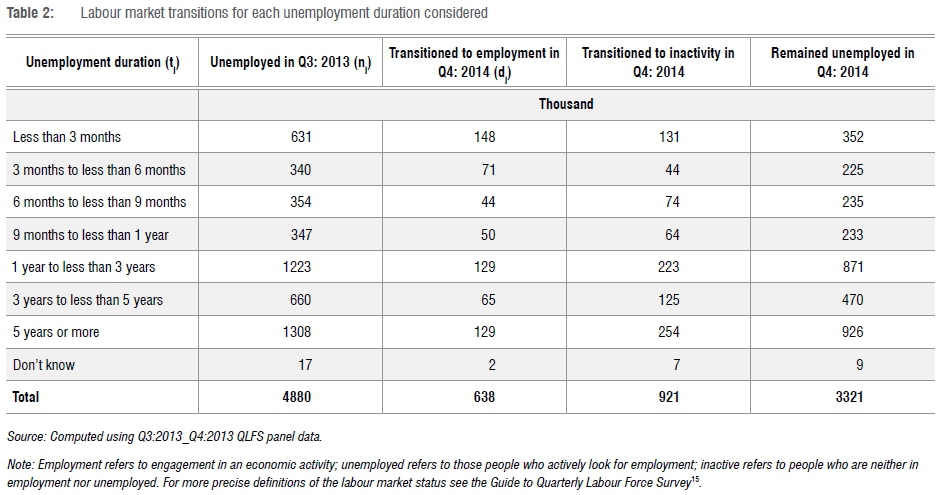
The results in Table 1 further show that the probability of staying unemployed levels out for those in long-term unemployment; that is, the probability of staying unemployed is constant for all those who were unemployed for 1 year or more. This finding suggests that people get discouraged and stop engaging in job search activities after they have searched for a year. The results in Table 2 indicate that the number of those who transitioned to inactivity was the highest amongst those who were unemployed for 1 year or more. According to Stats SA releases, discouraged work seekers account for the third largest group among the economically inactive.5
Transitioning from unemployment to another labour market status
Between two quarters, an unemployed person can either transition to employment or inactivity or remain unemployed. Table 2 shows the number of people who left unemployment to either employment (dj ) or inactivity, and those who remained in unemployment.
The people who were unemployed during the first wave (Q3: 2013) amounted to 4.9 million and 17 000 of them did not know their unemployment duration. The numbers of unemployed people per unemployment duration are mutually exclusive, that is, different people are observed for different unemployment durations.
A large number of people who were unemployed in Q3: 2013 became inactive in Q4: 2013, compared to those who found employment: 921 000 became inactive and 638 000 found employment (Table 2).
The rate of unemployment exit
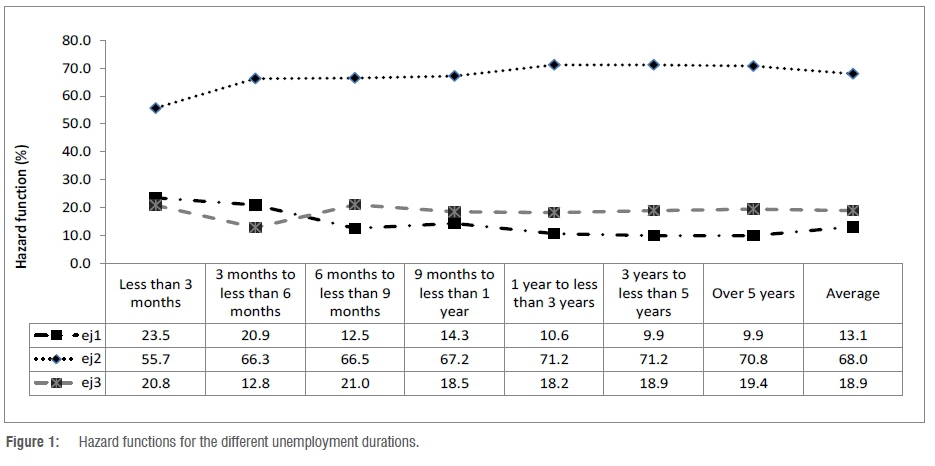
The Nelson-Aalen method was applied to estimate the rate of unemployment exit for the different unemployment durations (tj). These rates were calculated using the labour market transitions in Table 2 and the results are presented in Figure 1.
For example, the estimated hazard functions (rate of finding employment -e11, rate of remaining unemployed -e12 and rate of moving to inactivity -e13,) among those who looked for employment for a duration of less than 3 months are calculated using Equation 7 as follows:
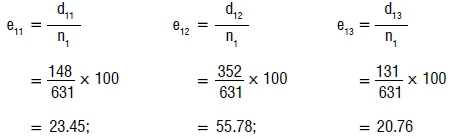
Note: d11 is the number of people who transitioned to employment, d12 is the number of people who remained unemployed and d13 is the number of people who transitioned to inactivity.
The results in Figure 1 suggest that there are minimal employment probabilities in South Africa. On average, an unemployed person transitioned into employment at a rate of 13.1% between two quarters. In addition to the minimal employment probabilities, the likelihood of remaining unemployed is high among those who were in unemployment for a longer duration.
The findings show higher employment transitions among those with an unemployment duration of less than 6 months. However slow exit rates are observed among those who are entering the labour market for the first time (new entrants). New entrants have no work experience and have never previously sought employment.12 The slow exit rates among new entrants increases their stay in unemployment, which evolves into unemployment persistence.
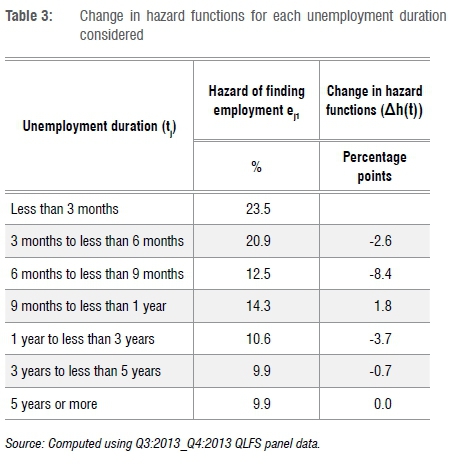
People who were unemployed for 6 months or longer transitioned into employment at lower rates. In contrast, they left unemployment for inactivity at a higher rate. Employment transition rates for this group ranged from 9.9% (among those who were unemployed for 3 years or longer) to 14.3% (among those who were unemployed for 9 months to less than 1 year). Inactivity transition rates ranged from 18.2% (among those who were unemployed for 1 year to less than 3 years) to 21.0% (among those who were unemployed for 6 months to less than 9 months).
Duration dependence
Duration dependence measures the influence of time spent in unemployment on the rate of unemployment exit. Duration dependence is determined by calculating the rate of change as:  , assuming that h(t) is differentiable.
Unemployment duration is a categorical factor which thereby poses challenges in calculating the rate of change. The change in rate of unemployment exit ∆h(t) is used to determine duration dependence.
The prospect of getting a job is said to be dependent on time spent unemployed if the rate changes for different unemployment durations.
That is, if:
∆h(t)>0, or
∆h(t)<0, for all t>0, then duration dependence holds.31
Duration dependence can be either positive or negative. Positive duration dependence happens when the rate of finding employment increases with unemployment duration. Negative duration dependence happens when the rate of finding employment decreases as unemployment duration increases. Duration dependence does not hold when the rate of finding employment remains the same between two unemployment durations.
That is, if:
∆h(t)=0, then the rate is constant.
Table 3 indicates how the rate of unemployment exit changes as unemployment duration changes. The results in Table 3 suggest negative duration dependence, where the rate of finding employment decreased as unemployment duration increased. However, duration dependence did not hold as and when unemployment duration increased to over 5 years.
Analysis based on Markov chains
We applied a Markov chain to predict transition probabilities for other quarters starting with Q1: 2014. The resulting transition matrices indicate predicted changes in labour market status (unemployment, employment and inactivity) as time increases.
The movement from one labour market state to the other defines a Markov process, and the process can start at any of the states (be it that of being employed, unemployed, or inactivity). The process started with unemployed people in Q3: 2013 who transitioned into other states in Q4: 2013.
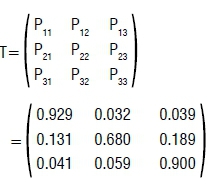
The transition probabilities in the 3 x 3 matrix T are calculated from the QLFS panel data - Q3: 2013_Q4: 2013 and they present labour market movement between Q3: 2013 and Q4: 2013.
Such that,
P11=0.929 is the probability of remaining employed
P12=0.032 is the probability of leaving employment for unemployment
P13=0.039 is the probability of leaving employment for inactivity
P21=0.131 is the probability of leaving unemployment for employment
P22=0.680 is the probability of remaining unemployed
P23=0.189 is the probability of leaving unemployment for inactivity
P31=0.041 is the probability of leaving inactivity for employment
P32=0.059 is the probability of leaving inactivity for unemployment
P33=0.900 is the probability of remaining inactive
In the next section, we apply a Markov chain to the 3 x 3 matrix T to predict the chances of moving from one labour market status to another (transition probabilities).
Prediction of transition probabilities
Transition probabilities for Q1: 2014 are predicted by using the matrix multiplication equation  .
.
The probability of retaining a job (p11) in Q1: 2014 is estimated as follows:
P11 = P11 P11 + P12 P21 + P13 P31
= (0.929)(0.929) + (0.032)(0.131) + (0.039)(0.041)
= 0.869
The other transition probabilities are calculated in the same way, and the resultant transition probability matrix for labour market movement between Q4: 2013 and Q1: 2014 is:
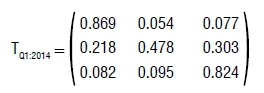
The matrix TQ1:2014 shows that the probability of retaining a job between Q4: 2013 and Q1: 2014 has decreased by 6.0%, when compared to those who retained their jobs between Q3: 2013 and Q4: 2014. Of those who transitioned from employment between Q4: 2013 and Q1: 2014, 3.8% went to inactivity and 2.2% became actively engaged in job seeking activities (unemployed).
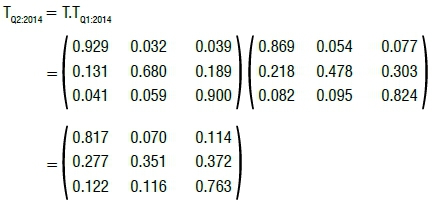
Transition probabilities for the second quarter of 2014 were predicted using the 3 x 3 matrix T and the 3 x 3 matrix TQ1:2014, such that:
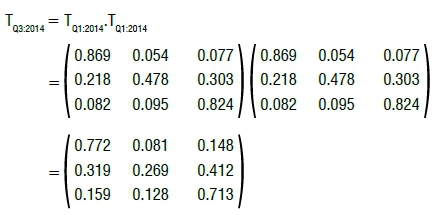
Transition probabilities for the third quarter of 2014 are predicted by solving the square of the matrix TQ2:2014 = T.TQ1:2014 , such that:
The observed quarterly labour market movements (Q3: 2013 to Q4: 2013) as shown by matrix T present a short-term structure of the labour market. Understanding the long-term structure of a labour market is key for decision-making and planning.32 Labour market prediction provides a basis for a long-term structure.33
The predicted labour market movements on matrix TQ3:2014 are illustrated in Figure 2.
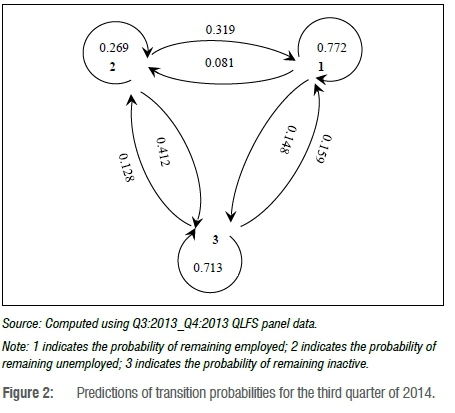
These predictions are for the period Q1: 2014 to Q3: 2014, where the matrix T is the input data (we have observed Q4: 2013 and we are making predictions for the three subsequent quarters). The predictions show that a person who was unemployed in Q4: 2013 had a 26.9% chance of remaining unemployed, a 31.9% chance of getting a job and a 41.2% chance of moving to inactivity in Q3: 2014. The employment retention rate is estimated at 77.2% over the period Q4: 2013 to Q3: 2014, with a 8.1% chance of moving to unemployment and a 14.8% chance of becoming inactive. Inactive people are estimated to remain in that state at a rate of 71.3%, with a 15.9% chance of moving to employment and a 12.8% chance of becoming actively involved in job search activities (unemployed).
Discussion
The findings show that the probability of leaving unemployment is not the same over a period of time. Lancaster and Nickell34 define this character as a probabilistic process. The results in Table 1 show higher conditional probabilities which increase as the time spent unemployed lengthens. Such conditions indicate that the unemployed remained in unemployment for a long time. According to Ciuca and Matei35, a labour market is damaging if the unemployed stay unemployed for a long time, regardless of the unemployment rate.
Figure 1 depicts higher unemployment retention rates than rates of exiting unemployment (Figure 1). The average rate of remaining unemployed is 68.0%; the lowest rate at 55.7% is for those who were unemployed for less than 3 months. In addition to the high rate of remaining unemployed, there is a greater share of those leaving unemployment for inactivity than for employment. The average rate of finding employment is 13.1%, whilst the average hazard of moving to inactivity is 18.9%. Narendranathan and Stewart23 suggest a distinction be made between exit to employment and exit to other states.
The results indicate that unemployment exit probabilities decrease as unemployment duration increases (negative duration dependence). A Weibull analysis by Brick and Mlatsheni36 arrived at similar results. These results suggest that the unemployed are more employable during their first 6 months in unemployment. The hazard rate of 23.5% among those who were unemployed for less than 3 months indicates limited employment opportunities.
The Markov chain processes show that the jobs created on a quarterly basis are not sustainable in the long term. While people are spending more time in unemployment, most of those who managed to exit unemployment are more likely to be without jobs within a year.
Limitations
Because survival data are characterised by censored objects and subjects have multiple entries, survival analysis techniques are therefore inadequate for analysis of mean time to failure or median time to failure. Cleves et al.26 suggest that the point at which the survival probability is 0.5 be used as the median. It is, however, not possible to realise the point at which survival probability is exactly 0.5, because non-parametric estimates are step functions.29
Cleves et al.26 recommend smoothing the discontinuities when estimating hazard functions. The standard Kernel-smoothing methodology could not be used on the QLFS panel data, because the time variable on the QLFS panel is categorical. The Kernel function applied in smoothing hazards has an exponential distribution.
Robustness of the results
The QLFS data violate the normality assumption and are also characterised by censoring. We have controlled for this challenge by using survival techniques in the analysis, as they are capable of handling censored subjects and allow the data to determine their functional form.
We applied the Kaplan-Meier type estimate in Collett29 to estimate hazard functions for the QLFS panel, as the time variable does not meet the requirement for Kernel smoothing. Collett29 does acknowledge that at times the use of the Kaplan-Meier type leads to irregular estimates of hazard functions. However, this method yields better results compared with the life table method because it uses exact survival times to make time stratification.
Conclusion
The South African labour market is characterised by high unemployment where the unemployed remain unemployed for longer durations. Ciuca and Matei35 refer to such labour markets as damaging. We have found that the average rate of exiting unemployment is very low, thus translating to lengthy unemployment duration. In addition to lower unemployment exit rates, the created jobs are less sustainable. The rate of those who transition to inactivity increases on a quarterly basis, whilst the rate of those who remain inactive over time is high. As people spend more time unemployed, their human capital and quality of life deteriorates. Without a job, people are unable to provide for the basic human needs of their families, and the level of poverty thereby increases. In trying to provide for these basic human needs, some resort to criminal activities. In addressing this social ill, we suggest a change in approach towards the unemployment problem, through development of econometric models. Effective strategies for reducing the period of unemployment can be implemented by modelling the factors that influence the period of unemployment.
Acknowledgements
The use of Stats SA data in this study is greatly acknowledged. J.Z.N. was employed by Stats SA when conducting the study and she is grateful to the management of Stats SA for instilling a culture of learning in their employees and for the financial support she received from the organisation during her studies. The University of South Africa provided a conducive environment in which to conduct this work.
Authors' contributions
J.Z.N.: Conceptualised the study; conducted the data analysis; discussed and interpreted the findings. P.M.N.: Contributed to the methodology selection, discussion and interpretation of the findings.
References
1.World Development Indicators: Unemployment. Washington DC: The World Bank Group; 2014. Available from: http://data.worldbank.org/indicator/sl.uem.totl.zs [ Links ]
2.Organisation for Economic Co-operation and Development (OECD). Incidence of unemployment by duration. Paris: OECD; 2014. Available from: https://stats.oecd.org/Index.aspx?DataSetCode=DUR_I [ Links ]
3.Statistics South Africa (Stats SA). Labour market dynamics in South Africa: Report 02-11-02. Pretoria: Stats SA; 2014. [ Links ]
4.Mafiri MI. Socio-economic impact of unemployment in South Africa. Pretoria: University of Pretoria; 2002. [ Links ]
5.Statistics South Africa (Stats SA). Quarterly labour force survey: Statistical release P0211. Pretoria: Stats SA; 2014. [ Links ]
6.Altman M. Youth labour market challenges in South Africa. Pretoria: HSRC; 2007. Available from: http://www.hsrc.ac.za/en/research-data/view/3620 [ Links ]
7.Organisation for Economic Co-operation and Development (OECD). Technology, production and job creation: Best policy practices, the OECD jobs strategy. Paris: OECD; 1998. https://doi.org/10.1787/9789264163416-en [ Links ]
8.Danso AK. The effect of technological changes on unemployment in the beverages sector of the South African economy. Potchefstroom: North-West University; 2007. [ Links ]
9.Sherk J. Technology explains drop in manufacturing jobs. Washington DC: Heritage Foundation; 2010. Available from: http://report.heritage.org/bg2476 [ Links ]
10.Morgan J, Mourougane A. What can changes in structural factors tell us about unemployment in Europe? Working paper no. 81. Frankfurt: European Central Bank; 2001. [ Links ]
11.Mok KH, Jiang J. Massification of higher education: Challenges for admissions and graduate employment in China. Singapore: Springer; 2017. p. 219-243. [ Links ]
12.Assie-Lumumba NT. Higher education in Africa: Crises, reforms and transformation. Working paper series. Dakar: CODESRIA; 2006. [ Links ]
13.Reddy V, Bhorat H, Powell M, Visser M, Arends A. Skills supply and demand in South Africa. Pretoria: LMIP; 2016. [ Links ]
14.Oluwajodu F, Blaauw D, Greyling L, Kleynhans EPJ. Graduate unemployment in South Africa: Perspectives from the banking sector. S Afr J Hum Resour Manage. 2015;13(1), Art. #656, 9 pages. https://doi.org/10.4102/sajhrm.v13i1.656 [ Links ]
15.Statistics South Africa (Stats SA). Guide to quarterly labour force survey: Report-02-11-01. Pretoria: Stats SA; 2008. [ Links ]
16.Castells-Quintana D, Royuela V. Desempleo y crecimiento economico a largo plazo: el papel de la desigualdad de ingresos y la urbanizacion [Unemployment and long-run economic growth: The role of income inequality and urbanisation]. Investigaciones Regionales. 2012;24:153-173. Spanish. [ Links ]
17.Jakoet J. The initial unemployment duration of immigrants to Khayelitsha/Mitchell's plain. Cape Town: University of Cape Town; 2007. [ Links ]
18.Goel MK, Khanna P, Kishore J. Understanding survival analysis: Kaplan-Meier estimate. Int J Ayurveda Res. 2010;1(4):274-278. https://doi.org/10.4103/0974-7788.76794 [ Links ]
19.Kiefer NM. Economic duration data and hazard functions. J Econ Lit. 1988;26(2):464-679. [ Links ]
20.Witchert L, Wilke RA. Simple non-parametric estimators for unemployment duration analysis. J R Stat Soc Ser C Appl Stat. 2008;57(1):117-126. https://doi.org/10.1111/j.1467-9876.2007.00604.x [ Links ]
21.Mills M. Introducing survival and event history analysis. London: Sage; 2011. [ Links ]
22.Nickell SJ. Estimating the probability of leaving unemployment. Econometrica. 1979;47(5):1249-1266. https://doi.org/10.2307/1911961 [ Links ]
23.Narendranathan W, Stewart MB. Modelling the probability of leaving unemployment: Competing risks models with flexible baseline hazards. J R Stat Soc Ser C Appl Stat. 1993;42(1):63-83. [ Links ]
24.Babucea AG, Danacica D. Using Kaplan-Meier curves for preliminary evaluation of the duration of unemployment spell. Annals of the University "Constantin Brancusi" of Targu Jiu. 2007:33-38. [ Links ]
25.Mussida C. Unemployment duration and compelling risks: A regional investigation. Milan: Università Cattolica del Sacro Cuore; 2007. [ Links ]
26.Cleves MA, Gould WW, Gutierrez RG. An introduction to survival analysis. Revised ed. College Station, TX: Taylor & Francis; 2004. [ Links ]
27.Kaplan EL, Meier P. Nonparametric estimation from incomplete observations. J Am Stat Assoc. 1958;53(283):457-481. https://doi.org/10.1080/01621459.1958.10501452 [ Links ]
28.Klein JP, Moeschberger ML. Survival analysis techniques for censored and truncated data. 2nd ed. New York: Springer-Verlag; 2003. [ Links ]
29.Collett D. Modelling survival data in medical research. 2nd ed. London: Chapman and Hall; 2003. [ Links ]
30.Kemeny JG, Snell JL. Finite Markov chains. New York: Springer-Verlag; 1976. [ Links ]
31.Wooldridge JM. Econometric analysis of cross section and panel data. Illustrated reprint. Cambridge, MA: MIT Press; 2002. [ Links ]
32.Wilson R, Czesana V, Simova Z, Kriechel B, Vetter T. Labour market anticipation: Lessons from around the world [document on the Internet]. c2016 [cited 2018 May 19]. Available from: https://assets.publishing.service.gov.uk/government/uploads/system/uploads/attachment_data/file/608083/Labour_Market_Anticipation.pdf [ Links ]
33.Rihova H. Using labour market information: Guide to anticipating and matching skills and jobs. Luxembourg: European Training Foundation; 2016. [ Links ]
34.Lancaster T, Nickell S. The analysis of re-employment probabilities for the unemployed. J R Stat Soc Ser A. 1980;143(2):141-165. https://doi.org/10.2307/2981986 [ Links ]
35.Ciuca V, Matei M. Survival analysis for the unemployment duration. Proceedings of the 5th WSEAS International Conference on Economy and Management Transformation; 2010 October 24-26; Timișoara, Romania. Timisoara: WSEAS Press; 2010. p. 354-359. [ Links ]
36.Brick K, Mlatsheni C. Examining the degree of duration dependence in the Cape Town labour market: Working paper series no.10. Cape Town: SADLRU; 2008. [ Links ]
 Correspondence:
Jeanette Nonyana
znonyana@randwater.co.za
Received: 26 Jan. 2018
Revised: 06 June 2018
Accepted: 13 Aug. 2018
Published: 27 Nov. 2018

